B.J van Jaarsveld
December 2013
Thesis presented in partial fulfilment of the requirements for the degree Master of Science in Engineering in the Faculty of Engineering at
Stellenbosch University
Supervisor: Prof H.J Vermeulen
i
DECLARATION
By submitting this thesis electronically, I declare that the entirety of the work contained therein is my own, original work, that I am the sole author thereof (save to the extent explicitly otherwise stated), that reproduction and publication thereof by Stellenbosch University will not infringe any third party rights and that I have not previously in its entirety or in part submitted it for obtaining any qualification.
B. J. van Jaarsveld December 2013
Copyright © 2013 Stellenbosch University
ii
ABSTRACT
The objective of this project is to develop an electromagnetic model that can be used to accurately calculate the voltage distribution in a transformer winding structure when excited with standard impulse excitation waves. This voltage distribution is required during the design stage of a power transformer to ensure that the insulation is capable of withstanding the occurring electric field stresses during these tests. This study focuses on the modelling of a single disk-type power transformer winding without the presence of an iron-core. Methods of calculating self- and mutual-inductances of transformer windings are presented and validated by means of finite element method software simulations. The same is done for the calculation methods used for calculating the capacitances in and around the winding structure. The calculated and FEM-simulated results are compared to measured values as a final stage of validation. The methods used to calculate the various model parameters seem to produce results that agrees well with measured values. The non-linear frequency dependant dissipative nature of transformer windings is also investigated and a methodology to take this into account is proposed and implemented. The complete modelling methodology proposed in this thesis, which includes the calculation of the model parameters, model synthesis and solver algorithm, are applied to an actual case study. The case study is performed on an air-core reactor manufactured using a disk-type power transformer winding. The reactor is excited with standard lightning impulse waves and the voltages along the winding are measured. The calculated and measured voltage wave forms are compared in both the frequency and time-domain. From the comparison it is found that the model accurately represents the actual transient voltage response of the test-unit for the frequency range of interest during standard factory acceptance tests.
iii
OPSOMMING
Die doel van hierdie projek is om 'n elektromagnetiese model te ontwikkel wat gebruik kan word om die spanningsverspreiding in 'n transformatorwindingstruktuur te bereken as standaard weerligimpulstoetse toegedien word. Hierdie spanningsverspreiding word vereis tydens die ontwerpstadium van ‘n kragtransformator om te verseker dat die isolasie in staat is om die elektriese veldsterkte tydens hierdie toetse te weerstaan. Hierdie studie fokus op die modelering van 'n enkele skyftipe-kragtransformatorwinding sonder die teenwoordigheid van 'n ysterkern. Metodes van berekening van self- n wedersydse-induktansie van transformatorwindings word aangebied en getoets deur middel van Eindige-Element-Metode (EEM) simulasies. Dieselfde word gedoen vir die metodes wat gebruik word vir die berekening van die kapasitansies in en rondom die windingstruktuur. Die berekende en EEM-gesimuleerde resultate word vergelyk met die gemeete waardes as 'n finale vlak van bekragtiging. Die metodes wat gebruik word om die verskillende modelparameters te bereken vergelyk goed met gemete waardes. Die nie-lineêre frekwensie-afhanklike verliese van transformatorwindings word ook ondersoek en 'n metode om hierdie in ag te neem is voorgestel en geïmplementeer. Die volledige voorgestelde modeleringsmetodiek in hierdie tesis, wat die berekening van die modelparameters, modelsintese en oplosingsalgoritme insluit word toegepas op 'n werklike gevallestudie. Die gevallestudie is uitgevoer op 'n lugkern-reaktor wat 'n skyftipe-kragtransformatorwinding. Die reaktor word onderwerp aan die standaard weerligimpuls golwe en die spanning al langs die winding word gemeet. Die berekende en gemete spanning golf vorms word met mekaar vergelyk in beide die frekwensie- en tyd-vlak. Uit die vergelyking blyk dit dat die model die werklike oorgangspanningsweergawe van die toetseenheid akkuraat verteenwoordig vir die frekwensie reeks van belang tydens standaard fabriekaanvaardingstoetse.
iv
ACKNOWLEGEMENTS
During research I have done in this project, I have had the privilege in being guided and mentored by renowned experts in this field of study. Without their help and the grace of my God this work would not have been possible. My sincerest gratitude goes to Robert Degeneff - president of Utility Systems Technologies (UST) - for sharing his knowledge gained by years of experience and his constant words of encouragement. I will treasure our casual discussions at the dinners in Albany. You have been a great mentor and friend – may God bless you and your family. I thank my supervisor at Powertech Transformers Pty. (Ltd) Nico Günter and the rest of the Technology team for creating a resourceful, productive and friendly environment at the office where I could focus on my research. Many thanks to Angélica Rocha and the other members of the Cigré joint workgroup A2/C4.39 for creating a platform for sharing knowledge and experience. I have learned a considerable amount from my interaction with this group of experts and hope that my contribution to the Cigré organisation and similiar entities will grow in value over time. A special thanks to my supervisor at the University of Stellenbosch, Johan Vermeulen. Your passion for the science of engineering and your philosopical discussions ensured that my time spent with you was insightful and enjoyable. I want to extend my gratitude to Baudilio Valecillos from TrafoExperts for his assistance and guidance in my research. Thank you for your positive attitude during the long hours we spent in the laboratory. To my wive Elsje, you have been a great friend and spouse to me. I love you dearly. Thank you for your patience and support with my research. To my mother Renette, thank you for your help in proofreading my work. Your support means a lot to me and I treasure your love with all my heart. Without the grace of my God and Saviour all my work in life would be of no value. I thank you Lord for your love and guidance through your Spirit, and your constant encouragement.
v In him was life;
and the life was the light of men. And the light shineth in darkness; and the darkness comprehended it not.
- John1:5
King James Bible, Cambridge Edition
vi
TABLE OF CONTENTS
Declaration ... i Abstract ...ii Opsomming ... iii Acknowlegements ...ivTable of contents ...vi
List of tables ...xi
List of figures ... xii
Symbols and abreviations ...xv
Chapter 1 Project description and motivation ... 1
1.1 Introduction ... 1 1.2 Project motivation ... 2 1.3 Project description ... 4 1.3.1 Project objective ... 4 1.3.2 Research objectives... 4 1.4 Thesis outline ... 6
Chapter 2 Literature review ... 8
2.1 Overview ... 8
2.2 Power transformer anatomy ... 8
2.2.1 Introduction ... 8
2.2.2 Transformer core assembly ... 8
2.2.3 Insulation material used in power transformers ... 10
2.2.4 Winding-block assembly of power transformers ... 10
2.2.4.1 Description of the transformer winding-block ... 10
2.2.4.2 Winding types commonly used in power transformers ... 13
2.2.4.3 Conductors commonly used in transformer windings ... 15
2.3 Transient voltages in power systems ... 16
2.3.1 Origin and characteristics of transient voltages ... 16
vii
2.4 Electromagnetic behaviour of transformer windings ... 18
2.4.1 Classification of winding response ... 18
2.4.2 Inductive behaviour of transformer windings ... 19
2.4.2.1 Background theory on inductance ... 19
2.4.2.2 Classical analytic inductance calculations ... 21
2.4.2.3 Analytical iron-core inductance calculations ... 21
2.4.2.4 Numerical inductance calculations ... 22
2.4.2.5 Inductance calculation considerations ... 23
2.4.3 Capacitive behaviour of transformer windings ... 23
2.4.3.1 Origin and classification of winding capacitances ... 23
2.4.3.2 Analytical capacitance calculations ... 25
2.4.3.3 Numerical capacitance calculation methods ... 26
2.4.3.4 Capacitance calculation considerations ... 26
2.4.4 Damping of oscillations due to losses ... 27
2.5 Evolution of modelling methodologies ... 30
2.5.1 Introduction ... 30
2.5.2 Electrical circuit equivalent models ... 30
2.5.2.1 Lumped- and distributed parameter models ... 30
2.5.2.2 Discretization of transformer windings ... 33
2.6 Solving electromagnetic models ... 35
2.6.1 Introduction ... 35
2.6.2 Common model formulations ... 36
2.6.2.1 State-space form ... 36
2.6.2.2 Nodal form ... 37
2.6.3 Time- and frequency-domain solution methods ... 37
2.7 Signal measurement ... 38
2.7.1 Effect of probe connections ... 38
2.7.2 Quantization- and ambient noise... 39
viii
2.8.1 Introduction ... 40
2.8.2 Sampling frequency ... 40
2.8.3 Frequency-domain signal analysis ... 40
Chapter 3 Modelling approach... 42
3.1 Selection of model type ... 42
3.2 Discretisation methodology of transformer winding structure ... 42
3.3 Inductance model development ... 43
3.3.1 Requirements and considerations ... 43
3.3.2 Self-inductance calculations ... 45
3.3.3 Mutual-inductance calculations ... 45
3.3.4 Compensation for cross-overs in disk windings ... 45
3.3.5 Structure of the inductance matrix ... 46
3.3.5.1 Branch-inductance matrix ... 46
3.3.5.2 Adjacency matrix definition ... 47
3.3.6 Calculation of winding inductance with parallel conductors ... 48
3.3.7 Validation of inductance calculations using FEM ... 48
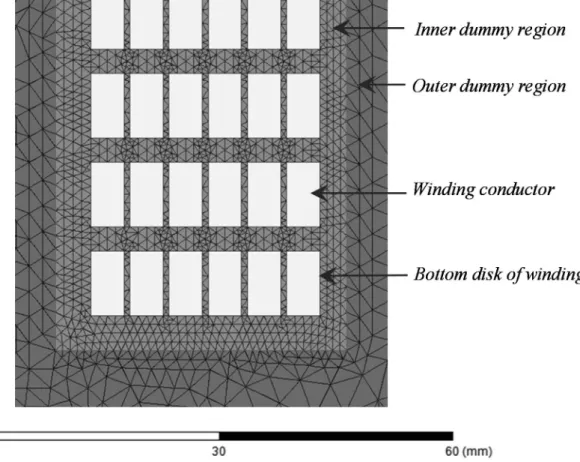
3.3.7.1 Description of geometry used in FEM modelling for validation ... 48
3.3.7.2 FEM simulation considerations ... 49
3.3.7.3 Detailed inductance matrix validation ... 55
3.3.7.4 Total winding inductance validation... 57
3.4 Capacitance model development ... 57
3.4.1 Calculating capacitances inside and outside of windings ... 57
3.4.2 Equivalent permittivities of composite insulation structures ... 58
3.4.3 Capacitance matrix ... 60
3.4.4 Capacitance model validation ... 62
3.4.4.1 Considerations for validation methods ... 62
3.4.4.2 FEM simulation configuration ... 63
3.4.4.3 Ground-capacitance validation ... 66
ix
3.5.1 Calculation of copper losses ... 66
3.5.2 Dielectric loss calculations ... 67
Chapter 4 Model formulations and solution algorithms ... 68
4.1 Introduction ... 68
4.2 Implementation of difference equation method on nodal model ... 68
4.2.1 Nodal formulated model synthesis ... 68
4.2.1.1 Difference equation method ... 70
4.2.1.2 Validation of solution routine ... 72
4.3 Application of ‘lsim’ function on a state-space formulation ... 74
4.3.1 State-space formulated model synthesis ... 74
4.3.2 Matlab linear simulation tool ... 74
Chapter 5 Model validation ... 77
5.1 Air-core reactor test-unit specifications ... 77
5.2 Experimental arrangement... 80
5.3 Simulation results ... 83
5.3.1 Introduction ... 83
5.3.2 LI excitation response ... 83
5.3.2.1 Measured LI system response ... 83
5.3.2.2 LI response of nodal formulation solved with DEM ... 84
5.3.2.3 LI response of state-space formulation solved with LSim ... 89
5.3.3 LIC excitation response ... 93
5.3.3.1 Measured LIC system response ... 93
5.3.3.2 LIC response of nodal formulation solved with DEM ... 93
5.3.3.3 LIC response of SS formulation solved with LSim ... 97
5.3.4 Function generated wave excitation ... 101
Chapter 6 Conclusions and recommendations ... 105
6.1 Introduction ... 105
6.2 Conclusions ... 105
x
6.2.2 Development of a modelling methodology ... 106
6.2.3 Calculation methods for the model parameters ... 106
6.2.4 Modelling of non-linear frequency dependant damping ... 107
6.2.5 Identification, implementation and validation of solver algorithms ... 107
6.3 Recommendations ... 108
6.3.1 Modelling effect of iron-core ... 108
6.3.2 Improved modelling of non-linear frequency dependant losses ... 109
6.3.3 Extending model to multi-winding configurations ... 109
References ... 110
Appendix A Calculation of impulse function constants ... 122
Appendix B Resistivity of materials ... 125
xi
LIST OF TABLES
Table 3-1: Inductance matrix of disk 1 (Ansoft Maxwell®) ... 55
Table 3-2: Calculated inductance matrix of disk 1 - Eq. (3.2) and (3.4) ... 55
Table 3-3: Deviation of calculated and simulated inductance values for disk 1 - Eq. (3.2) and (3.4) .. 55
Table 3-4: Mutual-inductance matrix of disk 1 and 82 (Ansoft Maxwell®) ... 56
Table 3-5: Calculated mutual-inductance matrix of disk 1 and 82 - Eq. (3.2) and (3.4) ... 56
Table 3-6: Deviation between calculated and simulated mutual-inductances - Eq. (3.2) and (3.4) ... 56
Table 3-7: Total winding inductance of test-unit... 57
Table 3-8: Dielectric constants (50 Hz)... 60
Table 3-9: Capacitance matrix of disk 40 using FEM (pF) ... 64
Table 3-10: Calculated capacitance matrix of disk 40 (pF) ... 64
Table 3-11: Deviation between FEM and calculated capacitances in disk 40 ... 64
Table 3-12: Capacitance matrix of disk 40 to 41 using FEMM (pF) ... 64
Table 3-13: Calculated capacitance matrix of disk 40 to 41 (pF) ... 64
Table 3-14: Deviation between FEM and calculated capacitances between disk 40 and 41 ... 65
Table 3-15: Total winding capacitance to ground ... 66
Table 5-1: Winding construction detail ... 77
Table 5-2: Winding conductor detail ... 77
Table 5-3 : Location of measured voltages ... 80
Table 5-4: Recurrent Surge Generator Parameter Values ... 82
xii
LIST OF FIGURES
Figure 2-1: Three-limb laminated transformer core ... 9
Figure 2-2: Complete power transformer winding-block assembly ... 11
Figure 2-3: Concentric arrangement of winding-block ... 12
Figure 2-4: Winding clamping structure [25] ... 12
Figure 2-5: Layer- and disk-type winding representation ... 13
Figure 2-6: Cross-overs in disk-type windings [24] ... 14
Figure 2-7: Turn configuration of ordinary- and interleaved disk windings [27] ... 15
Figure 2-8: Continuous Transposed Conductor (CTC) [32] ... 16
Figure 2-9: Standard full wave lightning impulse [7]... 18
Figure 2-10: Lightning impulse wave with chopped tail [7] ... 18
Figure 2-11: Transient voltage response for 100 disk winding [44]... 19
Figure 2-12: Current contour enclosing [47] ... 20
Figure 2-13: Leakage flux distribution in winding structure [24] ... 20
Figure 2-14: Initial voltage distribution of winding with grounded neutral [25] ... 25
Figure 2-15: Temperature and frequency dependency of transformer oil [72] ... 27
Figure 2-16: Effect of excitation frequency on dielectric constant (oil impregnated paper) [72] ... 27
Figure 2-17: Measured relationship between damping and frequency [14] ... 29
Figure 2-18: Empirically damped signal... 29
Figure 2-19: Modelling methods of electromagnetic systems ... 30
Figure 2-20: Distributed parameter model of a winding (mutual-inductance not shown) [18] ... 31
Figure 2-21: Lumped parameter model of winding segment ... 32
Figure 2-22: MTLM representing a uniform winding segment [81]... 32
Figure 2-23: Hybrid model of a winding [26] ... 33
Figure 2-24: Low order high frequency model of a power transformer ... 34
Figure 2-25: Reduction of capacitive model to a single -network ... 35
Figure 2-26: Reduction method of inductance matrix [67] ... 35
Figure 2-27: High frequency circuit of probe and test subject [90] ... 38
Figure 2-28: Digital quantisation of analogue signal [93] ... 39
Figure 2-29: Aliasing effect of under-sampled time-domain signal [92] ... 41
Figure 2-30: Non-zero discontinuities interpretation of FFT algorithm ... 41
Figure 3-1: Discretisation of disk winding ... 43
Figure 3-2: Main core limb discretisation ... 43
Figure 3-3: Current-filament approximation of conductors ... 44
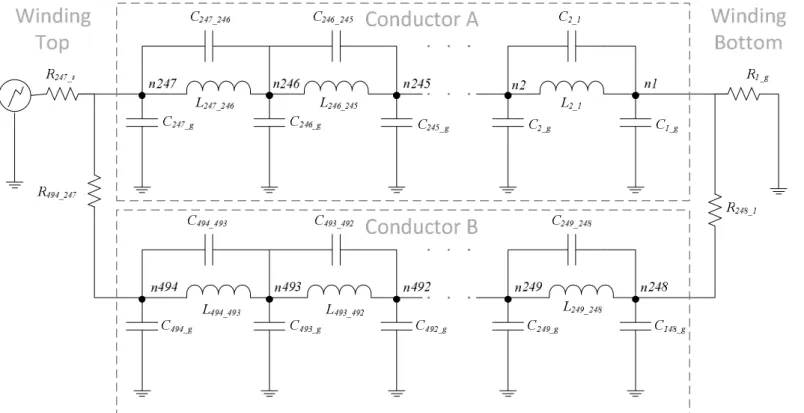
Figure 3-4: Network with node and branch allocations... 47
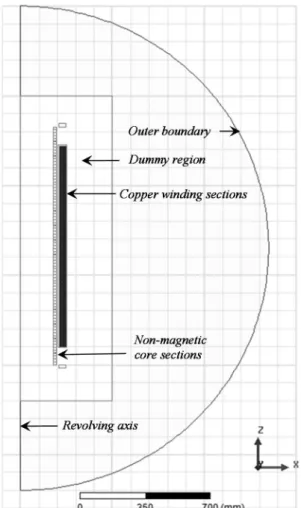
Figure 3-5: 2D FEM Geometry of test-unit ... 49
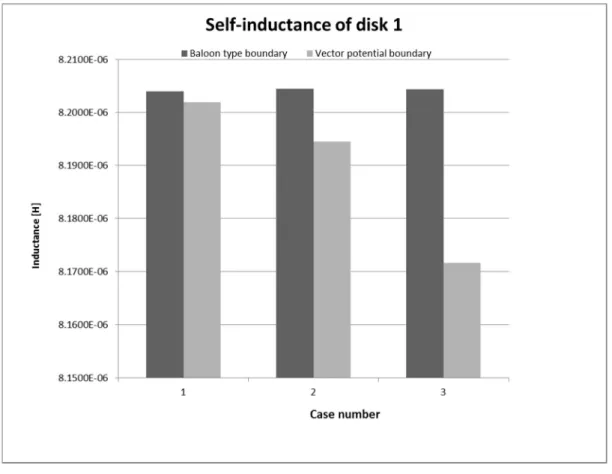
Figure 3-6: Boundary sensitivity of self-inductances ... 51
Figure 3-7: Boundary sensitivity of mutual-inductances ... 51
xiii
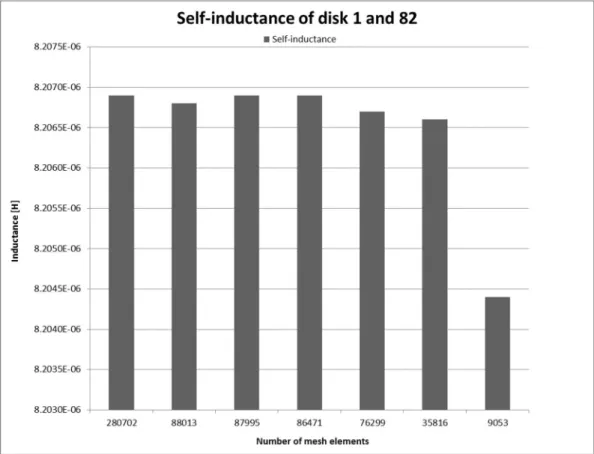
Figure 3-9: Change in self-inductance due to total number of mesh elements ... 53
Figure 3-10: Change in mutual-inductance due to total number of mesh elements ... 53
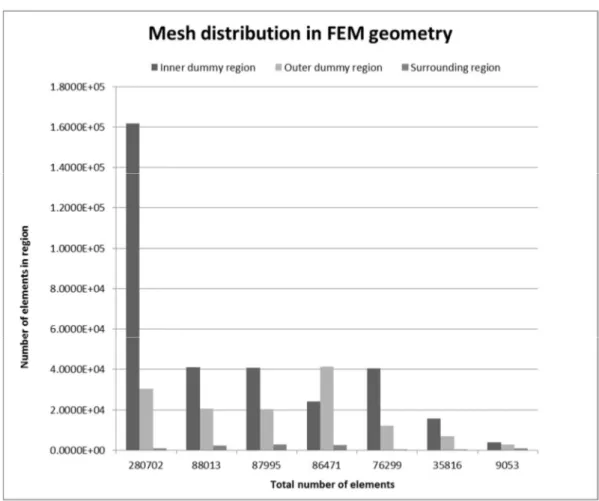
Figure 3-11: Number of elements in dummy regions used in mesh sensitivity analysis ... 54
Figure 3-12: Coaxial radially adjacent sections... 58
Figure 3-13: Insulation configuration for adjacent sections ... 58
Figure 3-14: Capacitance between sections ... 61
Figure 3-15: Redistribution of section capacitances... 61
Figure 3-16: Redistribution of multiple nodal capacitances ... 61
Figure 4-1: Synthesis of nodal formulated electromagnetic model ... 69
Figure 4-2: A Simple RLC circuit ... 70
Figure 4-3: Inductive element... 71
Figure 4-4: Equivalent resistive representation of inductive element ... 71
Figure 4-5: Capacitive element ... 71
Figure 4-6: Equivalent resistive representation of capacitive element ... 71
Figure 4-7: Purely resistive element ... 71
Figure 4-8: Step response of RLC circuit in using difference equation solving technique [104] ... 73
Figure 4-9: Step response of RLC circuit when compared to Laplace [104] ... 73
Figure 4-10: Synthesis of state-space formulated electromagnetic model ... 76
Figure 5-1: Geometrical detail of test-unit ... 78
Figure 5-2: Actual test-unit ... 79
Figure 5-3: Experimental arrangement ... 81
Figure 5-4: Diagram of experimental arrangement ... 81
Figure 5-5: Schematic of HAEFELY RSG 482 ... 82
Figure 5-6: Measured voltage along air-core reactor for actual LI ... 84
Figure 5-7: Measured and calculated voltages at disk 62 using DEM ... 86
Figure 5-8: Frequency content of voltages at disk 62 using DEM ... 86
Figure 5-9: Measured and calculated voltages at disk 42 using DEM ... 87
Figure 5-10: Frequency content of voltages at disk 62 using DEM... 87
Figure 5-11: Measured and calculated voltages at disk 20 using DEM ... 88
Figure 5-12: Frequency content of voltages at disk 20 using DEM... 88
Figure 5-13: Measured and calculated voltages at disk 64 using state-space formulation ... 90
Figure 5-14: Frequency content of voltages at disk 64 using state-space formulation ... 90
Figure 5-15: Measured and calculated voltages at disk 42 using state-space formulation ... 91
Figure 5-16: Frequency content of voltages at disk 64 using state-space formulation ... 91
Figure 5-17: Measured- and calculated voltages at disk 20 using state-space formulation ... 92
Figure 5-18: Frequency content of voltages at disk 64 using state-space formulation ... 92
Figure 5-19: Measured voltage along air-core reactor for LIC ... 93
Figure 5-20: Measured and calculated voltages at disk 62 for LIC excitation using DEM ... 94
Figure 5-21: Frequency content of voltages at disk 62 using DEM for LIC excitation... 94
xiv
Figure 5-23: Frequency content voltages at disk 42 using DEM for LIC excitation ... 95
Figure 5-24: Measured and calculated voltages at disk 20 for LIC excitation using DEM ... 96
Figure 5-25: Frequency content of voltages at disk 20 using DEM for LIC excitation... 96
Figure 5-26: Voltages at disk 62 using state-space formulation (LIC)... 98
Figure 5-27: Frequency content voltages at disk 62 using state-space formulation (LIC) ... 98
Figure 5-28: Voltages at disk 42 using state-space formulation (LIC)... 99
Figure 5-29: Frequency content voltages at disk 42 using state-space formulation (LIC) ... 99
Figure 5-30: Voltages at disk 20 using state-space formulation (LIC)... 100
Figure 5-31: Frequency content of voltages at disk 20 using state-space formulation (LIC)... 100
Figure 5-32: Voltages at disk 62 using state-space formulation (Generated LI) ... 102
Figure 5-33: Frequency content of voltages at disk 62 (state-space formulation with generated LI). 102 Figure 5-34: Voltages at disk 42 using state-space formulation (Generated LI) ... 103
Figure 5-35: Frequency content of voltages at disk 42 (state-space formulation with generated LI). 103 Figure 5-36: Voltages at disk 20 (state-space formulation with generated LI) ... 104 Figure 5-37: Frequency content of voltages at disk 20 (state-space formulation with generated LI). 104
xv
SYMBOLS AND ABREVIATIONS
ADC Analogue to digital conversion Cross-sectional area
Magnetic vector potential Enclosed surface area
Gradient factor of initial voltage distribution in winding Frequency dependant damping factor
, , Double-exponential equation constants
, Per unit length of materials in a per unit volume of composite insulation BIL Basic insulation level
Magnetic field density vector Capacitance
[ ] Branch capacitance matrix [ ] Nodal capacitance matrix
Capacitance of probe lead to ground , Capacitance of winding to ground
Capacitance between windings Series capacitance of winding
Capacitance of electrical turn to ground Capacitance between two turns
DEM Difference equation method
Vector partial-differentiation operator Distance between electrode surfaces Conductivity of material
Loss angle
Permittivity of vacuum
Equivalent permittivity of composite insulation structure
r Relative permittivity of material
FEM Finite Element Method
Fraction of electrical turns lost due to staggered cross-overs Frequency in Hertz
xvi Nyquist frequency
Sampling frequency
GMD Geometrical mean distance Conductance
[ ] Branch conductance matrix [ ] Nodal conductance matrix
Conductor height Magnetic field vector
Overlapping height of facing surfaces of adjacent conductors Current magnitude scalar value
Current vector
Resistive current through dielectric material Displacement current through dielectric material ( ) Injected nodal current column-vector
Current column-vector of MTLM at receiving node Current column-vector of MTLM at sending node [ ] The identity matrix
( ) Instantaneous current
( ) Instantaneous current column-vector Current vector
, Complete elliptic integral of first and second kind KVL Kirchhoff’s voltage law
KCL Kirchhoff’s current law
Modules of the Elliptic integral of first and second kind constant
Fraction of electrical turn lost due to cross-over staggering LI Lightning impulse wave
LIC Lightning impulse wave with a chopped tail LPM Lumped parameter model
Inductance
Ground loop inductance Total winding inductance [ ] Branch inductance matrix
xvii [ ] Nodal inductance matrix
[ ] Inverse nodal inductance matrix Length
Wave length
MTLM Multi transmission line model
MSE Mean square error of digitised signal Permeability of free space
Relative permeability of material Number of electrical turns
Number of electrical turns lost due to cross-over staggering Number of mechanical turns in winding
Number of pitches required to complete a crossover
Number of spacers around the circumference of the winding ODE Ordinary differential equation
[ ] The zero matrix Radial frequency Fundamental frequency Resistivity of material
RLC Collective of resistance, inductance and capacitance Resistance
Radius to centre of current filament Mean radius of winding
Shunt resistance of measuring probe Source output resistance
[ ] Nodal resistance matrix
Average radius between facing surfaces of two adjacent conductors Relative displacement
Skin depth
Sample interval of discrete signal [ ] Adjacency matrix
Time instant Time step size
xviii Time duration for LI wave to drop to 50% of peak value
Time duration for LI wave to reach 90% of peak value Time duration until chopping of LI wave tail
Rise-time of wave front of LI Paper thickness
Peak voltage amplitude
Voltage magnitude scalar value
Voltage column-vector at receiving end of MTLM Voltage column-vector at sending end of MTLM Velocity of wave propagation
( ) Instantaneous voltage
( ) Instantaneous voltage column-vector ( ) Discrete time-domain voltage
( , ) Instantaneous voltage as a function of position
Noise variance Energy
Conductor width Spacer width
( , ) Discrete-time windowing frequency dependant function
Position
[ ] Nodal admittance matrix
1
Chapter 1
Project description and motivation
1.1
Introduction
In our current society the use of electricity has become an integral component of the socioeconomic infrastructure [1]. Industries involved in manufacturing, mining and agriculture play a major role in the economy of a country. These industries are highly dependent on a stable electrical infrastructure. Health services, public transportation infrastructures and other basic service deliveries also require a reliable supply of energy.
The power grids in developing countries such as South-Africa, operate under extremely challenging conditions. Insufficient power generation, limited transmission line capacity, a lack of maintenance and a shortage of local content cripple the socioeconomic growth of these countries. The prospective development and upkeep of these electrical infrastructures are faced with various challenges relating to the available financial resources [2] [3].
The reliable supply of energy is not only a challenge faced by developing countries. Power utilities of countries with strong economies such as China are required to meet the ever increasing demand of electricity [4].
The reliability of the system components used in a power grid plays a crucial role in light of the scenarios portrayed above. One of these components is the large power transformer. Large power transformers are required throughout a power grid and are one of many system components required for the effective transmission of energy over large geographical areas. Failure of these transformers causes loss of revenue for both the power utility and its client. The client suffers downtime in production while the utility has considerable capital expenditure to repair or replace these components [5].
The reliability and longevity of these power transformers plays a critical part in the performance of the power grid. Therefore transformer manufacturers should ensure that the design and manufacture of these power transformers conform to international standards [6] [7]. Equally as important is the responsibility of the power utility to protect and maintain these transformers while in operation in its power grid.
A major concern in power grids regarding the safe operation of system components is the occurrence of voltage transients and overvoltages. These conditions are usually caused by current interruptions due to circuit breaker operations, energizing of unloaded transmission lines, load rejection and lightning surges on or near transmission lines [5] [8]. Transient
2
voltages are capable of disrupting power grids and may cause severe damage to electrical equipment [9] [10].
For many years the modelling of power grid components, when subjected to transient voltages, has been a matter of great interest [11]. Numerous studies have been done on the modelling of transmission lines, surge arrestors, electrical motors and power transformers in order to predict the behaviour of the system [12] [13] [14] [15]. These have enabled engineers and designers to take preventative measures to protect these components.
Power grids are subjected to continual changes. These transformations may be due to the replacement of old equipment, power grid expansion or the change in the behaviour of the demand-side electricity usage [2]. Although these transformations are essential, they pose new challenges in that they change the electromagnetic behaviour of the existing power grid.
If these behavioural changes are not understood, the failure of system components and disruption in power supply due to voltage abnormalities are unavoidable. To circumvent these dangers engineers and designers rely heavily on the accurate modelling of these systems to reduce the impact of transient- and overvoltage occurrences. Hence the availability of accurate electromagnetic models of power grid components such as power transformers is a key factor in ensuring a reliable supply of electricity.
1.2
Project motivation
The insulation structure of a large power transformer should be able to withstand the strain caused by transient voltages. To ensure that the insulation structure is adequate, the transformer is subjected to a variety of standardised factory tests after manufacturing. During these tests the transformer windings are excited with various specified periodic- and aperiodic wave shapes [6] [7].
When these excitation waves contain high frequency components, the capacitive nature of the transformer winding structure becomes noticeable [16] [17] [18]. The presence of these capacitances along with the inductive properties of the transformer winding forms an electromagnetic system of high order. This system is capable of resonating at various excitation frequencies causing voltage amplification in different parts in the transformer winding structure [12] [19] [20] [21]. If these amplified voltages exceed the insulation strength of the insulating materials, dielectric failure may occur.
In reality the standardised wave shapes are not representative of all the transient voltages that power transformers are exposed to. Each occurrence of a lightning- or switching event
3
is unique in wave shape and amplitude. If the actual occurring transient voltage excitation wave contains a frequency close to one of the major resonance frequencies of the transformer winding structure, dielectric failure is possible even if the transformer passed the specified acceptance tests [9] [22]. Preventative measures such as the implementation of surge arrestors are commonly used to protect power transformers, but are only sensitive to voltage amplitudes. Thus, although an incoming transient voltage wave has an amplitude well below the protection level of the surge arrestor, it is still capable of stimulating resonance behaviour in the winding structure which may cause dielectric failure [10] [22].
Both the power utility and the transformer manufacturer are faced with the challenge of predicting the behaviour of the transformer winding structure when subjected to transient voltage excitations. The transformer manufacturer must design the transformer to withstand the specified factory tests and the power utility must coordinate their system response to avoid unnecessary transient behaviour as far as practically possible.
During the design stage of the transformer unit, the design engineer requires the maximum voltages occurring in and around the winding structure when undergoing factory testing. This information enables the engineer to specify the required electrical clearances, insulation thickness and arrangement of insulation barriers to avoid insulation failure [23] [24] [25] [26]. In addition to this the designer can implement a variety of methods to improve the transient response of the winding structure, such as the use of interleaved- and shielded disk windings and the choice of winding arrangements [27] [25] [28].
The utility on the other hand can mitigate various transient occurrences caused by network switching operations. The impact of switching transient voltages can be lessened by implementing synchronise switching, damping resistors and snubber circuits [9] [29] [30].
In either application there exists the need for an electromagnetic model that can be used to calculate the transient voltage behaviour of the system. The model required is not necessarily the same for both. A reduced two port network model may be sufficient when analysing the power grid behaviour surrounding the transformer [31]. However, a detailed model is required during the transformer design stage. In order for the design engineer to specify the insulation structure, the voltage distribution throughout the transformer winding structure is required [23] [24] [26].
4
1.3
Project description
1.3.1
Project objective
The objective of this project is to develop an electromagnetic model that can be used to accurately calculate the voltage distribution in a transformer winding structure when excited with standard impulse excitation waves. These voltages are required during the design stage of the power transformer to ensure that the insulation is capable of withstanding the occurring electric field stresses during these tests.
It will be evident from Chapter 2 that the subject matter regarding the variety of transformer geometries, excitation wave types and boundary conditions is substantial. To ensure that the project is manageable, this study will focus on the modelling of a single disk-type power transformer winding. These winding types are common in core-type power transformers and are more complex than the more familiar spiral-type windings. It can be concluded from the literature survey presented in Chapter 2 that the principles applied in the modelling approach followed in this project are also valid for a complete transformer with other winding types. In this regard, the thesis presents a foundation that can be used for modelling the transient voltage behaviour of power transformers to determine the voltage distribution in its winding structures.
1.3.2
Research objectives
It is important to define the various research objectives required for the successful completion of the project. The following research objectives have been identified regarding this matter:
Development of a proper modelling methodology that can be applied to determine the voltage distribution in a power transformer’s winding structure when subjected to transient voltage excitations such as those found during standard factory acceptance tests
Development of methods to accurately calculate the model parameters. This includes calculations of the self- and mutual-inductances of transformer windings having various geometrical sizes and number of turns. The calculation of other parameters such as the capacitances in and around the winding and the dissipative elements are also required.
Development of a suitable methodology for modelling non-linear frequency-dependent damping parameters due to stray losses such as iron losses and dielectric losses.
5
Identification, implementation and validation of suitable solution methods to simulate the response of the model.
These research objectives form the key elements of this project. Each of these objectives requires the execution of various project tasks to meet the requirements of the project. These tasks include the following:
Perform a literature study to identify the various modelling approaches used in transient simulations of power transformers. The different model topologies and their characteristics should be reviewed. The survey should include methods used to calculate the self- and mutual-inductances of transformer windings and their capacitive elements. Special considerations such as the flux behaviour in the core during impulse testing and frequency dependant losses should be reviewed and their effect on the model parameters should be investigated in the survey. The conclusions drawn from the literature study will determine the choice of model topology, parameter calculation methods and solution method.
The calculation algorithms of the model parameters should be implemented in a software environment. A suitable environment must be identified to develop the code required for this project. Program code must be developed to calculate the inductive, capacitive and dissipative elements of a transformer winding from known electrical and geometrical information. The development of program code that creates the mathematical representation of the equivalent electrical circuit model of the transformer winding is required. A solver must be implemented in the program environment to calculate the voltage distribution throughout the winding structure.
An actual test-unit must be used as a case study. Standard lightning impulse excitation waves should be applied while the voltage distribution throughout the winding is measured. Special considerations regarding good practices when taking measurements should be identified and applied. The interaction between the measuring equipment and the test-unit should be investigated. This includes the input- and output impedance matching of the respective systems. Matters regarding data acquisition and its accuracy such as quantization errors and sampling frequency considerations must be investigated. For the purposes of this investigation, tests will be conducted on an air-core reactor rather than a complex multi winding transformer. This is due to the exploratory nature of the subject matter and the time constraints of the project.
6
The methodologies used to calculate the model parameters must be validated. This should be done by comparing results from multiple calculation methods. Finite Element Method (FEM) software should be used in this respect as a benchmark. The geometry of the test-unit must be drawn in the FEM software and appropriate boundary and material properties must be applied. Matters regarding the accuracy of FEM simulation results and their interpretation should be addressed. These include the sensitivity of the problem to the size of the mesh elements as well as the effect of the boundary conditions.
A method of generating the excitation waves mathematically should be investigated and implemented. The function parameters required should be calculated depending on the required wave properties.
The accuracy of the solver algorithm must be evaluated by comparing the solver output to another solution method. Both the time- and frequency-domain should be compared to determine the reliability of the solver. The matters contributing to the solver accuracy should be identified and applied to achieve reliable results.
The voltage distribution measured along the winding of test-unit should be compared with the calculated voltages. This requires careful evaluation of the results in both the time- and frequency-domain. To ensure the correct interpretation of the processed signals, digital signal processing (DSP) methods, including application of the Fast Fourier Transform (FFT), must be reviewed. The DSP operations should take due cognisance of the properties of the input signal, e.g. frequency bandwidth and dynamic range.
Upon completion of the project, areas of improvement must be identified to reduce or mitigate the discrepancies found when comparing measured and calculated results. Possible research opportunities should be clearly identified that will complement the outcomes of this project.
1.4
Thesis outline
Chapter 2 presents a critical literature survey on the modelling methods used for transient analysis. This requires a review of the power transformer architecture and the nature of transient voltages in power systems. Methods for determining the model parameters are also reviewed. The mathematical model representation and solution methods used in transient voltage studies are discussed. Important considerations regarding practical
7
measurements are discussed as well as some fundamental digital signal processing principles.
Using the principles discussed in Chapter 2, the development of the electromagnetic model is presented in Chapter 3. Initial discussions revolve around the choice of model type and the level of discretisation. Capacitance and inductance calculations are implemented and validated by means of finite element modelling. Chapter 3 also includes the method in which the damping of oscillating voltages in windings is modelled.
Chapter 4 presents the solvers used to evaluate the mathematical model of the electromagnetic system. The solver algorithms are implemented in a MATLAB environment. The results obtained using two different solving methods are compared in both the time- and frequency-domain.
The complete modelling approach is applied to a case study to validate the accuracy of the model and assess the performance of the different solvers. The experimental setup used to measure the voltage distribution at multiple positions along the test-unit is presented in Chapter 5. The measured and calculated results are compared in both the time- and frequency- domain.
Chapter 6 concludes the thesis by comparing the initial research objectives with the actual outcome of the project. The deviations between calculated and measured results are carefully evaluated and attributed to possible causes. Recommendations are made with regards to future research.
8
Chapter 2
Literature review
2.1
Overview
This chapter presents the supporting literature that pertains to the modelling of transient voltage behaviour of power transformer windings. A detailed description of the different components of a power transformer is presented, followed by a discussion on the causes and characteristics of transient voltages occurring in power grids. A historical overview is presented regarding the evolution of transformer modelling for transient voltage analysis. The methodologies of determining the model parameters and their effect on the transient voltage behaviour of the modelled transformer are presented. These matters will lay the foundation required to construct a suitable model to achieve the goal of this study. The chapter concludes with a discussion regarding considerations when taking practical measurements. Some considerations regarding digital signal processing and analysis are also reviewed.
2.2
Power transformer anatomy
2.2.1
Introduction
Generally two types of transformers are referred to in the power engineering industry namely distribution transformers and power transformers. Currently no clear definition exists in international standards that distinguish distribution transformers from power transformers [32]. For the purpose of this thesis, the term power transformer will refer to transformers with a power rating of greater than 5
MVA
.The major transformer components discussed in the following sections will be collectively referred to as the active part. The active part consists mainly of the magnetic core, and the winding-block. In accordance with the scope of this project, other external components such as the bushings and harness will be omitted.
2.2.2
Transformer core assembly
The core provides a low reluctance path for magnetic coupling between the primary and secondary windings. Power transformers have mainly two types of core constructions namely shell- and core-type [25] [24]. This dissertation will exclude shell type transformers since the physical construction between shell- and core-type transformers are completely different.
9
The most common assembly used in three phase core-type power transformers is the three-limb core as shown in Figure 2-1. Each phase is associated with its respective main three-limb. The main limbs of the three phases are magnetically connected via the horizontal top and bottom yokes [24] [28]. The operating flux density of these transformer cores are in the region of 1.7 Tesla. Both the core and its clamping structure are held at ground potential [33].
Figure 2-1: Three-limb laminated transformer core
The core is manufactured using silicon steel with low carbon content. The presence of the silicone crystalline structures reduces hysteresis losses and increases the permeability of the steel. Eddy current losses are reduced by constructing the core with laminated steel sheets that are coated with a thin layer of insulating material. The thickness of these laminated sheets varies between 0.3 and 0.25
mm
and they have a silicon content of approximately 3%.
The core laminates are held together by a steel clamping structure and tie bars [24] [23] [34].The stacked laminated core forms a stepped cross section approximating a circular form. The stepped profile and insulation coating on the laminates cause a loss in effective cross sectional core area with reference to the gross cross section. This ratio of effective- to gross
10
area is known as the space factor. For economic reasons it is crucial to maintain a high space factor to ensure effective use of the available core area [24] [34].
2.2.3
Insulation material used in power transformers
The insulation used throughout the active part of the transformer is mostly made from cellulose material. The cellulose material is obtained from processed timber [25]. The fibres in the cellulose material are made up of long polymer chains that enable the material to have a measure of elasticity [35].
The winding conductors and exit leads are covered in kraft paper. Kraft paper provides the required electrical insulation around a conductor. Fixtures providing mechanical support in and around the winding structure can be made of pressboard which is manufactured from compacted processed cellulose fibres to form a hard ridged material [28] [35].
The complete active part is submerged in transformer oil. The oil serves as a coolant and as an insulation medium since its breakdown strength is considerably higher than that of air [36]. The oil penetrates the cellulose structure of the pressboard and paper to form a composite insulation structure [35]. The oil also retards the ageing of the cellulose material.
It is very important for the cellulose material and the transformer oil to have a low content of moisture. Moisture reduces the electric strength of the insulation material and accelerates the rate of aging of the cellulose material. Ageing causes the breakdown of the polymer chains in the cellulose structure which jeopardises the mechanical strength of the material. The preferable moisture content of cellulose insulation material should be no more than 5 % [35] [25].
The choice of insulation material is very important when considering a composite insulation structure, especially with reference to the different dielectric constants of the materials. The dielectric constants of the materials should be as close as possible to each other in order to avoid electric field density enhancement due to dielectric displacement [37]. In general, mineral oil with a relative permittivity ( r) of 2.2 is used along with paper and pressboard
which has a r of 3.5 and 4.4 respectively [35].
2.2.4
Winding-block assembly of power transformers
2.2.4.1
Description of the transformer winding-block
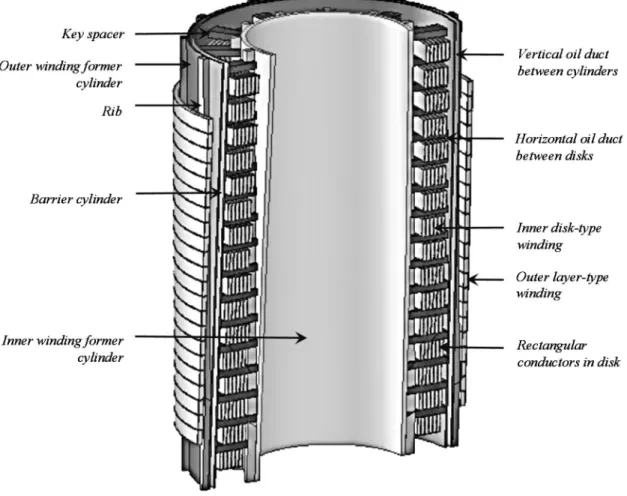
The winding-block refers to all the windings such as the high voltage (HV), low voltage (LV) and regulating windings pertaining to a specific phase. The windings are wound on circumferentially spaced ribs supported by a pressboard cylinder known as the
former-11
cylinder [32]. These windings are slid over each other, forming a concentric configuration that encloses the core limb as shown in Figure 2-2 and Figure 2-3 [38] [23]. The windings are separated with vertical ducts required for electrical clearance and to allow oil to flow along the height of the winding for cooling [24]. The oil ducts have multiple pressboard barriers residing in them, forming a composite insulation structure as presented in Figure 2-3 [23].
The winding-block is held securely in place by a clamping structure as shown in Figure 2-4, consisting of clamping rings made from pressboard [25]. These plates are inserted during assembly while applying an axial force on the windings. When the applied force is removed, the plates maintain a constant pressure on the windings. This is done to ensure that the winding structure remains rigid when subjected to electromagnetic forces during short-circuit events [24] [25].
12
Figure 2-3: Concentric arrangement of winding-block
13
2.2.4.2
Winding types commonly used in power transformers
In essence there are two common winding construction methods when referring to core-type power transformers namely spiral- and disk-wound windings [28] [34].
Spiral-type windings are wound continuously from the bottom to the top. The turns may be wound directly adjacent to each other to form what is commonly referred to as a layer-winding as presented in Figure 2-5 [23] [24]. Alternatively, key-spacers may be placed around the circumference between turns to increase the cooling surface. These windings are mostly referred to as helical-windings [32]. Spiral windings are mostly used in LV windings and are capable of carrying large currents due to the large cooling surface of each conductor [34].
Disk windings consist of pancake-like coils known as disks as presented in Figure 2-5. During the manufacturing of these windings a certain amount of turns are wound radially before crossing over to the next disk as shown in Figure 2-6 [24] [25]. The disks are separated by key-spacers creating radial ducts which allow oil flow for cooling purposes. Disk windings are typically used in HV winding applications since it is possible to have a multitude of electrical turns in a relatively small axial direction [34].
14
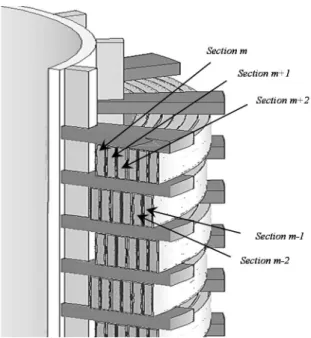
A matter to consider when specifying a disk winding is that the cross-overs as shown in Figure 2-6 causes a part of the electrical turn in the disk to be lost. Cross-overs are staggered to distribute them around the winding to ensure mechanical stability. The staggering is done by starting the cross-over one or multiple pitches prior to the previous cross-over. A pitch refers to the distance between the middle of two adjacent spacers or ribs. Thus the transition from disk A to disk B requires the conductor to cross over before revolving a full 360º.
The number of turns lost due to staggering can be calculated if the total number of spacers around the circumference of the winding ( ) is known as well as the number of pitches used for staggering ( ). If a winding has disks, 1) cross-overs are required. A full turn will cover all the pitches around the circumference. The fraction of the turn that is lost due to the staggering is then:
= . (2.1)
This fraction is lost at every cross-over and so the total number of turns lost is:
= ( 1) . (2.2)
Figure 2-6: Cross-overs in disk-type windings [24]
A great advantage of disk windings in high voltage applications is the ability to interleave electrical turns. Interleaving entails the non-sequential ordering of electrical turns as
15
presented in Figure 2-7 [27] [39]. Interleaved windings may reduce the non-linear transient voltage behaviour of the winding as will be seen in subsequent discussions. Floating conductors can also be wound in disk windings - known as wound-in-shields - to improve the transient voltage distribution along the winding [28].
Figure 2-7: Turn configuration of ordinary- and interleaved disk windings [27]
2.2.4.3
Conductors commonly used in transformer windings
The conductors used in the windings are typically rectangular in cross-section and insulated with cellulose paper. Copper is the preferred conductor material due to its mechanical strength concerning short-circuit forces, but in some cases aluminium could also be used [32] [34].
High winding currents result in heat generation due to the winding resistance. These losses can be reduced by increasing the cross sectional area of the conductor. However since the windings are situated in an oscillating magnetic field, eddy currents are formed on the conductor surface. If the cross sectional area of the conductor is increased the outer surface becomes larger increasing the losses caused by eddy currents [23].
To address this challenge, multiple conductors can be used in parallel rather than increasing the cross sectional area of one conductor. Other means of reducing eddy losses in windings while maintaining a large cross sectional area is by using Continuously Transposed Conductors (CTC). This is a special type of conductor that contains multiple enamel coated rectangular strands that are periodically transposed as presented in Figure 2-8 [32].
16
Figure 2-8: Continuous Transposed Conductor (CTC) [32]
Transpositions of parallel conductors or strands are necessary to ensure that the same amount of flux is enclosed by the parallel conduction paths. If this is not done a potential difference will occur between the parallel paths resulting in circulating currents. This would cause additional losses in the windings [32] [24]. When multiple conductors are used in a disk winding, the conductors are transposed at the cross-over to avoid circulating currents.
2.3
Transient voltages in power systems
2.3.1
Origin and characteristics of transient voltages
A power transformer is exposed to various abnormal transient voltages during its operation in a power grid. Transient voltages are caused by various events in the network such as lightning surges, current interruptions by circuit breakers, energization of various network components and faulty conditions in the network [5] [15]. These transient voltages may either have aperiodic- or periodic wave shapes and can have amplitudes much higher than the transformer’s rated operating voltage.
The classification of transient voltages is not a trivial matter since almost every transient voltage event is unique with reference to its wave profile and amplitude. Therefore the most practical method of distinction is with reference to the frequency content of the transient wave. Transient voltages can be classified into four groups namely low-frequency oscillations, slow-front surges, fast-front surges and very fast-front surges [40].
Low-frequency oscillations range from 0.1
Hz
to 3kHz
. These oscillations are typically caused by inrush currents when transformers are energized [41]. The transformer core may have had a remnant flux after its former disconnection [24]. When energised this may cause the core to saturate causing harmonic disturbances on the excitation voltage [25].Slow-front surges contain frequencies between 50
Hz
and 20kHz.
Switching of capacitor banks is a typical cause of these surge types [30]. The circuit in which the capacitor bank17
resides contains inductive properties forming a resonance circuit. The instantaneous application of the excitation voltage may stimulate the natural frequency of the circuit resulting in oscillatory overvoltage [5].
The frequencies of fast-front surges range from 10
kHz
to 3MHz
and are usually caused by re-ignitions during circuitbreaker operations. These are caused by the residual voltage stored in the capacitance of supplied network after the contacts of a circuit breaker separated. These arcs may strike repetitively causing oscillatory voltage waves [5]. Fast-front surges may also be caused by lightning impulses on or near power grid components [10].Very fast-front surges are mostly found in Gas Insulated Substations (GIS) during the switching events of disconnectors. The frequency content or these wave forms ranges between 100
kHz
and 500MHz
[8].2.3.2
Standardised waves shapes
The standard lightning impulse (LI) wave profile as shown in Figure 2-9 [7] can be approximated with a double exponential function. The instantaneous voltage ( ) is expressed as [42] [43]:
( ) = , (2.3)
where the parameters , and are dependent on the rise time and the time taken to drop to half the crest value. The rise time is defined by the duration that it takes the signal to rise from 30% to 90% of its peak value where both values are evaluated respectively at and . The parameters in equation (2.3) can be solved by means of the Newton-Rapson method as shown in Appendix A. The standard LI is used in routine factory tests and has a of 1.2
µs
and a of 50µs
[6] [7].Another common transient voltage wave used for testing, is the standard lightning impulse wave with a chopped tail (LIC) as presented in Figure 2-10. This wave profile is generated by collapsing the full wave voltage at an instance . The LIC is not currently a mandatory test according to international standards, but some customers may request it as a special test. To generate a LIC the LI wave profile is chopped at ranging between 3 to 6
µs
[7].18
Figure 2-9: Standard full wave lightning impulse [7]
Figure 2-10: Lightning impulse wave with chopped tail [7]
2.4
Electromagnetic behaviour of transformer windings
2.4.1
Classification of winding response
During normal power frequency excitation the voltage distribution along the winding is nearly linear. The voltage distribution is governed by the turn ratio and resistive losses along the length of winding [25]. This is the typical inductive behaviour of a winding during low frequency excitation.
When a transformer winding is excited with a voltage wave form with a steep front the voltage distribution throughout the winding is non-linear as presented in Figure 2-11 [44]. The transient voltage behaviour is categorised into three distinctive periods namely the initial-, transient- and pseudo-final response [17] [18] [45]. Each of these periods are governed respectively by the winding’s capacitive, inductive and dissipative nature [46].
19
Figure 2-11: Transient voltage response for 100 disk winding [44]
2.4.2
Inductive behaviour of transformer windings
2.4.2.1
Background theory on inductance
During normal power frequency operation, the prominent behaviour of a transformer is inductive [16] [17]. The inductance of a winding is governed by the distribution of magnetic flux in the region enclosed by the winding. A current flowing along a closed contour produces a magnetic flux in the enclosed surface as presented in Figure 2-12 [47]. The self-inductance of the contour having turns is defined by the relation [48]:
= . (2.4)
If two current contours are in close proximity of each other enclosing a surface they will couple magnetically with each other. The mutual-inductance due to the flux set up by the current in nearby loop, can be expressed by the equation:
20
Figure 2-12: Current contour enclosing [47]
The magnetic field can also be influenced by nearby ferromagnetic material. If a ferromagnetic material is placed in the magnetic field enclosed by the current contours, the magnetic domains of the material will line up with the magnetic field [47] [49]. This causes the magnetic material to act as an induced magnetic source further enhancing the magnetic field. Hence the presence of the magnetic material will cause the inductance of the circuit to increase since the total magnetic flux in the enclosed region increases. It is therefore critical to evaluate the magnetic flux behaviour in and around the winding-block of a power transformer when determining the inductance parameters.
The magnetic flux distribution in the core and winding-block depends on the loading conditions of the transformer [32] [24]. If the transformer is unloaded most of the magnetic flux resides in the core. However, under operating conditions with a lagging load current, the magnetic flux in the core leaks into the winding structure as shown in Figure 2-13 [32] [50]. This leakage flux is a portion of the flux created by both windings that does not link with each other.
21
2.4.2.2
Classical analytic inductance calculations
The effect of the iron-core is neglected in various inductance models used for voltage transient studies. When the winding structure is excited with an impulse, the inability of current to change instantaneously through an inductor implies that a negligible amount of flux will be set up in the core during the initial-response period [51]. Another matter to consider is that the effective permeability of the core steel decreases at higher frequencies [16] [52] [53]. Considering these matters, many inductance models assume an air-core.
Maxwell introduced an analytical formula for calculating the self-inductance of an air-core coil with a rectangular cross section [54]. Lyle improved the accuracy of this analytical formula by approximating the conductor with multiple current-carrying filaments [54]. The self- and mutual-inductances of these filaments were calculated by means of the elliptic integral formula from which the total self-inductance of the conductor was derived. In some applications a single current-filament representation of each turn of the conductor in a coil was sufficient [23]. The method proposed by Lyle could also be used to calculate the mutual-inductance between two rectangular conductors based on work done by Rosa [55].
The evaluation of these analytical formulas was a cumbersome exercise in early studies due to the absence of digital computers. For this reason Grover wrote a publication on inductance calculations by means of tabular data [56] [57] [58]. However, tabular data are valid only for a limited variety of conductor configurations and some inaccuracies become noticeable when working with peripheral tabular data [59].
2.4.2.3
Analytical iron-core inductance calculations
The presence of the iron-core can only be ignored under certain circumstances. When the secondary winding is short circuited – as done during standard LI testing [7] – the currents produce a magnetic flux in the core opposing the main flux. Thus, no flux resides in the magnetic core and it can be assumed to be air [60]. However, if the terminal conditions of the winding allow flux to form in the iron-core, the inductive behaviour of the winding structure changes significantly [60]. The reduced effective permeability of the iron-core at high frequencies also does not disqualify the iron-core’s effect. Even at excitation frequencies of 1
MHz
the effective permeability of the core is still a contributor to the magnetic flux behaviour [61].The importance of considering the presence of the iron-core became evident in studies done by Abbeti [20]. His publications show that the iron-core has a significant effect on the
22
mutual-inductances. With the use of air-core models, the mutual-inductance was often omitted or considered only for adjacent turns [18] [52].
Abbeti measured the natural frequencies of windings with and without a magnetic core and compared them to his calculated results. He first considered no mutual coupling between any conductors followed by considering coupling to only the immediate adjacent turns. His final comparison was done by evaluating the mutual inductive coupling between a conductor and the two consecutive turns on either side. His study showed that the measured natural frequencies of a winding with an iron-core correlate better with the calculated frequencies when mutual-inductive coupling is considered between non-adjacent turns due to the presence of the iron-core [20].
Abbeti attempted to use an iron-core inductance model in an electromagnetic model of a transformer winding [62]. His work was based on empirical data showing that a winding having an iron-core can be approximated with an equivalent air-core having a larger diameter [63].
Analytical methods for calculating winding inductance with an iron-core remain a challenging exercise due to the non-linear behaviour of the core. Rabins developed an analytical method for calculating the magnetic flux distribution in the presence of an iron-core. By calculating the vector potential in a region with a relative permeability of and a current vector where:
= , (2.6)
he derived the inductance from the flux distribution in the evaluated region. As boundary conditions he assumed that the flux was radially unbounded in the top- and bottom yokes that the core had an infinite permeability [64]. Hence no radial flux component exiting the core was considered.
Other analytical methods used in transient studies used a different approach. These methods mainly revolved around adding a term to the calculated air-core flux. The correction term represents the induced flux generated by the magnetic core and the change in the magnetic field outside the winding [59] [65].
2.4.2.4
Numerical inductance calculations
Alternative methods of calculating inductance are by means of Finite Element Modelling (FEM) using two or three dimensional geometries [25] [66]. These simulations should be performed with careful consideration regarding the meshing criteria and specifications of the
23
boundary conditions. The sensitivity of the required results to the mesh size and boundary conditions, is determined by recursively evaluating the results after successive changes in the mesh size or boundary condition [25].
The inductances between the various current carrying conductors are calculated by recursively applying a per unit ampere excitation to each conductor while the other conductors contain no current [66]. The return path of the current is assumed to be outside the problem region. For each recurrence the stored energy between two sections and , due to the current , are calculated from which the mutual-inductance is derived using the relation [25] [28]:
= 12 . (2.7)
2.4.2.5
Inductance calculation considerations
During high frequency excitation the current does not distribute uniformly in the cross section of the conductor [47] [50]. This displacement of current affects the magnetic flux distribution in and around the conductor which results in a change of inductance [65] [67]. In light of this, when the above mentioned methods are used it should be acknowledged that the calculated inductance is only valid for a limited frequency range.
2.4.3
Capacitive behaviour of transformer windings
2.4.3.1
Origin and classification of winding capacitances
When a winding is excited at very high frequencies such as those found in steep fronted voltage waves, it behaves like a capacitor [16] [11] [18] [51]. It is established that the capacitive behaviour of the transformer winding governs approximately the first 0.1
µs
[39] [27] [45]. Traditionally the capacitances in a winding structure have been divided into three distinct types [38]. In this thesis these capacitances will be respectively referred to as series-, shunt-, and ground-capacitance.Adjacent turns have surfaces facing each other separated by a composite insulation of mineral oil and paper. This configuration provides a space in which an electrical charge can be stored. An electrical charge can also be stored between consecutive disks. These capacitive structures collectively form what is known as the series-capacitances of a winding [27] [39].
24
The concentric configuration of the windings as shown in Figure 2-3, forms a similar structure as found in a cylindrical capacitor. Capacitive coupling occurs between adjacent windings which are commonly referred to as shunt-capacitances [14] [46].
Another capacitive component that plays an important role in the transient behaviour is the capacitive coupling of the complete winding structure to ground [17]. This capacitive coupling mainly occurs between the inner-most winding to the core limb and the outer winding to the tank wall.
The contribution of the capacitances in and around the winding structure became evident in studies done by Blume and Boyajian when observing the voltage distribution throughout the winding during the initial response time [17]. The initial transient voltage response of the winding is largely dependent on the ratio of the ground-capacitances to the series-capacitance in the winding. For a unity voltage step wave the initial voltage distribution as presented in equation (2.8) is governed by the gradient factor presented in equation (2.9) [17] [18].
For a winding with a grounded neutral, the voltage along the winding length at the position is shown in Figure 2-14 using the relation:
( ) = ( )( ) (2.8)
where:
= (2.9)
and
= . (2.10)
The initial voltage distribution for different values for a winding with a grounded neutral is represented in Figure 2-14. Evidently the voltage distribution is linear if there is no capacitance to ground similar to that of suspension insulators [16]. With a decrease in series-capacitance with respect to , the initial voltage distribution concentrates near the terminal subjected to the surge, resulting in a highly non-linear voltage distribution [68]. The series-capacitance can be increased by reducing the specified distance between disks and adjacent turns, but is constrained by the required electrical clearance.
![Figure 2-17: Measured relationship between damping and frequency [14]](https://thumb-us.123doks.com/thumbv2/123dok_us/10142155.2915516/48.892.230.666.103.860/figure-measured-relationship-damping-frequency.webp)
![Figure 4-8: Step response of RLC circuit in using difference equation solving technique [104]](https://thumb-us.123doks.com/thumbv2/123dok_us/10142155.2915516/92.892.231.649.133.1081/figure-step-response-circuit-difference-equation-solving-technique.webp)
