ORIGINAL ARTICLE
Mendelian Randomization Analysis Reveals a Causal
In
fl
uence of Circulating Sclerostin Levels on Bone
Mineral Density and Fractures
Jie Zheng,
1Winfried Maerz,
2,3,4Ingrid Gergei,
4Marcus Kleber,
4Christiane Drechsler,
5Christoph Wanner,
5Vincent Brandenburg,
5Sjur Reppe,
6,7Kaare M Gautvik,
7,8Carolina Medina
‐
Gomez,
9Enisa Shevroja,
9Arthur Gilly,
10,11Young
‐
Chan Park,
10,12George Dedoussis,
13Eleftheria Zeggini,
10,11Mattias Lorentzon,
14,15,16Petra Henning,
14Ulf H Lerner,
14Karin H Nilsson,
14So
fi
a Movérare
‐
Skrtic,
14Denis Baird,
1Benjamin Elsworth,
1Louise Falk,
1Alix Groom,
1,17Terence D Capellini,
18,19Elin Grundberg,
20,21Maria Nethander,
14Claes Ohlsson,
14George Davey Smith,
1* and Jonathan H Tobias
1,22*
1
MRC Integrative Epidemiology Unit (IEU), Bristol Medical School, University of Bristol, Bristol, UK
2
Clinical Institute of Medical and Chemical Laboratory Diagnostics, Medical University of Graz, Graz, Austria
3SYNLAB Academy, SYNLAB Holding Deutschland GmbH, Mannheim, Germany 4
Vth Department of Medicine (Nephrology, Hypertensiology, Rheumatology, Endocrinology, Diabetology), Medical Faculty Mannheim, University of Heidelberg, Mannheim, Germany
5
Department of Cardiology and Nephrology, Rhein‐Maas‐Klinikum Würselen, Germany
6Department of Medical Biochemistry, Oslo University Hospital, Oslo, Norway 7
Unger‐Vetlesen Institute, Lovisenberg Diaconal Hospital, Oslo, Norway
8Institute of Basic Medical Sciences, University of Oslo, Oslo, Norway
9Department of Internal Medicine, Erasmus MC University Medical Center, Rotterdam, The Netherlands 10
Human Genetics, Wellcome Sanger Institute, Wellcome Genome Campus, Hinxton, UK
11Institute of Translational Genomics, Helmholtz Zentrum München, German Research Center for Environmental Health, Neuherberg, Germany 12
University of Cambridge, Cambridge, UK
13Department of Nutrition and Dietetics, School of Health Science and Education, Harokopio University, Athens, Greece 14
Centre for Bone and Arthritis Research, Department of Internal Medicine and Clinical Nutrition, Institute of Medicine, University of Gothenburg, Gothenburg, Sweden
15
Geriatric Medicine, Institute of Medicine, University of Gothenburg, Gothenburg, Sweden
16
Geriatric Medicine Clinic, Sahlgrenska University Hospital, Mölndal, Sweden
17Bristol Bioresource Laboratories, Population Health Sciences, Bristol Medical School, University of Bristol, Bristol, UK 18
Human Evolutionary Biology, Harvard University, Boston, MA, USA
19Broad Institute of MIT and Harvard, Boston, MA, USA 20
Department of Human Genetics, McGill University, Quebec, Canada
21Center for Pediatric Genomic Medicine, Children’s Mercy, Kansas City, MO, USA 22
Musculoskeletal Research Unit, University of Bristol, Bristol, UK
ABSTRACT
In bone, sclerostin is mainly osteocyte‐derived and plays an important local role in adaptive responses to mechanical loading. Whether circulating levels of sclerostin also play a functional role is currently unclear, which we aimed to examine by two‐sample Mendelian randomization (MR). A genetic instrument for circulating sclerostin, derived from a genomewide association study (GWAS) meta‐analysis of serum sclerostin in 10,584 European‐descent individuals, was examined in relation to femoral neck bone mineral density (BMD;n=32,744) in GEFOS and estimated bone mineral density (eBMD) by heel ultrasound (n=426,824) and fracture risk (n=426,795) in UK Biobank.
This is an open access article under the terms of the Creative Commons Attribution License, which permits use, distribution and reproduction in any medium, provided the original work is properly cited.
Received in original form December 6, 2018; revised form May 14, 2019; accepted May 23, 2019. Accepted manuscript online June 6, 2019.
Address correspondence to: Jie Zheng, PhD, MRC Integrative Epidemiology Unit (IEU), Bristol Medical School, University of Bristol, Oakfield House, Oakfield Grove, Bristol, BS8 2BN, UK. E‐mail: epxjz@bristol.ac.uk; Jonathan H Tobias, MD, PhD, Musculoskeletal Research Unit, University of Bristol, Level 1 Learning and Research Building, Bristol, BS10 5NB, UK. E‐mail: jon.tobias@bristol.ac.uk
*GDS and JHT contributed equally to this work.
Additional Supporting Information may be found in the online version of this article. Journal of Bone and Mineral Research, Month 2019, pp 1–13
DOI: 10.1002/jbmr.3803
Our GWAS identified two novel serum sclerostin loci, B4GALNT3 (standard deviation [SD]) change in sclerostin per A allele (β=0.20,p=4.6×10−49) andGALNT1(β =0.11 per G allele,p=4.4×10⁻¹¹).B4GALNT3is an N‐acetyl‐galactosaminyltransferase,
adding a terminal LacdiNAc disaccharide to target glycocoproteins, found to be predominantly expressed in kidney, whereas GALNT1is an enzyme causing mucin‐type O‐linked glycosylation. Using these two single‐nucleotide polymorphisms (SNPs) as genetic instruments, MR revealed an inverse causal relationship between serum sclerostin and femoral neck BMD (β=–0.12, 95% confidence interval [CI]–0.20 to–0.05) and eBMD (β=–0.12, 95% CI–0.14 to–0.10), and a positive relationship with fracture risk (β=0.11, 95% CI 0.01 to 0.21). Colocalization analysis demonstrated common genetic signals within the B4GALNT3locus for higher sclerostin, lower eBMD, and greaterB4GALNT3expression in arterial tissue (probability >99%). Ourfindings suggest that higher sclerostin levels are causally related to lower BMD and greater fracture risk. Hence, strategies for reducing circulating sclerostin, for example by targeting glycosylation enzymes as suggested by our GWAS results, may prove valuable in treating osteoporosis. © 2019 The Authors.Journal of Bone and Mineral Researchpublished by Wiley Periodicals, Inc.
KEY WORDS:SCLEROSTIN; MENDELIAN RANDOMIZATION; BONE MINERAL DENSITY; GENOME‐WIDE ASSOCIATION STUDY
Introduction
S
clerostin is a glycoprotein produced by osteocytes, which is thought to play an important role in bone’s adaptive response to mechanical loading, acting within the local bone microenvironment to suppress bone formation.(1) The scler-ostin antibody romosozumab has recently been found to increase bone mineral density (BMD) and reduce fracture risk,(2,3)establishing sclerostin as an important drug target for osteoporosis. However, concerns of possible off‐target effects were raised by thefinding of an increased risk of cardiovascular events reported in a recent phase 3 trial of patients randomized to romosozumab or alendronate.(3)Sclerostin is also detectable in the systemic circulation, the functional role of which remains unclear. Serum sclerostin exchanges with the bone microenvir-onment and may simply mirror the prevalent conditions within bone. Consistent with this suggestion, serum sclerostin has been found to respond to physiological stimuli such as estrogen in parallel to alterations in local bone expression.(4)Several studies suggest that serum sclerostin exerts other roles outside the skeleton. For example, serum sclerostin has been reported to increase in chronic kidney disease (CKD) and may contribute to the pathogenesis of chronic kidney disease–mineral and bone disorder (CKD‐MBD).(5)Serum sclerostin levels are also higher in patients with cardiovascular disease and may predict cardiovascular mortality.(6)A relationship with glucose metabolism has been suggested in light by reports of higher sclerostin levels in association with type 1 and type 2 diabetes mellitus in adolescents(7)and adults,(8)respectively. Although these changes may represent“off‐target”effects of sclerostin originating from bone, alternatively, sclerostin might act as an endocrine hormone, subject to regulation by as yet unidentified additional factors. Adding to this complexity, several extraskeletal tissues have been found to express sclerostin, including the liver, chondrocytes, kidney, and vascular smooth muscle cells.(9) Aside from extra-skeletal target tissues, perturbations in serum sclerostin could conceivably affect the bone itself through consequent alterations of sclerostin levels within the local bone environment.
To the extent that circulating sclerostin levels influence bone metabolism, this may offer additional strategies for targeting sclerostin and provide a distinct toxicity profile compared with systemic sclerostin antibody administration producing complete abrogation of sclerostin function throughout the organism. In the present study, we aimed to establish whether circulating sclerostin exerts a causal influence on bone metabolism, using a two‐sample Mendelian randomization (MR) framework.(10)With
this approach, genotypic markers for the exposure of interest are
first identified from a genomewide association study (GWAS), to provide an instrumental variable. Subsequently, the output of a GWAS for the outcome, obtained in a separate population, is interrogated for association with the instrumental variable for the exposure. This enables causal inferences to be drawn between exposures and outcomes based on evaluation of their genetic determinants, despite these being measured in separate populations. The recently published two‐sample MR, demon-strating a null association between vitamin D and fracture risk, represents a successful application of this approach.(11) There-fore, we aimed to derive an instrumental variable for sclerostin from a sclerostin GWAS and to subsequently apply this to outputs from previously published large‐scale bone mineral density (BMD) and fracture GWASs.
Materials and Methods
Cohort detailsThe Avon Longitudinal Study of Parents and Children (ALSPAC) ALSPAC is a prospective birth cohort that recruited pregnant women with expected delivery dates between April 1991 and December 1992 from Bristol, UK. The initial number of pregnancies enrolled was 14,541 (for these at least one questionnaire has been returned or a“Children in Focus”clinic had been attended by July 19, 1999). Of these initial pregnancies, there was a total of 14,676 fetuses, resulting in 14,062 live births and 13,988 children who were alive at 1 year of age. Detailed information on health and development of children and their parents were collected from regular clinic visits and completion of questionnaires.(12,13)Ethical approval was obtained from the ALSPAC Law and Ethics Committee and the Local Ethics Committees. Please note that the study website contains details of all the data that is available through a fully searchable data dictionary (http://www.bristol.ac.uk/ alspac/researchers/our‐data/).
Die Deutsche Diabetes Dialyse Studie (4D)
The 4D study was a prospective randomized controlled trial including patients with type 2 diabetes mellitus who had been treated by hemodialysis for less than 2 years.(14)Between March
1998 and October 2002, 1255 patients were recruited in 178 dialysis centers in Germany. Patients were randomly assigned to double‐blinded treatment with either 20 mg of atorvastatin (n=619) or placebo (n=636) once daily and were followed up
until the date of death, censoring, or end of the study in March 2004. The primary endpoint of the 4D study was defined as a composite of death due to cardiac causes, stroke, and myocardial infarction, whichever occurred first. 4D study endpoints were centrally adjudicated by 3 members of the endpoints committee blinded to study treatment and ac-cording to predefined criteria. The study was approved by the medical ethics committees, and written informed consent was obtained from all participants.
The Gothenburg Osteoporosis and Obesity Determinants (GOOD) The GOOD study was initiated to determine both environ-mental and genetic factors involved in the regulation of bone and fat mass.(15)Male study subjects were randomly identified in the greater Gothenburg area in Sweden using national population registers, contacted by telephone, and invited to participate. To be enrolled in the GOOD study, subjects had to be between 18 and 20 years of age. There were no other exclusion criteria, and 49% of the study candidates agreed to participate (n=1068). The study was approved by the ethics committee at the University of Gothenburg. Written and oral informed consent was obtained from all study participants.
MANOLIS cohort
HELIC‐MANOLIS (Minoan isolates) collection comprises indivi-duals from the mountainous Mylopotamos villages, including Anogia, Zoniana, Livadia, and Gonies (estimated population size of 6000 in total) on the Greek island of Crete. It is one of the two cohorts composing the Hellenic Isolated Cohorts study (HELIC; http://www.helic.org). The specific population ge-netics(16) and dietary and lifestyle habits(17) of this cohort have been previously studied in the literature. The HELIC collections include blood for DNA extraction, laboratory‐based hematological and biochemical measurements, and interview‐ based questionnaire data. The study was approved by the Harokopio University Bioethics Committee, and informed consent was obtained from human subjects.
GWAS meta‐analysis of sclerostin
Sclerostin measures in the four cohorts were standardized to SD units. Each cohort ran a GWAS across all imputed or sequenced variants. Age and sex were included as covariates in all models, as were thefirst 10 principal components (PCs) to adjust for genetic stratification. Linear mixed models BOLT‐ LMM and GEMMA were applied to ALSPAC and MONOLIS cohort, respectively, to adjust for cryptic population structure and relatedness. The ALSPAC, 4D, and GOOD cohorts were imputed using Haplotype Reference Consortium (HRC) V1.0 reference panel (MANOLIS employed whole‐genome sequen-cing). We standardized the genomic coordinates to be reported on the NCBI build 37 (hg19) and alleles on the forward strand. Summary‐level quality control was conducted for Europeans only in EasyQC.(18) Meta‐analysis (using a fixed‐effects model implemented in EasyQC) was restricted to variants common to all four studies (n=5,245,208 variants), MAF >1%, and high imputation quality score (Rsq >0.8 for variants imputed in MaCH(19) and info >0.8 for variants imputed in IMPUTE.(20) A p value<5×10⁻⁸ in the meta‐analysis was used to define genomewide significant associations. Each locus is represented
in the corresponding results table by the variant with the strongest evidence for association. A random‐effects model meta‐analysis was also conducted using GWAMA version 2.2.2.(21)Heterogeneity was assessed using theI2 statistic and Cochrane’sQtest.
Conditional analysis and geneticfine mapping
To detect multiple independent association signals at each of the genomewide significant sclerostin loci, we carried out an approximate conditional and joint genomewide association analysis using the software package GCTA‐COJO.(22) Single‐ nucleotide polymorphisms (SNPs) with high collinearity (correlation r2> 0.9) were ignored, and those situated more than 10 Mb away were assumed to be in complete linkage equilibrium. A reference sample of 8890 unrelated individuals of ALSPAC mothers was used to model patterns of linkage disequilibrium (LD) between variants. The reference geno-typing data set consisted of the same 5 million variants assessed in our GWAS. Conditionally independent variants that reached GWAS significance were annotated to the physically closest gene with the Hg19 Gene range list available in dbSNP (https://www.ncbi.nlm.nih.gov/SNP/).
Estimation of SNP heritability using LD‐score regression
To estimate the amount of genomic inflation in the data due to residual population stratification, cryptic relatedness, and other latent sources of bias, we used LD score regression.(23) LD scores were calculated for all high‐quality SNPs (ie, INFO score >0.9 and MAF >0.1%) from the meta‐analysis. We further quantified the overall SNP‐based heritability’s with LD score regression using a subset of 1.2 million HapMap SNPs.
Estimation of genetic correlations using LD Hub
To estimate the genetic correlation between sclerostin and bone phenotypes related to osteoporosis, we used a recent method based on LD score regression as implemented in the online web utility LD Hub.(24) This method uses the cross‐ products of summary test statistics from two GWASs and regresses them against a measure of how much variation each SNP tags (its LD score). Variants with high LD scores are more likely to contain more true signals and thus provide a greater chance of overlap with genuine signals between GWASs. The LD score regression method uses summary statistics from the GWAS meta‐analysis of sclerostin and the bone phenotypes, calculates the cross‐product of test statistics at each SNP, and then regresses the cross‐product on the LD score.
Genetic colocalization analysis between sclerostin and bone phenotypes
We used a stringent Bayesian model (coloc) to estimate the posterior probability (PP) of each genomic locus containing a single variant affecting both serum sclerostin level and bone phenotypes.(25)A lack of evidence (ie, PP<80%) in this analysis
would suggest that one of the causal variants for protein is simply in LD with the putative causal variant for the trait (thus introducing genomic confounding into the association be-tween sclerostin level and bone phenotypes). We treated
colocalized findings (PP≥80%) as “colocalized,” and other findings that did not pass colocalization as“not colocalized.” Mendelian randomization
Sclerostin versus bone phenotypes
We undertook two‐sample MR(26) to evaluate evidence of a causal relationship between sclerostin measured in plasma and bone phenotypes. We looked up GWAS results in distinct cohorts to those used for the sclerostin GWAS, namely GEFOS in the case of femoral neck and lumbar spine bone mineral density (BMD; n=32,961)(27) and UK Biobank in the case of
estimated BMD (eBMD; n=426,824)(28) and (self‐reported) fracture risk (n=426,795).(29) In this initial analysis, sclerostin
was treated as the exposure and bone traits as the outcomes, using sclerostin‐associated SNPs as the instrumental variables. The multiple testing p value threshold was calculated as p=0.05 divided by the derived number of independent tests. We used the random‐effect inverse variance‐weighted (IVW)(30) and Wald ratio(31) methods to obtain MR effect estimates. Heterogeneity analysis of the instruments were conducted using CochranQtest. Results were plotted as forest plots using code derived from the ggplot2 package in R.(32)All MR analyses were conducted using the MR‐Base TwoSampleMR R package (github.com/MRCIEU/TwoSampleMR).(33) To identify potential pleiotropic pathways, we conducted a phenomewide associa-tion study (PheWAS) of the two top hits, rs215226 and rs7241221, using the MR‐Base PheWAS tool (http://phewas. mrbase.org/),(33) applying a Bonferroni p value threshold of 3×10⁻⁶, to account for multiple testing (number of
tests=22,027).
Bidirectional MR
To investigate the possibility that BMD causally affects levels of serum sclerostin, we used summary results data from 49 conditionally independent autosomal variants reported in a BMD GWAS using 32,744 GEFOS individuals.(27)We looked up these variants in summary‐results GWAS data on sclerostin from our meta‐analysis and found 39 instruments (including two proxy SNPs) for femoral neck BMD and 38 instruments (including two proxy SNPs) for lumbar spine BMD. When applying bidirectional MR, we assume that SNPs used to proxy BMD exert their primary association on BMD and that any correlation with sclerostin levels is a consequence of a causal effect of BMD on sclerostin. We therefore applied Steiger filtering(34) and included 33 femoral neck BMD SNPs and 35 lumbar spine BMD SNPs, which exert their primary effect on BMD. See Supplemental Materials and Methods for additional details.
Functional annotation
Predicted regulatory elements of the top association signals For each locus associated with sclerostin, we identified all SNPs with high LD from the top signal (LDr2> 0.8) and identify their DNA features and regulatory elements in noncoding regions of the human genome using Regulomedb v1.1 (http://www. regulomedb.org/).(35)
ATAC‐seq lookup in the top association regions
The Assay for Transposase Accessible Chromatin with high‐ throughput sequencing (ATAC‐seq) is a method for mapping chromatin accessibility genomewide.(36) We intersected the sclerostin‐associated SNPs (or proxy SNPs with LDr2> 0.8) with
ATAC‐seq data generated from the proximal and distal femur of an E15.5 mouse(36,37)lifted over to the orthologous positions in human genome build hg19.
Gene expression quantitative trait loci (eQTLs) lookups for sclerostin signals
We investigated whether the SNPs influencing serum sclerostin level were driven by cis‐acting effects on transcription by evaluating the overlap between the sclerostin‐associated SNPs and eQTLs within 500 kb of the gene identified, using data derived from all tissue types from the GTEx consortium v7.(38) Evidence of eQTL association was defined asp<1×10⁻⁴and evidence of overlap of signal was defined as high LD (r2≥0.8) between eQTL and sclerostin‐associated SNPs in the region. Where eQTLs overlapped with sclerostin‐associated SNPs, we used the colocalization analysis to estimate the PP of each genomic locus containing a single variant affecting both serum sclerostin level and gene expression level in different tissues. Equivalent analyses were performed in human primary osteoblast cells(39) and cells derived from iliac crest bone from 78 postmenopausal women(40)(see Supplemental Mate-rials and Methods for further details).
Methylation quantitative trait loci (mQTLs) lookups for sclerostin signals
We also investigated whether the SNPs influencing serum sclerostin level were mediated by cis‐acting effects on DNA methylation by evaluating the overlap between the sclerostin‐ associated SNPs and mQTLs within 500 kb of the gene identified, using data measured in blood cells. We queried data from mQTLdb, which contained mQTL information at five different time points: ALSPAC children at birth, childhood, and adoles-cence and ALSPAC mothers during pregnancy and at middle age. These data are from the ARIES resource.(41) Evidence of
mQTL association was defined asp<1×10⁻⁴and evidence of overlap of signal was defined as high LD (r2≥0.8) between mQTL and sclerostin‐associated SNPs in the region.
Results
Genomewide‐association study meta‐analysis of serum sclerostin
GWAS results were available in 10,584 participants across four cohorts (Table 1). Supplemental Figs. S1 and S2 show the Manhattan plot and QQ plot of association results from the fixed‐effect meta‐analysis of sclerostin in Europeans, respec-tively (see Supplemental Fig. S3 for the QQ plots for each study). There was little evidence of inflation of the association results as the genomic inflation factorλwas 1.051 and the LD score regression intercept 1.015.(23)Therefore, genomic control
correction was not applied to any of the meta‐analysis results. LD score regression revealed that all common variants we included in the meta‐analysis explained 16.3% of the pheno-typic variance of sclerostin (H2=0.163, SE=0.052,p=0.0017).
Two loci were identified as being associated with serum sclerostin at genomewide significance level. Sixty‐nine SNPs in theB4GLANT3gene region were associated with sclerostin level (Fig. 1A). The top hit rs215226 at this locus (β=0.205 SD
change in serum sclerostin per A allele, SE=0.014,
p=4.60×10−49, variance explained=1.99%) was previously reported to be associated with BMD estimated by heel ultrasound (eBMD).(28) The second locus was in the GALNT1 gene region (Fig. 1B) with the top hit rs7241221 (β=0.109 SD per G allele, SE=0.017,p=4.40×10⁻¹¹, variance explained= 0.39%). In addition, one SNP near the TNFRSF11B region encoding OPG, rs1485303, showed a suggestive association with sclerostin (β=0.074 SD per G allele, SE=0.014, p=7.70×10⁻⁸, variance explained=0.26%) (Fig. 1C). The latter SNP is in moderate LD with a previously reported BMD‐ associated SNP rs1353171 (r2=0.277 in the 1000 Genome
Europeans; distance between the two SNPs=103,258 base pairs).(42)The association signals of the GWAS meta‐analysis can
be found in Table 2 and Supplemental Table S1. Results of the random‐effects meta‐analysis were identical to those of the fixed‐effects meta‐analysis (results not shown). The degree of heterogeneity was low across studies for the GALNT1 signal (I2=0) andTNFRSF11Bsignal (I2=0.53) but relatively high for B4GALNT3signal (I2=0.78) (Supplemental Table S2). The latter appeared to reflect a relatively strong association in 4D, suggesting a possible interaction with the presence of CKD. Conditional analyses on the lead SNP in each association locus yielded no additional independent signals reaching genome-wide significance. The association of the two sclerostin SNPs with femoral neck, lumbar spine, and heel BMD are presented in Supplemental Table S3.
Only minor genetic influences on serum sclerostin were observed within theSOSTgene (chromosome 17, 41731099 to 41936156), which produces sclerostin. In total, fourSOSTSNPs have previously been reported in association with BMD(28,43) and one with fracture.(11)However, proxy SNPs for these SNPs showed little or no association with serum sclerostin (Supple-mental Table S4). We used the GWAS results to estimate the genetic correlation between sclerostin and 11 bone pheno-types using LD score regression via LD Hub.(24)We observed no strong evidence of genetic correlation between sclerostin SNPs and the bone phenotypes we tested (Supplemental Table S5). Mendelian randomization and colocalization analysis of sclerostin and bone phenotypes
Using two‐sample MR, we applied our GWAS results to larger data sets to examine putative causal relationship between sclerostin and bone phenotypes. The two SNPs robustly associated with sclerostin (rs215226 in B4GALNT3 region and rs7241221 inGALNT1region) were used as genetic instruments of the exposure. Dual‐energy X‐ray absorptiometry (DXA)‐ derived BMD and eBMD results from 32,961 GEFOS indivi-duals(27) and 426,824 UK Biobank individuals,(28) respectively, and self‐reported fracture of 426,795 individuals from UK Biobank were used as outcomes. Contrasting with the genetic correlation results, based on inverse variance‐weighted (IVW) analysis, we observed that a higher level of serum sclerostin was causally related to lower femoral neck BMD (β=–0.123 SD change in BMD per SD increase in sclerostin, 95% confidence interval [CI] –0.195 to –0.051, p=0.00074), lower eBMD (β=–0.122 SD change in BMD per SD increase in sclerostin, 95% CI–0.140 to–0.104,p=1.29×10−38) and higher fracture
Table 1. Study Information of the Cohorts Involved in the Sclerostin GWAS Meta ‐ analysis Cohort Sclerostin ( n ) Female sclerostin ( n ) GWAS ( n ) Age, years (SD) Ethnic or racial group Family structure Family structure adjustment Assay details ALSPAC 8772 6371 7292 Children 9.9 (0.3) European Mothers and children BOLT ‐ LMM Biomedica human sclerostin ELISA Mothers 48 (4.4) 4D 1041 468 1041 66.3 (8.36) European Unrelated No adjustment TECO MANOLIS 1316 729 1316 61 (19) European Isolated population GEMMA OLINK GOOD 935 0 935 18.9 (0.56) European Unrelated No adjustment TECO ALSPAC and GOOD represent general population cohorts; MANOLIS is an isolated population from Crete; and 4D is a cohort of patients receiving hemodial ysis for end ‐ stage renal failure.
Fig. 1. Regional association plots and ENCODE annotation of the loci that reached or marginally reached genomewide significance (p<5×10⁻⁸) in the meta‐analysis. Thexaxis indicates the physical position of each SNP on the chromosome specified, whereas theyaxis denotes the evidence of association shown as−log(pvalue). (A) TheB4GLANT3region; (B) theGALNT1region; and (C) theTNFRSF11Bregion.
Table 2. Meta‐analysis Results for Loci That Reached or Marginally Reached Genomewide Significance (p<5×10⁻⁸)
Locus SNP EA OA EAF Gene Beta SE pValue Q Q_P I2
CHR12:591300 rs215226 A G 0.597 B4GALNT3 0.205 0.014 4.60×10−49 13.43 0.0038 0.777
CHR18:33152792 rs7241221 G A 0.772 GALNT1 0.109 0.017 4.40×10⁻¹¹ 0.955 0.812 0
CHR8:119976256 rs1485303 G A 0.568 TNFRSF11B 0.074 0.014 7.70×10−08 6.416 0.093 0.532
Locus=chromosome and position of the single‐nucleotide polymorphism [SNP]; EA=effect allele; OA=other allele; EAF=effect allele frequency; gene=nearest gene to the sclerostin‐associated SNP; beta=SD change in serum sclerostin per effect allele; SE=standard error; heterogeneity test:
Q=Cochrane’sQstatistics;Q_P=Cochrane’sQ pvalue;I2
risk (β=1.117 odds ratio [OR] of fracture per SD increase in sclerostin, 95% CI 1.009 to 1.237, p=0.034) (Fig. 2). Point estimates for the association between sclerostin level and lumbar spine BMD were similar to those observed for femoral neck and eBMD; however, 95% CIs were wide and crossed zero. MR analyses based on single SNPs suggested that both SNPs contributed to the overall causal effects we observed (Supple-mental Table S6). Heterogeneity analysis of the instruments suggested that causal estimates were consistent across both SNPs (pvalues of CochranQtest > 0.05), with the exception of estimates for lumbar spine BMD and fracture risk, likely reflecting the lower power in these instances.(44) Genetic signals for sclerostin and eBMD colocalized at both the B4GALNT3 locus (PP=99.7%) and GALNT1 locus (PP=99.8%) (Supplemental Table S7), further strengthening the evidence
of the putative causal relationship between sclerostin and eBMD.
Because our genetic instrument for sclerostin was only based on two SNPs, we were unable to apply methods such as Egger regression to test the assumption that this instrument affects BMD via sclerostin as opposed to a separate causal pathway (ie, horizontal pleiotropy). Therefore, to evaluate the possible role of pleiotropy, we performed a phenomewide association study of sclerostin‐associated signals. Rs215226 and rs1485303 were associated with other heel ultrasound parameters closely related to eBMD; rs215226 was also associated with height and body mass, based on Bonferroni p value threshold of 3×10⁻⁶ (Supplemental Tables S8 and S9). The strength of the association between rs215226 and height, which approached that for eBMD, raised the possibility of pleiotropy. However, in subsequent Fig. 2. Forest plot of putative causal relationship between serum sclerostin and bone phenotypes using Mendelian randomization. Thexaxis represents the causal estimates and 95% confidence intervals of SD change in BMD/eBMD and OR for fracture, per SD increase in sclerostin, as calculated by inverse variance‐weighted method. Theyaxis lists the four bone phenotypes used in the MR analysis.
analyses, the relation between observed height and eBMD in UK Biobank was found to be very weak, as reflected by Pearson correlation (r)<0.1 (Supplemental Table S10). Moreover, associa-tions between the three top hits and sclerostin were unchanged after additional adjustment for height, as assessed in ALSPAC (Supplemental Table S11). Taken together, these findings suggest that a separate pathway via height is unlikely to contribute to the relationship we observed between our genetic instrument for sclerostin and BMD.
We also undertook bidirectional MR(45) to evaluate the possibility of reverse causality between femoral neck BMD (or lumbar spine BMD) and serum sclerostin level, based on SNPs identified in GEFOS.(27) We modeled femoral neck BMD and lumbar spine BMD as our exposure and serum sclerostin level as our outcome. Having used Steigerfiltering to identify SNPs predominantly related to BMD as opposed to sclerostin,(34)33
of the 39 femoral neck BMD SNPs and 35 of the 38 lumbar spine BMD SNPs were found to exert their primary effect on BMD (Supplemental Table S12). IVW results using 33 femoral neck BMD SNPs suggested a positive relationship between femoral neck BMD and sclerostin (β=0.167 SD change in sclerostin per SD change in BMD, 95% CI 0.050 to 0.285, p=0.005), whereas IVW results using 35 lumbar spine BMD SNPs suggested a positive relationship between lumbar spine BMD and sclerostin (β=0.195 SD change in sclerostin per SD change in BMD, 95% CI 0.080 to 0.310,p=0.0009).
Sensitivity analyses were performed to evaluate horizontal pleiotropy. MR Egger and weighted median methods showed similar causal effects (Supplemental Table S13 and Supplemental Fig. S4A–D). There was no strong evidence of horizontal pleiotropy for femoral neck BMD (Egger regression intercept=–0.0086, p=0.369) or lumbar spine BMD (Egger regression intercept=
–0.0104, p=0.370). The heterogeneity test suggested some heterogeneity across instruments for femoral neck (Cochrane Q=36.284, p=0.0285) and lumbar spine BMD (Cochrane Q=54.721, p=0.0136). To address the heterogeneity across instruments, we further detected three outlier SNPs for femoral neck BMD and lumbar spine BMD separately using Cochrane test implemented in RadialMR R package.(46,47)The radial plot can be found in Supplemental Fig. S5. As a sensitivity analysis, we removed the outlier SNPs, and IVW results using the remaining 30 femoral neck BMD and 32 lumbar spine BMD SNPs still suggested a positive relationship between femoral neck BMD and sclerostin (β=0.149, 95% CI 0.045 to 0.253,p=0.005) as well as lumbar spine BMD and sclerostin (β=0.229, 95% CI 0.126 to 0.332, p=1.4×10⁻⁵) (Supplemental Table S13).
Functional follow‐up
Predicted regulatory elements of the top association signals We used Regulomedb to identify SNPs in high LD with the top association signals (r2> 0.8), which are likely to be located within DNA regulatory elements.(35)Among the 24 tested SNPs, we found three proxy SNPs showing high Regulomedb score (Supplemental Table S14): rs1872426 (r2=0.87 with the leading SNP rs1485303 in the TNFRSF11B region) had a score of 1 f (likely to comprise a DNA regulatory element and linked to expression of a gene target), and rs215224 and rs4980826 (r2=1 and 0.85 with the leading SNP rs215226, respectively, in theB4GALNT3 region) had a score of 2b (likely to comprise a DNA regulatory element) (see Supplemental Fig. S6 for rs215224). We also examined whether variants we identified
are located at sites of accessible chromatin, indicative of DNA transcriptional activator binding, by interrogating ATAC‐seq
data(36,37)generated from the proximal and distal femur.(48)In
theTNFRSF11Blocus, one SNP, rs2073618, overlapped with an ATAC‐seq peak, whereas in the B4GALNT3 locus, four SNPs (rs12318530, rs215223, rs215224, and rs215225) fell in the same ATAC‐Seq and Chip‐Seq peak (Supplemental Fig. S7 and Supplemental Table S15).
Expression QTLs lookups for sclerostin signals
To evaluate if the sclerostin association signals influence transcription of neighboring genes, we cross‐referenced the sclerostin SNPs withcis‐expression data in tissues measured in the GTEx consortium v7,(38) primary osteoblast cell lines,(39)and iliac crest bone biopsies.(40)The top association
signal within the B4GALNT3 region, rs215226, showed a
strong positive association with B4GALNT3gene expression in arterial and ovarian tissue (Supplemental Table S16). In contrast, a weaker inverse association with B4GALNT3 expression was observed in nervous tissue. Colocalization analysis yielded strong evidence that sclerostin levels share the same causal variant at this locus with arterial and ovarian B4GLANT3expression (probability >99%), whereas there was no evidence of colocalization in the case of nervous tissue (Supplemental Table S17). The association signal in the GALNT1 region was positively associated with GALNT1 expression in adipose tissue and that of the neighboring gene, INO80C, in adipose and heart tissue. In contrast, sclerostin association signals in B4GALNT3, TNFRSF11B, and GALNT1 were not associated with cis‐regulation of mRNA expression in osteoblast cells (Supplemental Table S18) or iliac crest bone biopsies (Supplemental Table S19). Intrans‐ eQTL analyses, theGALNT1signal was related to lowerSOST mRNA levels in iliac crest bone biopsies, particularly in
Affymetrix chip analyses, whereas no association was
observed for B4GALNT3 or TNFRSF11B (Supplemental
Table S20).
Methylation QTLs lookups for sclerostin signals
To evaluate if our top association signals have the potential to influence DNA methylation, we cross‐referenced the sclerostin SNPs with methylation data as measured at adjacent CpG sites in blood cells obtained atfive different time points (ALSPAC children at birth, childhood, and adolescence; ALSPAC mothers during pregnancy and at middle age).(41)We found that our top hit rs215226, within B4GALNT3, was consistently associated with extent of methylation at cg20907806 and cg26388816 across four time points (Supplemental Table S21). These two CpG sites are located in a CpG island that overlapped with one of the four ATAC‐seq peaks within the B4GALNT3 region (Supplemental Fig. S7, upper plot). The other potential
signal near TNFRSF11B, rs1485303, was associated with
methylation level at cg13268132 and cg17171407 at all five time points.
B4galnt3 mRNA expression pattern (Supplemental Materials and Methods)
In murine gene expression studies,B4galnt3mRNA was expressed at highest levels in kidney, with relatively high levels of expression
also observed in bone, particularly cortical bone (Fig. 3A).B4galnt3 mRNA was subsequently found to be expressed at relatively high levels in osteoblast cultures derived from neonatal mouse calvariae. The expression in osteoblast cultures was similar after 2 and 4 days of culture in osteogenic media (Fig. 3B). After 7 days culture, there was a suggestive increase inB4galnt3expression. No expression was detected in in vitro cultured mouse bone marrow macrophages or osteoclasts (Fig. 3B).
Discussion
In this two‐sample MR study, wefirst performed a GWAS meta‐ analysis of serum sclerostin, identifying two genomewide significant loci (B4GALNT3 and GALNT1) and a further locus close to genomewide significance (TNFRSF11B). Together, common genetic variants explained 16% of the variance of
serum sclerostin. By using rs215226 in B4GALNT3 and
rs7241221 in GALNT1 as instrumental variables, we
subse-quently examined causal relationships between serum
sclerostin and BMD,finding evidence of an inverse relationship between sclerostin and BMD and a positive relationship with fracture risk. Randomized control trial findings demonstrate that systemic administration of the sclerostin inhibitor romo-sozumab increases BMD and reduces fracture risk.(2,3) Our presentfindings suggest that a similar benefit may be obtained by strategies aiming to reduce levels of circulating sclerostin. However, whereas complete abrogation of sclerostin function throughout the organism after romosozumab administration appears to cause off‐target effects such as cardiovascular toxicity, pharmacological reduction of circulating sclerostin levels could conceivably have a distinct safety profile.
As well as providing evidence for a causal effect of circulating sclerostin on BMD and fracture risk, our GWASfindings raise the
D2 D4 D7 M M/RL 0 100 200 300 % of D2 ± SEM N.D. N.D. Kidney Cortical boneVertebral body
Cortex Muscle Hypothalamus
Liver Aorta Uterus Spleen Brown fat Heart Lung Retroperitoneal fat Gonadal fat ThymusPancreas 0 100 200 300 400
% of cortical bone ± SEM
N.D.
B4galnt3 mRNA expression
Osteoblasts Osteoclasts A
B
Fig. 3. B4galnt3expression in mice and in in vitro cultured osteoblasts and osteoclasts. (A)B4galnt3mRNA tissue expression in adult female mice, presented as percentage of cortical bone±SEM (n=6). (B)B4galnt3mRNA expression in mouse calvarial osteoblasts cultured in osteogenic media for 2, 4, and 7 days (D). Mouse bone marrow macrophages cultured with macrophage colony‐stimulating factor (M) or M‐CSF+RANKL (M/RL) to induce osteoclast differentiation. Percentage of expression D2±SEM. N.D.=not detectable.
intriguing possibility that circulating sclerostin levels are influenced by the activity of glycosylation enzymes, suggesting a means by which these levels might be targeted pharmaco-logically. B4GALNT3 is an N‐acetyl‐galactosaminyltransferase enzyme that adds a terminal LacdiNAc disaccharide to target glycocoproteins, whereas GALNT1 is an enzyme‐causing mucin‐type O‐linked glycosylation. Association signals with sclerostin at these two loci colocalized with those for eBMD, consistent with the possibility that genetic variation in B4GALNT3 and GALNT1 alters BMD via changes in serum sclerostin.
B4GALNT3 has previously been reported to be expressed in multiple human tissues, including arterial, gastrointestinal tract, and testis.(49)In the present study, in mice,B4GALNT3mRNA was expressed at highest levels in kidney and cortical bone. This finding is consistent with high levels of B4GALNT3 mRNA expression in renal tissue from human fetal samples in the NIH
Roadmap Epigenomics Mapping Consortium (http://www.
roadmapepigenomics.org/data/). TheB4GALNT3locus we identi-fied showed strongcis‐regulatory activity in eQTL studies in arterial tissue, which was confirmed by the colocalization analysis. The effect allele associated with higher sclerostin levels was associated with considerably greaterB4GALNT3mRNA levels in arterial tissue, suggesting that B4GALNT3 acts to increase sclerostin levels.
Sclerostin is a glycoprotein, which, like B4GALNT3, is also expressed at a number of sites outside the skeleton, including arterial tissue.(50) Whereas sclerostin protein is detected in
multiple tissues, extraskeletal sclerostin mRNA is mainly expressed in the kidney, reflecting renal tubular expression (www.proteinatlas.org), suggesting this may be the predomi-nant extraskeletal source of circulating sclerostin. It’s tempting to speculate that sclerostin acts as a substrate forB4GALNT3, such that formation of a terminal LacdiNAc moiety protects sclerostin from degradation and clearance from the circulation (Fig. 4). This interpretation is analogous to the role ofGALNT3, a Golgi enzyme that acts to O‐glycosylate another osteocyte‐ derived protein, FGF23, protecting it from degradation.(51) Given ourfinding that B4GALNT3 is expressed at high levels in the kidney, a major source of extraskeletal sclerostin, the
kidney may represent the principal source of glycosylated sclerostin. To the extent that activity of renal sclerostin glycosylation influences BMD via changes in circulating sclerostin levels, rather than the latter simply reflecting
“spillover”from sclerostin within the bone microenvironment, a two‐way exchange may exist whereby perturbations in circulating sclerostin levels alter concentrations within bone. The GALNT1 locus, which was also associated with serum sclerostin, expresses an enzyme in humans that initiates O‐glycosylation(52) and may act similarly to alter sclerostin levels by reducing sclerostin clearance.
In addition, we found thatB4GALNT3is expressed at relatively high levels in bone, particularly cortical bone, where sclerostin is also preferentially expressed, reflecting its production by osteo-cytes. Specifically, B4GALNT3 mRNA expression was detected in osteoblast cultures derived from mouse calvariae but not in bone marrow macrophage cultures induced to form osteoclasts. Further studies are required to establish whether B4GALNT3 is expressed in osteocytes as well as osteoblasts. However, to the extent that B4GALNT3 and sclerostin expression overlap within bone, theore-tically, B4GALNT3‐dependent glycosylation might influence local sclerostin activity in a variety of ways, including altered production. Although genetic variation in B4GALNT3 might conceivably influence circulating sclerostin via a primary action in bone, against this suggestion, there was little evidence ofB4GALNT3 cis‐regulatory activity in osteoblasts and bone tissue. Furthermore, theB4GALNT3 SNP did not appear to act as a trans‐eQTL signal forSOSTin bone. However, eQTL studies in bone had considerably less power than those in other tissues analyzed (285 and 78 individuals for tibial artery and bone biopsy studies, respectively).
Although our analyses were primarily intended to identify loci associated with serum sclerostin, there is some evidence to suggest that rs215224 was responsible for the underlying genetic signal at the B4GALNT3 locus. This SNP is in perfect LD with our top B4GALNT3 hit, rs215226. Rs215224 shows strong evidence of alteration of transcriptional activity from RegulomeDB, supported by thefinding that this SNP falls within a site of open chromatin, as assessed by ATAC‐seq in E15.5 mouse femurs. That said, although rs215224 was also associated with differential methylation at two
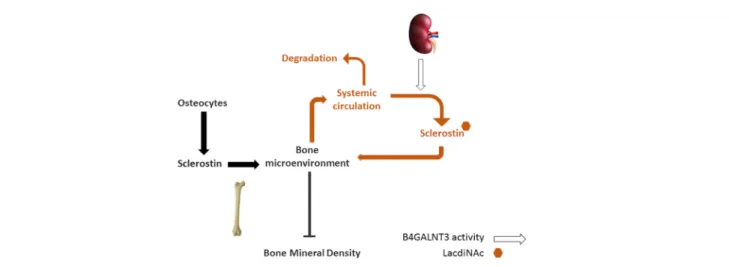
Fig. 4.Proposed exchange of sclerostin between skeletal and systemic compartments. Sclerostin, synthesized by osteocytes, is present within the bone microenvironment but also exchanges with the systemic circulation, where it is produced by several extraskeletal tissues, including the kidney. Whereas locally produced sclerostin is largely responsible for actions of sclerostin on bone, factors that influence circulating levels may also play a role, including variation in activity of B4GALNT3, which we propose protects sclerostin from degradation through generation of a terminal LacdiNAc.
distinct CPG sites withinB4GALNT3, one of which coincided with an ATAC‐seq site, these were at distinct locations within the gene.
Genetic variation within the SOST gene appeared to have relatively weak associations with serum sclerostin, includingSOST SNPs previously reported to be associated with BMD or hip fracture. This suggests that previously identifiedSOSTSNPs influence BMD and hip fracture by altering local sclerostin activity in bone, independently of circulating sclerostin levels. That said, further studies with a larger sample size are needed to establish the contribution of genetic variation within theSOSTlocus to serum sclerostin. In terms of other genetic influences on serum sclerostin, the association betweenTNFRSF11Band serum sclerostin was just below our threshold.TNFRSF11Bis a well‐established BMD locus,(42) and the protein product, OPG, plays a major role in regulating bone resorption.(53)However, against the suggestion that altered OPG production mediates this genetic association, eQTL studies in heart tissue revealed that rs1485303 (the most strongly associated SNP at this locus) is strongly associated with expression of the adjacent gene,COLEC10.
Whereas MR analyses usingB4GLANT3andGALNT1as genetic instruments supported a causal influence of higher sclerostin levels in reducing BMD, bidirectional MR analysis suggested that if anything, higher BMD leads to greater sclerostin levels. This apparent positive influence of BMD on sclerostin levels is in line with previous reports of elevated sclerostin levels in individuals with extreme elevations in BMD(54)and of positive associations between serum sclerostin levels and lumbar spine and femoral neck BMD in postmenopausal women.(40) One explanation for this latter relationship is that individuals with higher BMD have a relatively large amount of bone tissue, and therefore, produce more sclerostin as result of having greater numbers of osteocytes. Additionally, these causal relationships may repre-sent components of a regulatory feedback pathway, such that greater bone formation leading to increased BMD stimulates sclerostin production, which then feed backs to reduce bone formation and hence limit BMD gains.
Strengths and weaknesses
This study represents thefirst MR study of sclerostin, based on the only serum sclerostin GWAS reported to date. Of the loci identified, B4GALNT3had a relatively strong association for a common variant (ie, 0.2 SD change in serum sclerostin per allele). Although we performed a GWAS meta‐analysis to maximize statistical power, the association between the B4GALNT3 locus and sclerostin also reached genomewide significance in three of the four participating cohorts. That said, the total GWAS study sample of around 11,000 was relatively small, and further replication of ourfindings would be desirable. Only two loci passed evidence thresholds for application in our MR analysis, and so it was not possible to apply methods such as Egger regression for evaluating horizontal pleiotropy, to analyze the causal pathway between sclerostin and BMD. Nevertheless, colocalization analysis strongly suggested that both loci comprising the sclerostin instrument influence BMD via changes in circulating sclerostin, as opposed to a separate, BMD‐ specific pathway. Although the genetic association signal between B4GALNT3and sclerostin showed high heterogeneity, this appeared to reflect a relatively strong signal in the 4D cohort, comprising individuals with end‐stage kidney disease, and is unlikely to limit application as a genetic instrument in the general population. In terms of other limitations, different methods were used to measure sclerostin in the participating cohorts; as well as different ELISAs, the MANOLIS cohort used the OLINK proteomics platform.
Nonetheless, similar genetic associations were observed across all four cohorts, suggesting different sclerostin measurement methods are unlikely to have importantly impacted on our results.
Conclusions
Having appliedfindings from a GWAS meta‐analysis for serum sclerostin in a two‐sample MR framework, we established a causal relationship between higher circulating sclerostin levels, reduced BMD, and increased fracture risk. Hence, strategies for reducing circulating sclerostin may prove valuable in treating osteoporosis. Conceivably, these might include targeting of glycosylation enzymes, encoded by the two genomewide significant loci for sclerostin we identified.
Disclosures
ML has received lecture or consulting fees from Amgen, Lilly, Meda, UCB Pharma, Renapharma, Radius Health, and Consilient Health. All other authors state that they have no conflicts of interest.
Acknowledgments
We are extremely grateful to all the families who took part in the ALSPAC study, the midwives for their help in recruiting them, and the whole ALSPAC team, which includes inter-viewers, computer and laboratory technicians, clerical workers, research scientists, volunteers, managers, receptionists and nurses. ALSPAC data collection was supported by the Wellcome Trust (grants WT092830M; WT088806; WT102215/2/13/2), UK Medical Research Council (G1001357), and University of Bristol. The UK Medical Research Council and the Wellcome Trust (ref: 102215/2/13/2) and the University of Bristol provide core support for ALSPAC. GDS works in the Medical Research Council Integrative Epidemiology Unit at the University of Bristol MC_UU_00011/1. JZ is a Vice‐Chancellor’s research fellow at the University of Bristol. JZ, DB and BE are funded by MRC Integrative Epidemiology Unit (MC_UU_00011/4).
AG and EZ are supported by Wellcome (098051). CD and CW were supported by the Federal Ministry of Education and Research of the Federal Republic of Germany (BMBF 01EO1504). TDC was supported by NSF grant (BCS‐1518596). EG was supported by a CIHR Foundation grant (FDN‐148381). KMG and SR were supported by the South East Norway Health Authority under grant number 52009/8029; the 6th EU framework program under grant number LSHM‐CT‐2003‐502941; Oslo University Hospital, Ullevaal under grant number 52009/8029; and Lovisenberg Diaconal Hospital. CM‐G was supported by the Netherlands Organization for Health Research and Development (ZonMw VIDI 016.136.367).
For RNA‐seq analyses, we thank Joost Verlouw, Jeroen van Rooij, and Masa Zrimšek for their help in the creation, management, and quality control of the RNA‐seq of data cells derived from iliac crest bone and posterior implementation of the eQTL analysis pipeline.
References
1. Galea GL, Lanyon LE, Price JS. Sclerostin’s role in bone’s adaptive response to mechanical loading. Bone. 2017;96:38–44.
2. Cosman F, Crittenden DB, Adachi JD, et al. Romosozumab treatment in postmenopausal women with osteoporosis. N Engl J Med. 2016;375(16):1532–43.
3. Saag KG, Petersen J, Grauer A. Romosozumab versus alendronate and fracture risk in women with osteoporosis. N Engl J Med. 2018;378(2):195–6.
4. Drake MT, Khosla S. Hormonal and systemic regulation of sclerostin. Bone. 2017;96:8–17.
5. Behets GJ, Viaene L, Meijers B, et al. Circulating levels of sclerostin but not DKK1 associate with laboratory parameters of CKD‐MBD. PLoS One. 2017;12(5):e0176411.
6. Novo‐Rodríguez C, García‐Fontana B, Luna‐Del Castillo JDD, et al. Circulating levels of sclerostin are associated with cardiovascular mortality. PLoS One. 2018;13(6):e0199504.
7. Wędrychowicz A, Sztefko K, Starzyk JB. Sclerostin and its significance for children and adolescents with type 1 diabetes mellitus (T1D). Bone. 2019;120:387–92.
8. Napoli N, Strollo R, Defeudis G, et al. Serum sclerostin and bone turnover in latent autoimmune diabetes in adults. J Clin Endocrinol Metab. 2018;103(5):1921–8.
9. Weivoda MM, Youssef SJ, Oursler MJ. Sclerostin expression and functions beyond the osteocyte. Bone. 2017;96:45–50.
10. Davey Smith G, Ebrahim S.‘Mendelian randomization’: can genetic epidemiology contribute to understanding environmental deter-minants of disease? Int J Epidemiol. 2003;32(1):1–22.
11. Trajanoska K, Morris JA, Oei L, et al. Assessment of the genetic and clinical determinants of fracture risk: genome wide association and mendelian randomisation study. BMJ. 2018;362:k3225.
12. Boyd A, Golding J, Macleod J, et al. Cohort profile: the‘children of the 90s’—the index offspring of the Avon Longitudinal Study of Parents and Children. Int J Epidemiol. 2013;42(1):111–27. 13. Fraser A, Macdonald‐Wallis C, Tilling K, et al. Cohort Profile: the
Avon Longitudinal Study of Parents and Children: ALSPAC mothers cohort. Int J Epidemiol. 2013;42(1):97–110.
14. Wanner C, Krane V, März W, et al. Randomized controlled trial on the efficacy and safety of atorvastatin in patients with type 2 diabetes on hemodialysis (4D study): demographic and baseline characteristics. Kidney Blood Press Res. 2004;27(4):259–66. 15. Lorentzon M, Swanson C, Andersson N, Mellström D, Ohlsson C.
Free testosterone is a positive, whereas free estradiol is a negative, predictor of cortical bone size in young Swedish men: the GOOD study. J Bone Miner Res. 2005;20(8):1334–41.
16. Panoutsopoulou K, Hatzikotoulas K, Xifara DK, et al. Genetic characterization of Greek population isolates reveals strong genetic drift at missense and trait‐associated variants. Nat Commun. 2014;5:5345.
17. Farmaki A‐E, Rayner NW, Matchan A, et al. The mountainous Cretan dietary patterns and their relationship with cardiovascular risk factors: the Hellenic Isolated Cohorts MANOLIS study. Public Health Nutr. 2017;20(6):1063–74.
18. Winkler TW, Day FR, Croteau‐Chonka DC, et al. Quality control and conduct of genome‐wide association meta‐analyses. Nat Protoc. 2014;9(5):1192–212.
19. Li Y, Willer CJ, Ding J, Scheet P, Abecasis GR. MaCH: using sequence and genotype data to estimate haplotypes and unobserved genotypes. Genet Epidemiol. 2010;34(8):816–34.
20. Howie B, Fuchsberger C, Stephens M, Marchini J, Abecasis GR. Fast and accurate genotype imputation in genome‐wide association studies through pre‐phasing. Nat Genet. 2012;44(8):955–9. 21. Mägi R, Morris AP. GWAMA: software for genome‐wide association
meta‐analysis. BMC Bioinformatics. 2010;11:288.
22. Yang J, Ferreira T, Morris AP, et al. Conditional and joint multiple‐ SNP analysis of GWAS summary statistics identifies additional variants influencing complex traits. Nat Genet. 2012;44(4):369–75. S1–3.
23. Bulik‐Sullivan BK, Loh P‐R, Finucane HK, et al. LD Score regression distinguishes confounding from polygenicity in genome‐wide association studies. Nat Genet. 2015;47(3):291–5.
24. Zheng J, Erzurumluoglu AM, Elsworth BL, et al. LD Hub: a centralized database and web interface to perform LD score regression that maximizes the potential of summary level GWAS data for SNP heritability and genetic correlation analysis. Bioinfor-matics. 2017;33(2):272–9.
25. Giambartolomei C, Vukcevic D, Schadt EE, et al. Bayesian test for colocalisation between pairs of genetic association studies using summary statistics. PLoS Genet. 2014;10(5):e1004383.
26. Burgess S, Scott RA, Timpson NJ, Davey Smith G, Thompson SG. EPIC‐InterAct Consortium. Using published data in Mendelian randomization: a blueprint for efficient identification of causal risk factors. Eur J Epidemiol. 2015;30(7):543–52.
27. Estrada K, Styrkarsdottir U, Evangelou E, et al. Genome‐wide meta‐ analysis identifies 56 bone mineral density loci and reveals 14 loci associated with risk of fracture. Nat Genet. 2012;44(5):491–501. 28. Kemp JP, Morris JA, Medina‐Gomez C, et al. Identification of 153 new
loci associated with heel bone mineral density and functional involvement of GPC6 in osteoporosis. Nat Genet. 2017;49(10):1468–75. 29. Morris JA, Kemp JP, Youlten SE, et al. An atlas of human and murine genetic influences on osteoporosis. Nat Genet. 2019;51(2):258–66. 30. Burgess S, Butterworth A, Thompson SG. Mendelian randomization analysis with multiple genetic variants using summarized data. Genet Epidemiol. 2013;37(7):658–65.
31. Lawlor DA, Harbord RM, Sterne JAC, Timpson N, Davey Smith G. Mendelian randomization: using genes as instruments for making causal inferences in epidemiology. Stat Med. 2008;27(8):1133–63. 32. Wickham H. ggplot2: elegant graphics for data analysis [Internet].
Springer; 2016. 260 p. Available from: https://market.android.com/ details?id=book-XgFkDAAAQBAJ
33. Hemani G, Zheng J, Elsworth B, et al. The MR‐Base platform supports systematic causal inference across the human phenome. Elife. 2018;7. pii: e34408.
34. Hemani G, Tilling K, Davey Smith G. Orienting the causal relationship between imprecisely measured traits using GWAS summary data. PLoS Genet. 2017;13(11):e1007081.
35. Boyle AP, Hong EL, Hariharan M, et al. Annotation of functional variation in personal genomes using RegulomeDB. Genome Res. 2012;22(9):1790–7.
36. Ou J, Liu H, Yu J, et al. ATACseqQC: a bioconductor package for post‐alignment quality assessment of ATAC‐seq data. BMC Genomics. 2018;19(1):169.
37. Buenrostro JD, Giresi PG, Zaba LC, Chang HY, Greenleaf WJ. Transposition of native chromatin for fast and sensitive epigenomic profiling of open chromatin, DNA‐binding proteins and nucleo-some position. Nat Methods. 2013;10(12):1213–8.
38. GTEx Consortium, Laboratory, Data Analysis & Coordinating Center (LDACC)—Analysis Working Group, Statistical Methods groups— Analysis Working Group, et al. Genetic effects on gene expression across human tissues. Nature. 2017;550(7675):204–13.
39. Grundberg E, Kwan T, Ge B, et al. Population genomics in a disease targeted primary cell model. Genome Res. 2009;19(11):1942–52. 40. Reppe S, Noer A, Grimholt RM, et al. Methylation of bone SOST, its
mRNA, and serum sclerostin levels correlate strongly with fracture risk in postmenopausal women. J Bone Miner Res. 2015;30(2):249–56. 41. Gaunt TR, Shihab HA, Hemani G, et al. Systematic identification of
genetic influences on methylation across the human life course. Genome Biol. 2016;17:61.
42. Rivadeneira F, Styrkársdottir U, Estrada K, et al. Twenty bone‐mineral‐ density loci identified by large‐scale meta‐analysis of genome‐wide association studies. Nat Genet. 2009;41(11):1199–206.
43. Zheng H‐F, Forgetta V, Hsu Y‐H, et al. Whole‐genome sequencing identifies EN1 as a determinant of bone density and fracture. Nature. 2015;526(7571):112–7.
44. Bowden J, Hemani G, Davey Smith G. Detecting individual and global horizontal pleiotropy in Mendelian randomization: a job for the humble heterogeneity statistic? Am J Epidemiol. 2018;187(12):2681–5. 45. Timpson NJ, Nordestgaard BG, Harbord RM, et al. C‐reactive protein
levels and body mass index: elucidating direction of causation through reciprocal Mendelian randomization. Int J Obes. 2011;35(2):300–8.
46. Bowden J, Del Greco MF, Minelli C, et al. Improving the accuracy of two‐sample summary data Mendelian randomization: moving beyond the NOME assumption. Int J Epidemiol. Epub. 2018 Dec 18. DOI: 10.1093/ije/dyy258
47. Bowden J, Spiller W, Del‐Greco F, et al. Improving the visualisation, interpretation and analysis of two‐sample summary data Mende-lian randomization via the radial plot and radial regression. Int J Epidemiol. 2018;47(4):1264–78.
48. Guo M, Liu Z, Willen J, et al. Epigenetic profiling of growth plate chondrocytes sheds insight into regulatory genetic variation influencing height. Elife. 2017;6. pii: e29329.
49. Sato T, Gotoh M, Kiyohara K, et al. Molecular cloning and characterization of a novel human β1, 4‐N‐ acetylgalactosaminyl-transferase, β4GalNAc‐T3, responsible for the synthesis of N,N′‐ diacetyllactosediamine. J Biol Chem. 2003;278(48):47534–44. 50. Didangelos A, Yin X, Mandal K, Baumert M, Jahangiri M, Mayr M.
Proteomics characterization of extracellular space components in the human aorta. Mol Cell Proteomics. 2010;9(9):2048–62.
51. Garringer HJ, Fisher C, Larsson TE, et al. The role of mutant UDP‐ N‐acetyl‐alpha‐D‐galactosamine‐polypeptide N‐acetylgalactosaminyl transferase 3 in regulating serum intactfibroblast growth factor 23 and matrix extracellular phosphoglycoprotein in heritable tumoral calcinosis. J Clin Endocrinol Metab. 2006;91(10):4037–42.
52. Bennett EP, Weghuis DO, Merkx G, vanKessel AG, Eiberg H, Clausen H. Genomic organization and chromosomal localiza-tion of three members of the UDP‐N‐acetylgalactosamine: polypeptide N‐acetylgalactosaminyltransferase family. Glyco-biology. 1998;8(6):547–55.
53. Suda T, Takahashi N, Udagawa N, Jimi E, Gillespie MT, Martin TJ. Modulation of osteoclast differentiation and function by the new members of the tumor necrosis factor receptor and ligand families. Endocr Rev. 1999;20(3):345–57.
54. Gregson CL, Poole KES, McCloskey EV, et al. Elevated circulating Sclerostin concentrations in individuals with high bone mass, with and without LRP5 mutations. J Clin Endocrinol Metab. 2014;99(8):2897–907.