Phylogenetic Models of Rate Heterogeneity: A High Performance
Computing Perspective
Alexandros Stamatakis
Institute of Computer Science, Foundation for Research and Technology-Hellas
P.O. Box 1385, Heraklion, Crete, GR-71110 Greece
[email protected]
Abstract
Inference of phylogenetic trees using the maximum likelihood (ML) method is NP-hard. Furthermore, the computation of the likelihood function for huge trees of more than 1,000 organisms is computationally inten-sive due to a large amount of floating point operations and high memory consumption. Within this context, the present paper compares two competing mathemat-ical models that account for evolutionary rate hetero-geneity: theΓand CAT models. The intention of this paper is to show that—from a purely empirical point of view—CAT can be used instead of Γ. The main ad-vantage of CAT over Γconsists in significantly lower memory consumption and faster inference times. An experimental study using RAxML has been performed on 19 real-world datasets comprising 73 up to 1,663 DNA sequences. Results show that CAT is on average 5.5 times faster thanΓand—surprisingly enough—also yields trees with slightly superiorΓ likelihood values. The usage of the CAT model decreases the amount of average L2 and L3 cache misses by factor 8.55.
1. Introduction
Phylogenetic trees are used to represent the evo-lutionary history of a set ofn organisms (also called taxa). A multiple alignment of a small region of their DNA or protein sequences can be used as input for the computation of phylogenies. In a computational con-text phylogenetic trees are usually strictly bifurcating unrooted trees. The organisms of the alignment are lo-cated at the tips and the inner nodes represent extinct common ancestors. The branches of the tree repre-sent the time which was required for the mutation of
one species into another—new—one. The inference of phylogenies with computational methods has many im-portant applications in medical and biological research, such as e.g. drug discovery and conservation biology (see [1] for a summary). Due to the rapid growth of available sequence data and the constant improvement of multiple alignment methods it has now become fea-sible to compute large trees which comprise more than 1,000 organisms. The computation of the tree-of-life containing representatives of all living beings on earth is one of thegrand challengesin Bioinformatics.
The fundamental algorithmic problem computa-tional phylogeny faces consists in the immense amount of potential tree topologies. This number grows ex-ponentially with the number of sequences n, e.g. for
n= 50 organisms there already exist 2.84∗1076 alterna-tive topologies; a number almost as large as the number of atoms in the universe (≈ 1080). In fact, it has al-ready been demonstrated that finding the optimal tree under the maximum likelihood (ML) criterion is NP-hard [4]. However, despite the algorithmic complexity and the high computational cost of the ML function, significant progress has been achieved with the release of fast and accurate sequential and parallel programs such as e.g. PHYML [8], IQPNNI [16], MetaPIGA [13], TreeFinder [11], GAML [2], TREE-PUZZLE [22] and RAxML [23]. Typically, these programs allow for infer-ence of 1,000 taxon trees on a single CPU in reasonable times. Since the main focus of program development has rightfully been on search algorithms, technical is-sues such as memory efficiency and manual optimiza-tion of the source code have been neglected. Despite the distinct statistical approach, programs for Bayesian inference such as MrBayes [10] heavily rely on the fre-quent evaluation of the likelihood function and there-fore share the same technical problems.
Therefore, a paradigm shift towards technical im-plementation issues in ML program development is re-quired to enable inference of larger phylogenetic trees in the future. For example, a recent critical review of the RAxML source code from a technical perspec-tive lead to some simple technical optimizations which yield run time improvements of factor 1.66 on 1,000 taxa up to 67 on 25,000 taxa. For the 25,000 taxon case RAxML already required 2GB of main memory under the simple HKY85 [9] model of nucleotide substi-tutionwithoutrate heterogeneity. Thus, if the Γ model with quadruple memory requirements was to be used on this large alignment, such an analysis would not be feasible. Within the context of continuous data accu-mulation, increasing memory shortageandthe growing discrepancy between CPU and memory access speeds the present paper intends to analyze whether the Γ model of rate heterogeneity can be replaced by the sig-nificantly faster and less memory-intensive CAT model from a purely empirical perspective. The basic ob-jective is to determine if comparable trees—with re-spect to their Γ likelihood score and topological similarity—can be obtained by using CAT on typical real world biological data.It can not be emphasized enough, that all final tree topologies in this pa-per, whether inferred under Γ or CAT, are com-pared on the basis of their Γ likelihood values to ensure a fair comparison using the objective function and to account for the preferred model in the phylogenetics community which currently is the Γ model. The basic question asked in this paper is if a significantly faster search under the CAT model can yield final tree topologies with similar Γ like-lihood values as a search under Γ. This is then placed into a high performance computing perspective, since CAT appears to be the only technically feasible solu-tion (duo to reduced memory requirements) to incor-porate rate heterogeneity into analyses of huge trees.
The remainder of this paper is organized as follows: In Section 2 the computationally relevant mathemati-cal background of the Γ and CAT models for ML-based tree inference is outlined. In addition, the relatively few existing alternative implementations (except that of RAxML) of the CAT model are mentioned. Sec-tion 3 describes the algorithm which is used in RAxML to optimize and categorize the per-site individual rates. Furthermore, a dedicated algorithm for the refinement under Γ (RΓ algorithm) is briefly described which al-lows for additional refinement of final trees obtained with the CAT model under the Γ model. The results of the large experimental study on 19 real-world align-ments and a performance comparison with the popu-lar IQPNNI and PHYML programs is provided in
Sec-tion 4. Moreover, the memory efficiency of the com-peting models is analyzed in terms of L2 and L3 cache misses. Section 5 provides a conclusion and addresses issues of current and future work.
2. Models of Rate Heterogeneity
As already mentioned there exist two basic methods to account for rate heterogeneity among sites (align-ment columns): individual per-site evolutionary rates and the Γ model [26] of rate heterogeneity. The main reason that the model of per-site evolutionary sites is not often used, is based mainly on statistical concerns that optimizing the evolutionary rate for each individ-ual site might lead to over-parameterizing and thus fitting the data [26]. However, the effect of over-estimation can be alleviated by using a fixed number
c m of rate categories (CAT model), where m is the number of distinct patterns (columns) in the align-ment. In this case every individually optimized evolu-tionary rateriwherei= 1, ..., mhas to be mapped to one of the rate categoriesρj wherej= 0, ..., c−1. In addition, the individual values of theρj have initially to be determined by taking into account the distribu-tion ofrivalues. This categorization—hence the name CAT—of c rate categories also has a computational advantage over usingm individual rates: A relatively large number of exponentials has to be computedper individual rate in order to obtain the respective tran-sition probability matrix. The number of invocations of the compute-intensiveexp()function is reduced to a constantcwhich typically ranges between 25–100 in comparison to the full alignment lengthmwhich typi-cally ranges from 500–2,000 (see Table 1). To the best of the author’s knowledge, models of per-site evolution-ary rates are currently only implemented in RAxML, IQPNNI, PHYLIP [7], and fastDNAml [17].
However, in IQPNNI the per-site rates are not cate-gorized and only the likelihood of the intermediate and final trees is evaluated using this model. This means that the actual tree search is conducted using the plain model without rate heterogeneity (B.Q. Minh, personal communication). Therefore, IQPNNI has only been ex-ecuted using the Γ model of rate heterogeneity for the performance comparison in Table 2. It is worth noting though, that individual rates ri in IQPNNI are opti-mized using a different approach [15] than in RAxML. The approach implemented in fastDNAml and PHYLIP is very similar to the CAT model in RAxML. The main difference is that in fastDNAml the num-ber of individual rate categories is fixed to a maximum of 36. and that a separate program (DNArates [18]) is required to compute and categorize the
evolution-ary rates based on afixed tree. Thus, in contrast to RAxML, fastDNAml does not offer the possibility to re-adapt the parameters of the CAT model to a chang-ing topology durchang-ing the inference process. Unfortu-nately, the process of rate optimization and categoriza-tion in DNArates has never been published.
The need to account for rate heterogeneity in ML-based analyses is broadly accepted in the community. Moreover, Biologists often have to incorporate the Γ model into their studies in order obtain publishable results because there also exists strong biological ev-idence for rate variation among sites. It has been demonstrated [26], that ML inference under the as-sumption of rate homogeneity can lead to erroneous results if rates vary among sites. The intention of this paper is not to argue against Γ in a statistical sense but to empirically determine if CAT can be used as a vehicle to circumvent the complexity of Γ.
CAT versus Γ: The HPC Perspective: The goal of this paragraph is to provide a notion of the amount of memory space and arithmetic operations required to compute the ML score for a tree topology under CAT and Γ. The seminal paper by Felsenstein [6] and the chapter by Swoffordet al.[24] provide detailed de-scriptions of the mathematical background. Within the HPC context the focus is on the memory space and amount of floating point operations required by CAT and Γ. In most ML implementations the execution time is largely dominated by two basic operations: the computation of the likelihood vectors (also called par-tial likelihoods arrays) and the optimization of branch lengths. Those operations typically require≥ 90% of execution time (e.g. for a dataset with 150 sequences: 92.72% of total execution time in PHYML and 92.89% in RAxML-VI). Thus, an acceleration of these func-tions on a technical level is crucial. The number n (n: number of taxa) and the length of the likelihood vectorsm(m: number of distinct patterns/columns in the alignment), dominate the memory consumption of typical ML implementations. Thus, the overall mem-ory consumption is ofO(n∗m).
After a change of the tree topology the likelihood of the tree is computed by filling in the likelihood vec-tors affected by the change bottom-up. To understand how the individual likelihood vectors are updated with given branch lengthsbq,brconsider a subtree rooted at nodepwith immediate descendantsrandqand like-lihood vectorsp[],q[], andr[] respectively. When the likelihood vectorsq[]andr[]have been computed the entries ofp[]can be calculated—in an extremely simplified manner—as outlined by the pseudo-code be-low:
for(i = 0; i < m; i++)
p[i]=f(g(q[i],bq),g(r[i], br));
wheref() is a simple function, i.e. requires just a few FLOPs, to combine the values ofg(q[i], bq)and g(r[i], br). Theg()function however is more com-putationally intensive since it contains the evaluation of the transition probabilities. The parametersbqand br represent the branch lengths. The above pseudo-code represents the main computational load of a typ-ical ML implementation. Note that, the optimization of branch lengths is very similar with respect to the loop structure and therefore omitted at this point. Accommodating CAT: Given the optimized rates per site and given the rate categorization (see Sec-tion 3) one can easily modify the basic for-loop to accommodate the CAT model. At each iteration of the loop the evolutionary rater of the current posi-tion i has to be determined. This is performed by looking up the respective rate category of positioniin category[]. Note that, 0 ≤ cat < c wherec is the maximum number of rate categories specified by the user (default in RAxML-VI is 50 rate categories). The rate[]vector is pre-computed before the main for -loop mainly in order to avoid redundant invocations of theexp()function. In order to account for distinct per-site rates theg()function now also depends on the rate category of the site. The pseudocode for updating the likelihood vectors with rate categories is indicated below:
for(i = 0; i < m; i++) {
cat = category[i]; r = rate[cat];
p[i] = f(g(q[i],bq,r), g(r[i],br,r)); }
As the above pseudo-code clearly shows, the ad-ditional computational effort required by the CAT model consists in the pre-computation of the rate[] vector (which is not shown here) and accessing the category[]andrate[]arrays in the mainfor-loop. The additional memory required is an array ofcdouble values forrate[]and an array ofminteger values for category[].
Accommodating Γ: The computationally more complex form of dealing with heterogeneous rates, due to the fact that significantly more memoryandfloating point operations are required (typically factor 4), con-sists in using either discrete or continuous stochastic models for the rate distributionat each site. In this case every site has a certain probability of evolving at
any rate contained in a given probability distribution. For example a concrete distribution of the likelihood for one site is obtained by summing over all products of likelihoods for the discrete rates times the probabil-ity from the distribution. In the continuous case like-lihoods must be integrated over the entire probability distribution.
The most common and most broadly used distribu-tion types are the continuous [25] and discrete [26] Γ distribution. The actual form of the Γ function is de-termined by theαshape parameter which is optimized based on the likelihood. Smallαvalues (α= 0.1) stand for high rate heterogeneity and large values (α= 5.0) for low rate heterogeneity. For computational reasons, in most ML programs the default is to use a Γ dis-tribution with 4 discrete rates. This represents an acceptable trade–off between inference time, memory consumption and accuracy. The implementation of the Γ model in RAxML also uses 4 discrete rates which in addition have been hard-coded in the mainfor-loops and manually optimized to ensure a fair comparison with the highly optimized implementation of the CAT model.
Given thefour individual rates from the discrete Γ distributionr0,...,r3now fourindividual likelihood entriesp[i].g0,...,p[i].g3at each siteihave to be updated as indicated below:
for(i = 0; i < m; i++) {
p[i].g0 = f(g(q[i], bq, r0), g(r[i], br, r0)); p[i].g1 = f(g(q[i], bq, r1), g(r[i], br, r1)); p[i].g2 = f(g(q[i], bq, r2), g(r[i], br, r2)); p[i].g3 = f(g(q[i], bq, r3), g(r[i], br, r3)); }
The above pseudocode clearly shows why using Γ is almost prohibitive for computing huge trees: Per iter-ation of thefor-loop it requires almost the quadruple number of floating point operations. Since memory shortage currently represents one of the main obsta-cles for inference of larger phylogenies the quadruple memory space required by Γ is even more problematic. Therefore, with respect to the HPC perspective and inference of huge trees, the CAT model should, and in the 25,000 taxon case must, be preferred over the Γ model due to the significantly inferior inference times and memory consumption.
3. Algorithms
Rate Category Optimization & Classification: The per-site evolutionary rates of a tree in RAxML are obtained by maximizing their individual per-site likelihood values. The lowest possible rate has been
limited to 0.0001 to avoid numerical problems. The largest possible rate is arbitrary. The per-site rates are optimized using a Brent-like iterative method [19]. Provided the optimized individual ratesri, i= 1, ..., m they have to be mapped to the respective rate cate-goriesρj, j = 0, ..., c−1. RAxML uses a very simple procedure to categorize rates which is mainly based on the per-site likelihood contributionsl(ri). Initially, all individual ratesri, rj,i=jfor whichabs(ri−rj)< 0.001 are stored in an intermediate set of rate categories
σk, k ≤ m and their partial likelihoods are summed up and stored in l(σk), e.g. l(σk) := l(ri) +l(rj) if
abs(ri−rj)<0.001. Thereafter, the list ofσkis sorted with respect to the partial likelihood values l(σk) in descending order such that those ratesσk which con-tribute most the overall likelihood are at the front of the sorted list. The firstcentries of the sortedσk list will become the rate categoriesρjfor the inference pro-cess, i.e.ρ0:=σ0, ..., ρc−1:=σc−1. Finally, an individ-ual site i is then assigned the rate categoryk≤cwhich minimizesabs(ρk−ri). It is important to note, that the
parameter for the optimization of per-site evolution-ary rates is lowered progressively. It is lowered at each invocation of the rate category optimization function, which is executed after each iteration of the RAxML tree search algorithm.
The RΓ Algorithm: The RΓ (read Refinement un-der Γ) optimization option is a modified version of the standard hill-climbing search algorithm of RAxML as described in [23]. RΓ optimization can be invoked by specifying-f hin the command line of RAxML. The purpose of this search algorithm is to further optimize trees under Γ that have initially been computed un-der CAT. For example, initial trees can be inferred using CAT and then further be refined using Γ with the RΓsearch algorithm. One main difference with re-spect to the standard search algorithm is that the max-imum rearrangement setting is limited to a distance of 5. In addition, the analytical optimization of branch lengths (for details see [23]) which is mainly intended for the initial optimization phase where many improved trees are encountered, is omitted. Thus, the lengths of branches adjacent to the insertion points of subtrees are optimized thoroughly during the entire optimiza-tion process. The limitaoptimiza-tion of the rearrangement dis-tance and the choice to optimize branches thoroughly are due to the assumption that refinement under a dis-tinct, though related, model of substitution will not result in dramatic changes of the tree topology. This is of course a very questionable and perhaps danger-ous assumption, but works well in the concrete case: a refinement of trees inferred with CAT under Γ (see
next Section). The combined inference process of trees under CAT with a subsequent refinement using RΓwill henceforth be called CAT+RΓ.
4. Experimental Setup & Results
Test Data: In order to conduct experiments, a relatively large number of 19 real-world alignments from various sources has been used. The align-ments comprising 150, 200, 250, 500, 1,000, and 1,665 taxa (150 ARB,...,1663 ARB) have been ex-tracted from the ARB small subunit ribosomal ribonu-cleic acid (ssu rRNA) database [14]. Those align-ments contain organisms from the domains Eukarya, Bacteria and Archaea. In addition, the 101 and 150 sequence data sets (101 SC, 150 SC, available at www.indiana.edu/˜rac/hpc/fastDNAml) are used. Furthermore, two well-known real data sets comprising 218 and 500 sequences (218 RDPII, 500 ZILLA) were included into the test set. In particular, the 500 ZILLA alignment has been studied extensively under the par-simony criterion [3]. A 193-taxon data set 193 VINH is also included which has been used by Vinhet al.[12] to assess performance of the PhyNav program. A set of 7 alignments comprising 73, 74, 104, 128, 144, 178, and 180 mitochondrial DNA sequences of mam-mals (73 Olaf,...,180 Olaf) have kindly been provided by Olaf Bininda-Emonds from the Technische Univer-sit¨at M¨unchen. Finally, an alignment of 715 archaeal 16s sequences (715 CHUCK) has been obtained from the Pace Laboratory at the University of Colorado at Boulder. It is important to note that, except for the 128 OLAF dataset, it was not possible to obtain real-world alignments with a Γ shape parameterα≤0.3 or
α≥1.4. The general consensus of responses from Bi-ologists was that the above range ofαvalues is typical for real alignment data (personal communications). In a paper on bacterial phylogenies Daleviet al.make the same observation [5].
Test Platforms: PHYML (v2.4.4), RAxML (now available as RAxML-VI (v1.0)), and IQPNNI (v3.0.b1) have been compiled usinggcc-3.3.3. All performance tests where executed on the Infiniband-cluster at the Technische Universit¨at M¨unchen, equipped with 36 2.4GHz Quad-Opteron nodes and 8GB of main mem-ory per node. In order to measure the amount of cache misses in RAxML an Intel 1.3GHz Itanium processor was used, since hardware counters can easily be ob-tained on this architecture usingpfmon.
Experimental Setup: For each alignment, a set of randomized parsimony starting trees was
gener-ated with RAxML (see [23]). For the smaller align-ments (≤ 250 sequences) 10 distinct starting trees per dataset were generated and for the larger ones (> 250 sequences) 5 trees. In order to keep the inference times within reasonable limits the HKY85 model of nucleotide substitution was used. On each dataset/starting tree combination a RAxML search was executed using the HKY85+Γ model, the HKY85+CAT model with c = 25 rate categories and the HKY85+CAT model with c = 50 rate cate-gories. Moreover, the final HKY85+CAT trees were refined using the RΓ algorithm. To ensure a fair comparison the final Γ log likelihood values lΓ were computed for all trees obtained under HKY85+CAT. Therefore, all likelihood-based comparisons in this study refer to Γ likelihood values! This evaluation of final topologies was per-formed using the RAxML model and branch length optimization option -f e, i.e. the topology itself was not altered. The topological Robinson-Foulds dis-tances [21] were also computed using the respective final trees of each individual run with Γ, CAT, and CAT+RΓ. In order to determine the number of L2 and L3 cache misses RAxML was executed once per datasets on 8 alignments (see Table 3) withonefixed starting tree under the HKY85+Γ and HKY85+CAT (c= 25) models.
PHYML and IQPNNI have been executed once on each alignment under the HKY85+Γ model. The pro-grams have only been executed once per dataset, since they use a deterministic neighbor joining starting tree. Note that, there exist subtle differences in the numeri-cal implementation of the likelihood function between PHYML and IQPNNI and RAxML, especially with re-spect to scaling very small likelihood values. To this end, the Γ likelihood values of all final tree topologies have been computed with RAxML (-f ecommand line option) to ensure a fair comparison of scores. PHYML is a purely deterministic program and the inference pro-cess terminated in all cases. In IQPNNI the number of iterations of the search algorithm can be set to ar-bitrary values. Therefore, the number of iterations of the IQPNNI algorithm was set to approximately match the inference times of RAxML (execution time ratios between 0.7 and 1.5, see Table 2).
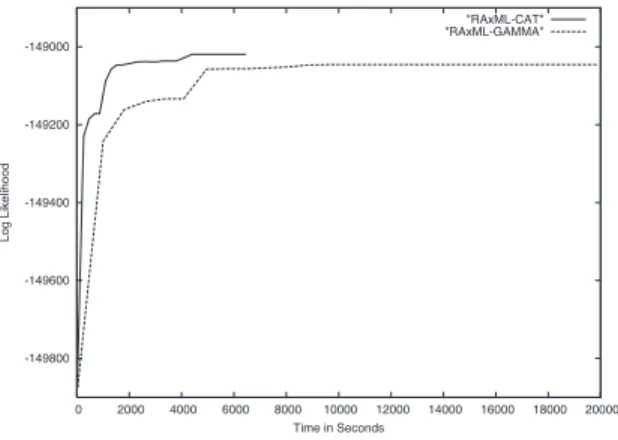
Results: As already mentioned the main argument against using the Γ model is the high memory con-sumption and the high computational cost. To empha-size this point Figure 1 depicts the development of the Γ likelihood values over time under the HKY85+CAT model with c = 25 (RAxML-CAT) and under the HKY85+Γ model (RAxML-CAT) for 715 CHUCK on
-149800 -149600 -149400 -149200 -149000 0 2000 4000 6000 8000 10000 12000 14000 16000 18000 20000 Log Likelihood Time in Seconds "RAxML-CAT" "RAxML-GAMMA"
Figure 1.ΓLog Likelihood development over
time under the CAT andΓmodels
the same starting tree.
Since the Γ model represents the by far more es-tablished method all trees obtained with CAT have been re-evaluated under Γ in order to match the per-spective of the prevailing opinion in the phylogenetics community. Due to the fact that, on average the re-sults under CAT withc = 50 were worse then under
c= 25, most probably due to a more prominent effect of over-fitting the data, only results withc = 25 are depicted. The results for c= 50 are available on-line at www.ics.foth.gr/˜stamatak. Table 1 indicates the average RAxML execution time improvements of CAT over Γ (column: T(Γ)/T(CAT)). In addition, the av-erage execution time improvements of CAT+RΓ com-pared to inferences under Γ were determined (column: T(Γ)/T(CAT+RΓ)). Furthermore, the ratios of the final Γ likelihood values lΓ(Γ)/lΓ(CAT) obtained un-der Γ and CAT were determined. Thus, if lΓ(Γ) / lΓ(CAT) < 1.0 the inference under Γ yielded better final Γ likelihood values and if lΓ(Γ) / lΓ(CAT)>1.0 the inference under CAT yielded better final Γ likeli-hood values. An analogous ratio has been computed to compare CAT+RΓ with the “pure” Γ inference values (column: lΓ(Γ)/lΓ(CAT+RΓ)). Columns RF(Γ,CAT) and RF(Γ,CAT+RΓ) indicate the average Robinson-Foulds distance between the final tree topologies ob-tained under CAT and Γ as well as CAT+RΓ and Γ respectively. Finally, column α indicates the values of the Γ shape parameter per dataset and colum # pat the number of distinct patterns in each alignment which corresponds tom(length of the computationally intensivefor-loops). The average values for all param-eters determined over all datasets and all starting trees are provided in the bottom line of Table 1. Note that, the apparently small likelihood differences in Table 2
are significant since they have been calculated based on thelog likelihood values and therefore indicate the difference in log likelihood units.
Table 2 provides a performance comparison of the averages obtained with RAxML under CAT (c = 25) with IQPNNI and PHYML under Γ. Columns T(P)/T(R) and T(I)/T(R) indicate the execution time ratio of T(PHYML)/T(RAxML) and T(IQPNNI)/T(RAxML) respectively. In addition, columns lΓ(P)/lΓ(R) and lΓ(I)/lΓ(R) depict the ratio of the Γ likelihood values of the final trees lΓ(PHYML)/lΓ(RAxML)and lΓ(IQPNNI)/lΓ(RAxML).
Dataset T(P)/T(R) lΓ(P)/lΓ(R) T(I)/T(R) lΓ(I)/lΓ(R) 73 OLAF 0.84 1.000097 1.07 1.000077 74 OLAF 1.25 0.999948 1.23 0.999948 104 OLAF 0.79 1.000235 1.44 1.000684 128 OLAF 0.99 1.000041 0.92 0.999752 144 OLAF 1.43 1.000435 1.03 1.000706 178 OLAF 0.77 0.999954 0.80 0.999797 180 OLAF 0.37 1.002741 1.10 1.001716 101 SC 1.03 1.002887 1.20 1.001444 150 SC 0.90 1.003077 1.03 1.002178 150 ARB 2.17 1.000338 1.59 1.000444 193 VINH 0.36 1.000965 0.91 1.000542 200 ARB 1.48 1.000601 0.96 1.000265 218 RDPII 0.72 1.001665 0.91 1.001024 250 ARB 1.01 1.000267 0.82 1.000250 500 ARB 0.35 1.003701 0.76 1.001822 500 ZILLA 0.31 1.001872 0.72 1.000869 715 CHUCK 0.57 1.006013 0.76 1.003195 1000 ARB 0.65 1.002969 1.22 1.002700 1663 ARB 0.23 1.003419 0.82 1.003063 Averages 0.85 1.001644 1.02 1.001078
Table 2. Performance comparison of RAxML-CAT with IQPNNI and PHYML
Table 3 indicates the ratios L2(Γ)/L2(CAT) and L3(Γ)/L3(CAT) of the number of L2 and L3 cache misses RAxML produced under the CAT and Γ mod-els for a representative subset of alignments. Column T(Γ)/T(CAT) indicates the execution time ratios. It is important to emphasize that these results deviate from the results in Table 1 since they have been obtained on a distinct CPU architecture and arenot average values over multiple starting trees.
Dataset L2(Γ)/L2(CAT) L3(Γ)/L3(CAT) T(Γ)/T(CAT) 150 SC 10.76 6.88 3.55 150 ARB 5.83 5.84 3.62 193 V 10.90 8.19 2.82 200 ARB 6.32 10.02 5.13 218 RDPII 5.57 6.98 3.31 250 ARB 7.12 10.37 4.94 500 ZILLA 6.83 4.30 2.94 715 V 6.33 4.26 2.73 Averages 7.46 7.11 3.63
Table 3. L2 and L3 Cache misses forΓand
CAT
Discussion: Modeling processes we know little about, such as evolution, can lead to controversial
dis-Dataset T(Γ)/T(CAT) T(Γ)/T(CAT+RΓ) lΓ(Γ)/lΓ(CAT) lΓ(Γ)/lΓ(CAT+RΓ) RF(Γ,CAT) RF(Γ,CAT+RΓ) α # pat 73 OLAF 4.177018 2.779953 0.999959 0.999997 0.008392 0.005594 1.180 1,196 74 OLAF 3.456038 2.429559 0.999963 0.999963 0.029371 0.029371 0.575 578 104 OLAF 2.971896 1.465592 0.999616 1.000293 0.113659 0.098049 0.329 581 128 OLAF 8.728934 4.362863 1.000026 1.000268 0.016996 0.016996 3.166 2,985 144 OLAF 4.353371 2.233404 0.999983 1.000107 0.055789 0.055088 0.825 1,254 178 OLAF 4.742052 2.397997 0.999998 1.000183 0.026346 0.026062 0.634 1,150 180 OLAF 3.261044 2.300603 0.999608 1.000112 0.048179 0.046499 0.454 924 101 SC 8.607863 4.081393 0.999791 0.999873 0.098492 0.084925 0.417 1,630 150 SC 4.212270 2.630621 0.999955 1.000037 0.040404 0.032323 0.433 1,130 150 ARB 6.935958 4.125580 1.000019 1.000032 0.013805 0.014478 0.562 2,137 193 VINH 2.541966 1.822700 0.999929 1.000007 0.117755 0.112272 1.313 459 200 ARB 7.359741 3.981281 1.000068 1.000089 0.036272 0.034257 0.534 2,253 218 RDPII 5.890610 2.320172 0.999824 1.000018 0.120092 0.103695 0.545 1,847 250 ARB 7.076141 3.817160 1.000027 1.000076 0.032394 0.028974 0.580 2,330 500 ARB 7.378079 3.243040 1.000112 1.000207 0.057573 0.050351 0.579 2,751 500 ZILLA 4.156063 3.014160 1.000160 1.000203 0.054162 0.048947 0.494 1,193 715 CHUCK 4.663363 2.297917 0.999991 1.000146 0.043868 0.039804 0.842 1,231 1000 ARB 8.151405 2.894259 1.001454 1.001549 0.051377 0.048072 0.552 3,364 1663 ARB 4.897310 1.827990 1.000221 1.000320 0.087571 0.084487 0.621 1,576 Averages 5.450585 2.843487 1.000037 1.000183 0.055395 0.050539 0.770 1,609
Table 1. Comparison of finalΓand CAT trees computed with RAxML
cussions and views. Thus, an empirical approach which takes into account the biological and medical insights which can be achieved using competing models should be adopted. This also holds for modeling rate het-erogeneity in ML programs. The general necessity of incorporating rate heterogeneity has been empiri-cally deduced and accepted. In order to account for the prevailing views trees inferred via CAT have been evaluated under Γ to demonstrate that CAT can find topologies with equally good and even partially bet-ter likelihood values than Γ under exactly the same search algorithm. Thus, CAT can be used as a work-around for the computationally intense Γ model in a large number of practical cases. In addition, the RΓ search option has been incorporated into RAxML to offer a trade-off between the currently widely preferred Γ model and the speed of CAT. The CAT+RΓ algo-rithm still yields an average reduction in execution times by a factor of 2.8. The maximum average devi-ations in Γ likelihood scores range between−0.000392 and +0.001454 for CAT and−0.000127 and +0.001549 for CAT+RΓ respectively (see Table 1). The score-differences in those cases where CAT yields inferior average likelihoods than Γ are acceptable. Moreover, on average over all datasets both CAT and CAT+RΓ yield better Γ likelihood scores at significantly lower inference times. Despite the relatively small average deviations of likelihood scores the topological distance between trees obtained by Γ and CAT is in some cases relatively large (104 OLAF, 101 SC, 193 VINH, 218 RDPII, 1663 ARB). Due to the more exhaustive search algorithm and the highly optimized implemen-tation of the likelihood functions, both for Γ and CAT, RAxML clearly out-competes other fast and popular ML programs such as IQPNNI and PHYML within the same amount of execution time. For PHYML the maximum score deviations range from−0.000052 to +0.006013 and for IQPNNI from −0.000248 to
+0.003195. It is important to note, that IQPNNI and PHYML only out-competed RAxML under CAT without refinement on 3 of the smaller datasets where considerations regarding inference times and memory consumption are less important. Simulated data has not been used in the present study because there is no means to generate simulated alignment data with Seq-Gen [20] under the CAT model as opposed to the Γ model. Therefore, such an analysis would a prioribe biased in favor of Γ. From the HPC perspective, the arguments in favor of CAT are evident: The inference times are significantly better for CAT and CAT+RΓ due to the lower number of L2 and L3 cache misses (see Table 3) and the smaller number of floating point operations. In addition, analyses of huge trees with several thousands of taxa, can be conducted with a quadruple (for the most common implementation of Γ using 4 distinct rate categories) alignment size under CAT.
5. Conclusion & Future Work
To the best of the author’s knowledge this paper provides the first comparative study of the Γ and CAT models of rate heterogeneity on typical real-world alignment data under the same search algorithm. In addition, the first detailed description of a simple rate categorization algorithm is given. The current release of RAxML-VI which is available as open source code at www.ics.foth.gr/˜stamatak also incorporates the RΓ algorithm. It is important to note that the results in this paper have been obtained using the old and significantly slower hill-climbing search algorithm of RAxML-V. The final Γ likelihood values of trees in-ferred under CAT and CAT+RΓ are in many cases better than those computed under Γ and only slightly worse in the remaining cases. Moreover, RAxML un-der CAT (without RΓ) out-competes other popular and
fast ML programs under Γ on all large datasets where HPC-related considerations are important. However, a method to mathematically determine a “good” num-ber of rate categories c for a specific alignment un-der some statistical criterion is desirable. Nonethe-less,based on the Γ likelihood scores, it has been demonstrated, that CAT can be used as a replacement for Γ. Moreover, CAT currently represents the only computationally feasible solution to accommodate rate heterogeneity in the analyses of huge trees, given that an analysis of 25,000 taxa with RAxML-VI currently requires 2GB of main memory.
Acknowledgments
The author is grateful to Charles Robertson and Olaf Bininda-Emonds for providing some of the real-world datasets for this study. Special thanks go to Daniele Catanzaro for the very helpful comments on this manuscript.
References
[1] D. Bader, B. Moret, and L. Vawter. Industrial appli-cations of high-performance computing for phylogeny reconstruction. InProc. of SPIE ITCom, volume 4528, pages 159–168, 2001.
[2] M. Brauer, M. Holder, L. Dries, D. Zwickl, P. Lewis, and D. Hillis. Genetic algorithms and parallel pro-cessing in maximum-likelihood phylogeny inference. Molecular Biology and Evolution, 19:1717–1726, 2002. [3] M. W. Chase and et al. Phylogenetics of seed plants: An analysis of nucleotide sequences, from the plastid gene rbcl. Annals of the Missouri Botanical Garden, 80:528–580, 1993.
[4] B. Chor and T. Tuller. Maximum likelihood of evolu-tionary trees is hard. InProc. of RECOMB05, 2005. [5] D. Dalevi, P. Hugenholtz, and L. Blackall. A
multiple-outgroup approach to resolving divisionlevel phyloge-netic relationships using 16s rdna data.Int. J. of Syst. and Evol. Microbiol., 51:385–391, 2001.
[6] J. Felsenstein. Evolutionary trees from DNA se-quences: A maximum likelihood approach. Journal of Molecular Evolution, 17:368–376, 1981.
[7] J. Felsenstein. Phylip (phylogeny inference package) version 3.6, 2004. Distributed by the author. Depart-ment of Genome Sciences, University of Washington, Seattle.
[8] S. Guindon and O. Gascuel. A simple, fast, and accu-rate algorithm to estimate large phylogenies by maxi-mum likelihood. Syst. Biol., 52(5):696–704, 2003. [9] M. Hasegawa, H. Kishino, and T. Yano. Dating of the
human-ape splitting by a molecular clock of mitochon-drial dna.J. Mol. Evol., 22:160–174, 1985.
[10] J. Huelsenbeck and F. Ronquist. Mrbayes: Bayesian inference of phylogenetic trees. Bioinformatics, 17:754–755, 2001.
[11] G. Jobb, A. Haeseler, and K. Strimmer. Treefinder: A powerful graphical analysis environment for molecular phylogenetics. BMC Evolutionary Biology, 4, 2004. [12] S. Le, H. Schmidt, and A. Haeseler. Phynav: A novel
approach to reconstruct large phylogenies. InProc. of GfKl conference, 2004.
[13] A. Lemmon and M. Milinkovitch. The metapopula-tion genetic algorithm: An efficient solumetapopula-tion for the problem of large phylogeny estimation. Proc. of the Nat. Acad. of Sci., 99:10516–10521, 2001.
[14] W. Ludwig and et al. Arb: A software environment for sequence data.Nucl. Acids Res., 32:1363–1371, 2004. [15] S. Meyer and A. v. Haeseler. Identifying site-specific substitution rates.Mol. Biol. Evol., 20:182–189, 2003. [16] B. Minh, L. Vinh, A. Haeseler, and H. Schmidt. piqpnni - parallel reconstruction of large maximum likelihood phylogenies.Bioinformatics, 2005. [17] G. Olsen, H. Matsuda, R. Hagstrom, and R.
Over-beek. fastdnaml: A tool for construction of phylo-genetic trees of dna sequences using maximum likeli-hood.Comput. Appl. Biosci, 20:41–48, 1994. [18] G. Olsen, S. Pracht, and R.
Over-beek. Dnarates distribution. unpublished. geta.life.uiuc.edu/˜gary/programs/DNArates.html. [19] W. Press, S. Teukolsky, W. Vetterling, and B.
Flan-nery. Numerical Recipes in C: The Art of Scientific Computing. Cambridge University Press, New York, NY, USA, 1992.
[20] A. Rambaut and N. C. Grassly. Seq-gen: An ap-plication for the monte carlo simulation of dna se-quence evolution along phylogenetic trees. Comp. Appl. Biosc., 13:235–238, 1997.
[21] D. F. Robinson and L. R. Foulds. Comparison of phy-logenetic trees.Mathematical Biosciences, 53:131–147, 1981.
[22] H. Schmidt, K. Strimmer, M. Vingron, and A. Hae-seler. Tree-puzzle: maximum likelihood phylogenetic analysis using quartets and parallel computing. Bioin-formatics, 18:502–504, 2002.
[23] A. Stamatakis, T. Ludwig, and H. Meier. Raxml-iii: A fast program for maximum likelihood-based inference of large phylogenetic trees.Bioinformatics, 21(4):456– 463, 2005.
[24] D. L. Swofford and G. J. Olsen. Phylogeny reconstruc-tion. In D. Hillis and C. Moritz, editors, Molecular Systematics, chapter 11, pages 411–501. Sinauer Ass. Inc., Sunderland, Massachusetts, USA, 1990. [25] Z. Yang. Maximum likelihood phylogenetic estimation
from dna sequences with variable rates over sites. J. Mol. Evol., 39:306–314, 1994.
[26] Z. Yang. Among-site rate variation and its impact on phylogenetic analyses.Trends Ecol. Evol., 11:367–372, 1996.