Predicting Ebola Severity: A Clinical
Prioritization Score for Ebola Virus Disease
Mary-Anne Hartley1,2
*, Alyssa Young1☯, Anh-Minh Tran1☯, Harry Henry Okoni-Williams1,
Mohamed Suma1, Brooke Mancuso1, Ahmed Al-Dikhari1, Mohamed Faouzi3
1 GOAL Global, Dublin, Ireland, 2 University of Lausanne, Lausanne, Switzerland, 3 Institute of Social and
Preventive Medicine, Lausanne, Switzerland
☯These authors contributed equally to this work.
*mary-anne.hartley@unil.ch
Abstract
Background
Despite the notoriety of Ebola virus disease (EVD) as one of the world’s most deadly infec-tions, EVD has a wide range of outcomes, where asymptomatic infection may be almost as common as fatality. With increasingly sensitive EVD diagnosis, there is a need for more accurate prognostic tools that objectively stratify clinical severity to better allocate limited resources and identify those most in need of intensive treatment.
Methods/Principal Findings
This retrospective cohort study analyses the clinical characteristics of 158 EVD(+) patients at the GOAL-Mathaska Ebola Treatment Centre, Sierra Leone. The prognostic potential of each characteristic was assessed and incorporated into a statistically weighted disease score. The mortality rate among EVD(+) patients was 60.8% and highest in those aged<5 or>25 years (p<0.05). Death was significantly associated with malaria co-infection (OR = 2.5, p = 0.01). However, this observation was abrogated after adjustment to Ebola viral load (p = 0.1), potentially indicating a pathologic synergy between the infections. Similarly, refer-ral-time interacted with viral load, and adjustment revealed referrefer-ral-time as a significant determinant of mortality, thus quantifying the benefits of early reporting as a 12% mortality risk reduction per day (p = 0.012). Disorientation was the strongest unadjusted predictor of death (OR = 13.1, p = 0.014) followed by hiccups, diarrhoea, conjunctivitis, dyspnoea and myalgia. Including these characteristics in multivariate prognostic scores, we obtained a 91% and 97% ability to discriminate death at or after triage respectively (area under ROC curve).
Conclusions/Significance
This study proposes highly predictive and easy-to-use prognostic tools, which stratify the risk of EVD mortality at or after EVD triage.
a1111111111 a1111111111 a1111111111 a1111111111 a1111111111 OPEN ACCESS
Citation: Hartley M-A, Young A, Tran A-M,
Okoni-Williams HH, Suma M, Mancuso B, et al. (2017) Predicting Ebola Severity: A Clinical Prioritization Score for Ebola Virus Disease. PLoS Negl Trop Dis 11(2): e0005265. doi:10.1371/journal.
pntd.0005265
Editor: Peter W. Horby, University of Oxford,
UNITED KINGDOM
Received: May 13, 2016 Accepted: December 15, 2016 Published: February 2, 2017
Copyright:©2017 Hartley et al. This is an open access article distributed under the terms of the Creative Commons Attribution License, which permits unrestricted use, distribution, and reproduction in any medium, provided the original author and source are credited.
Data Availability Statement: All relevant data are
within the paper and its Supporting Information files.
Funding: This study was funded by the Department
for International Development (DfID) (https://www. gov.uk/government/organisations/department-for-international-development, Grant number: 04890) via the humanitarian aid organisation, GOAL Global (https://www.goalglobal.org/). The funders had no role in study design, data collection and analysis,
Author Summary
The unprecedented spread of EVD across the fragile healthcare systems of West Africa during the 2013–2015 outbreak infected over 28,600 patients and established it as a disease for which low-income countries are at disproportionate risk. In order to improve the stan-dard of patient care, it is essential to better allocate scarce resources amongst the heteroge-neous symptomatic presentations of EVD. This retrospective cohort study on 158 EVD (+) patients in Sierra Leone constructs 2 easy-to-use scoring systems that accurately strat-ify EVD severity and thus objectively identstrat-ify the patients in most need of intensive ther-apy. Using statistically weighted symptoms and demographic characteristics, we obtained scores with a 91% and 97% ability to discriminate death at or after triage respectively. These scores included Ebola viral load, patient age and referral time as well as the symp-toms of disorientation, haemorrhage and myalgia. Further univariate analysis revealed several independent predictors of mortality, where patients aged between 5 and 25 years were most likely to survive, while malaria co-infection increased the risk of death by 2.5-fold (p = 0.01). Correcting referral-time for viral load, we also quantify the benefits of early reporting as a 12% mortality risk reduction per day (p = 0.012). Mortality in this cohort was 3-fold more than patients treated in resource-rich settings (60.8% vs. 18%) and we propose that focused patient care is a feasible and low-cost effort that may begin to close this gap.
Introduction
Ebola virus disease (EVD) caused by the virulentZaire ebolavirusstrain is described by the
WHO as one of the world’s most deadly infections, with case fatality rates exceeding 80% in
past epidemics [1,2]. Supportive care in the 2013–2015 outbreak in West Africa was shown to
reduce the EVD mortality rate to around 50% [3], and overall, the WHO has reported 40%
fatalities among the 28,603 people affected by EVD [4]. Despite its notoriety as a fatal disease,
over 80% of patients survived when treated in resource-rich environments of Europe and the
USA [5]. Further, asymptomatic infections are not only possible but could constitute up to a
third of all transmissions [6–9]. Overlooking these infected (but minimally contagious)
indi-viduals was proposed to result in the overestimation of EVD epidemic modelling, and revealed
the heterogeneous range of EVD symptomology [10]. Improved prognostic tools that
objec-tively stratify mortality risk among EVD patients could better allocate limited resources by identifying those most in need of intensive treatment and to aid clinical decision-making. Fur-ther, the clinical trials undertaken in the Ebola response have been criticised for the potential
bias introduced via the lack of randomisation and contemporaneous controls [11,12]; thus, a
method of objectively controlling differences in mortality risk among participants may aid analysis.
Existing EVD staging models used in Sierra Leone, were based on a WHO protocol adapted
from the clinical presentation of Lassa fever [13], where 3 symptomatic stages were described:
1) Early/non-specific, 2) gastrointestinal and 3) late/complicated, featuring haemorrhage and organ failure. While it has since been shown that these three stages of the disease are broadly
correlated to EVD outcome [14], the system could be greatly improved by using statistically
weighted symptoms that better stratify the risk of mortality. Several studies have already
iden-tified single symptoms statistically predictive for EVD mortality, such as confusion [15–17],
diarrhoea,[16,18] asthenia [15,18], hiccups [14], haemorrhagic signs [14,16,19], dizziness [18],
extreme fatigue [15], and high viral load [14,17,18,20]. However, the various permutations in
decision to publish, or preparation of the manuscript.
Competing Interests: The authors have declared
which symptoms occur in each individual, necessitates a multivariate approach to more accu-rately predict mortality.
The Ebola virus has been hypothesized to exercise its diverse range of virulence through the mammalian immune system. Here, it causes a pathologic overstimulation of innate immune receptors, triggering a flood of inflammation that causes collateral damage to multiple organ
systems [21,22], and results in a wide range of symptomatic presentations [8,23]. It is then
easy to imagine the additive detrimental effect of an inflammatory co-infection such as the
malaria parasite,Plasmodium falciparum. The annual incidence of malaria in Sierra Leone is
350 cases per 1000 population and it has been reported to be more prevalent in EVD triaged
patients than EVD itself [24]. However, despite these statistics, little is known about EVD/
malaria co-infection or its effect on patient prognosis.
In this retrospective cohort study, we analyse the clinical and epidemiological data from 158 EVD(+) patients admitted to the GOAL-Mathaska ETC in Port Loko, Sierra Leone. We investigate the role of malaria in EVD pathogenesis and evaluate the potential of the clinical characteristics in predicting EVD mortality at triage as well as in on each day of patient care. Further, we use these results to construct a statistically weighted disease scoring and staging system, which identifies the most prevalent factors that are predictive of mortality.
Methods
Study design
This retrospective cohort study uses anonymized patient data collected between December 14, 2014 and November 15, 2015 at the GOAL ETC in Port Loko, Sierra Leone. Data comprised patient demographics, geographic location, clinical signs and symptoms, and laboratory results (for malaria infection and semi-quantitative Ebola viremia), as well as the final patient out-come of death or survival. We evaluate the potential of clinical characteristics in predicting EVD mortality and use these results to construct a symptom-based disease staging system, which corresponds to the prognostic power of the most prevalent symptoms.
Patient referral
The ETC was run by the humanitarian organization GOAL Global in cooperation with the Sierra Leonean Ministry of Health and Sanitation (MoHS). The ETC opened in December 2014 and accepted 600 patients from a catchment area spanning 200km. EVD surveillance in Sierra Leone was implemented through District Ebola Response Centres (DERCs). Individuals who were sick were encouraged to report their illness (or the suspected illness of others) via the national or district Ebola call-lines. Individuals that met the WHO case definition for EVD
[25], as well as those with confirmed EVD infection, were referred to the ETC from
surround-ing communities, holdsurround-ing centres, health facilities, and quarantine houses. All EVD(+) patients were treated according to standard treatment protocols developed by WHO and Me´decins
Sans Frontières [13,26]. This included empiric antimalarial treatment (Artesunate and
Amo-diaquine), broad-spectrum antibiotics, and nutritional supplementation for all patients, as well as oral or intravenous fluid rehydration.
Data collection
Signs and symptoms were recorded daily, on admission and throughout the patients’ length of stay at the ETC. Once triaged, blood was drawn and tested for EVD in on-site laboratories managed by Public Heath England. EVD diagnosis was determined by semi-quantitative
(Ct) value was used as an inverse proxy for viral load and a cut-off of 40 was used to discrimi-nate between positive and negative values. Patients qualified as EVD(-) and were discharged from the ETC after returning two negative Ebola-specific qRT-PCR tests. Histidine-rich pro-tein-II (HRP-II) antigen rapid diagnostic kits were used for testing of malaria infections, which were performed on admission at the ETC.
Signs and symptoms
Symptoms were reported by the patient during a comprehensive questionnaire by trained staff. Haemorrhaging, pyrexia, and disorientation were recorded by clinicians after examina-tion. Haemorrhagic signs included visible blood loss such as hematochezia, hematemesis, hae-maturia, epistaxis, haemoptysis or persistent haemorrhage from an IV catheter site as well as subcutaneous haemorrhage such as purpura and petechiae. Pyrexia was defined as a body tem-perature over 38˚C, measured using an infrared thermal sensor. Disorientation was measured by trained ETC clinicians as per the AVPU alertness scale (where pain and unconsciousness were considered “disorientated”). Additionally, any specific mention of “confusion” or “dis-orientation” in the medical notes was also considered a positive for this variable.
Cohorts and inclusion criteria
Of the 600 patients admitted to the ETC, 10 were declared dead on arrival and 24 were classi-fied as late transfers from other ETCs or holding centres (treated elsewhere and thus conva-lescent on arrival) or had incomplete data. Thus, a total of 34 patients were excluded from this analysis. Of the 566 patients involved in the study, 100% had diagnostic test results for EVD, where 27.9% tested EVD(+) (n = 158). 543/566 patients had malaria test results, of which 34.6% were malaria(+) (n = 188). The cohort was evaluated for missing values in each variable. Referral time (the time in days from symptom onset to admission at the ETC) had 20 cases of missing data. Further analysis was undertaken to evaluate the aetiology of missingness, which included demographic variables (such as age and sex), clinical severity variables (such as EVD viral load) as well as the covariates used in the final scoring model. Here, we found that sub-jects with missing data did not differ systematically from those with observed referral time, which is in favour of the hypothesis that the data were missing completely at random. In addi-tion, we performed a sensitivity analysis using the “Hotdeck” imputation technique, which
showed that the model coefficients did not change when using complete data [28]. The patient
catchment area and mortality rates can be visualised inS1 Fig.
Data entry
Ethical approval for this research was granted by the Sierra Leone Ethics and Scientific Review Committee (SLESRC). To maximize data fidelity, patient files were entered into a secure Micro-soft Excel database and crosschecked by 3 independent and trained analysts. Entry of clinical data was overseen by members of the clinical ETC staff. Graphs were constructed using Graph-pad Prism, version 6. Univariate and multivariate analysis was conducted using STATA soft-ware, version 14 (StataCorp). Score validation was performed using “RMS” R-Package (R
Development Core Team. ISBN 3-900051-07-0, URL:http://www.R-project.org). Results were
deemed statistically significant at a p-value of less than 0.05.
Primary data Analysis
Epidemiological data and symptoms were summarized by their frequencies and percentages. Univariate logistic regression was performed to assess the association between each predictor
and the outcome of death (reported as Odds-Ratios (OR) and p-values). Potential interactions were tested (such as the effect of sex, age, referral time and Ebola contact). The functional rela-tion between the outcome of death and continuous variables (age, days admitted, referral time and EVD viral load) were checked using a fractional polynomial model. The linearity
assump-tion was confirmed for days admitted and referral time but not for age (S2 Fig) or Ct Value
(S3 Fig). To simplify the prognostic score, age was coded into three categories: (1)<5 years +
[25–45] years, (2) [5–25] years, and (3)>45 years.S2 Figshows the rationale for the chosen
categories on their polynomial curve. The 5–25 group is used as a reference, being the lowest
risk group. Comparing the<5 years category to the reference, we obtained an OR of 5.35 (p =
0.006), while the 25–45 category returned an OR of 2.61 (p = 0.002). Comparisons between the 0–5 and 25–45 groups, however, showed that they were not significantly different (p = 0.2) and they could thus be grouped to simplify the user interface of the score. The area under the ROC curves for the scoring systems presented in this study were not statistically different when comparing these age categorisations with the polynomial function of age as a continuous variable. However, a continuous function would undoubtedly be more accurate on a larger sample size.
For PCR results, a Ct value lower than 20 cycles was categorized as “high viral load” and
correlated to the natural threshold for the probability of fatal outcome (S3 Fig, dotted line).
As there was an insufficient number of patients in the survival group (death = 96, survival = 62) compared to the number of 31 potential predictors, only the predictors associated to the
out-come at level of p<0.20 were considered into a Stepwise Backward selection procedure to fit a
multivariable logistic regression model [29]. The “daily” score for calculating risk after triage
would ideally be handled with a time-dependent model in order to limit immortal time bias. However, these were not a good fit for our data, as the proportionality-hazards assumption was violated by non-parallel lines between categorical variables on log-log plots. Thus, a logis-tic multivariate model was privileged. Model diagnoslogis-tics were performed to check for influen-tial observations that impact coefficient estimates and a Hosmer-Lemeshow goodness-of-fit test was performed to assess calibration. Discriminative performance of the final model was assessed by calculating the Area Under the Receiver Operating Characteristics (ROC) Curve (AUC) and its 95% confidence interval.
Calculation of the prognostic scores and model validation
Theβ-coefficient = log(OR) of each covariate of the final model was converted into an
integer-based point-scoring system. The score was then derived as the sum of the covariates’ weighted scores. Internal validation using the bootstrap method (repeated 1000 times) as described in
Harrell et al [30] was used to provide a more accurate estimate of the performance of the
origi-nal model (model based score: AUCoriginal). The algorithm calculates the optimism of the
pre-dictive discrimination in the original model. The difference (AUCoriginal−optimism) gives
the bootstrap-corrected (i.e. internally validated) performance of the original model. As
described in Steyerberg et al [31], bootstrapping has unavoidable limitations in small cohorts
with a large number of predictors.
Role of the funding source
The funder had no role in study design, data collection, data analysis, data interpretation, or writing of the report. The corresponding author had full access to the data in the study and had final responsibility for the decision to submit for publication.
Results
1. Epidemiological characteristics of EVD outcome
Of the 566 patients included in this study, 27.9% tested positive for EVD (n = 158). The crude
mortality rate among EVD(+) patients was 60.8% (Fig 1A). Mortality rates were slighter higher
in males (68.4% vs. 53.7%), with a statistically insignificant 1.9 fold increase in odds of death
(p = 0.06) (Fig 1B). EVD survivors were on average 10 years younger than those who died
(24.9 years vs. 34.3 years, p = 0.014) (Fig 1C). However, mean age of death did not differ
among EVD(-) patients who died before being transferred out of the ETC (Fig 1C) or among
genders (p>0.05). In general, case fatality rates for EVD were higher at the youngest and oldest
extremes of age. The patient group aged between 5 and 24 years had the lowest mortality rate of 42.5%, which was significantly lower than other age groups. The over-45’s and under-5’s
were particularly vulnerable, being 11.6 and 5.4 fold more likely to die, respectively (Fig 1D).
Age groups were selected in order to ensure the mathematic simplicity of the final score. The
Fig 1. Epidemiological characteristics of EVD outcome. (A) Kaplan-Meier survival analysis of patients in the ETC according to their EVD status. (B)
Mortality among EVD(-) and EVD(+) admissions according to gender. (C) Average age of death among EVD(-) and EVD(+) patients. (D) Mortality rate across age groups in EVD(-) and EVD(+) cohorts. Dotted lines represent the average mortality rate across all ages in the cohort. Statistics in (C) calculated by unpaired t test*: p<0.05,**: p<0.005,***: p<0.001, ns: not significant.
polynomial curve of this continuous variable is shown inS2 Fig. Categorisation did not
signifi-cantly alter the accuracy of the final scores (p>0.05).
2. Prognostic potential of clinical characteristics recorded at and after
admission
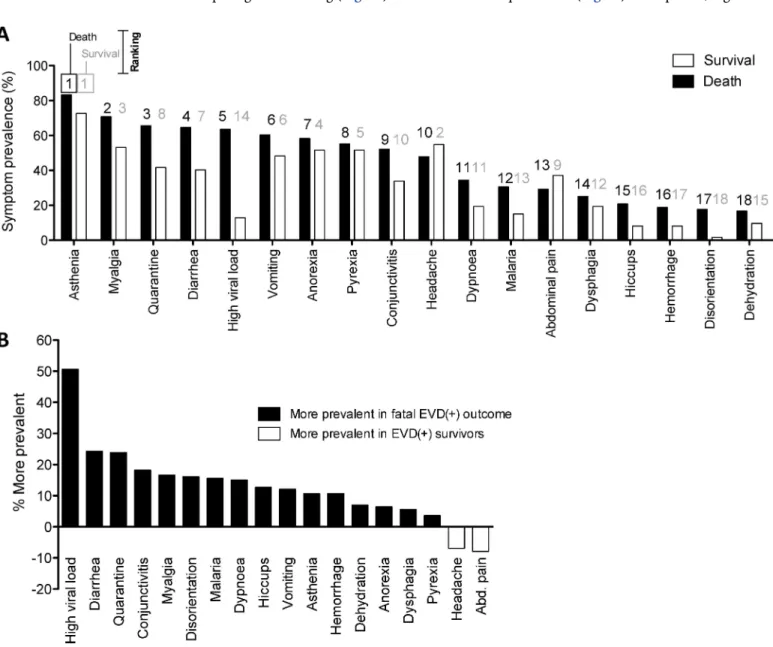
In an effort to better predict the risk of EVD death, we analysed the prevalence and prognostic potential of the major clinical characteristics among EVD(+) patients. Triage symptoms reported by over 50% of fatal EVD(+) patients were asthenia, myalgia, diarrhoea, anorexia,
vomiting, pyrexia, and headache (Fig 2AandTable 1). The prevalence of several of triage
symptoms was notably different between fatal and non-fatal outcomes, as can be seen by
com-paring their ranking (Fig 2A) or their differential prevalence (Fig 2B). As expected, high viral
Fig 2. Prognostic potential of clinical signs and symptoms recorded at and after admission. (A) Prevalence of clinical characteristics at triage
amongst EVD(+) patients who either survived or died, ranked according to the prevalence in fatal outcomes. Rankings from 1–19 are listed above each bar: black for the outcome of death and grey for survival. (B) Differences in symptom prevalence between EVD survivors and those who died. Positive values are more prevalent in fatal outcomes. Negative values are more prevalent in survivors.
Table 1. Association of clinical and laboratory characteristics to EVD mortality.
Clinical/Laboratory characteristics reported at triage Prevalence Univariate Multivariate
Patients with characteristic who survived Patients with characteristic who died Unadjusted association of characteristic with mortality
Multivariate association of selected characteristics with mortality
% (n) % (n) OR P value OR P value Coeff. Weight‡
TOTAL 39.2 (62) 60.7 (96) - -Ct value (<20)† 12.9 (8) 63.5 (61) 11.8 0.000* 0.9 0.900 -0.1 + 0 Diarrhoea 40.3 (25) 64.6 (62) 2.7 0.003* Conjunctivitis 33.9 (21) 52.1 (50) 2.1 0.026* Myalgia 53.2 (33) 69.8 (67) 2.0 0.036* 3.7 0.02* 1.3 + 3 Disorientation 1.6 (1) 17.7 (17) 13.1 0.014* 38.2 0.074 3.6 + 7 Malaria infection 15.0 (9) 30.6 (26) 2.5 0.034* Dyspnoea 19.4 (12) 34.4 (33) 2.2 0.044* Hiccups 8.1 (5) 20.8 (20) 3.0 0.038* Vomiting 48.4 (30) 60.4 (58) 1.6 0.138 Asthenia 72.6 (45) 83.3 (80) 1.9 0.107 Haemorrhage 8.1 (5) 18.8 (18) 2.6 0.070 ORL haemorrhage 3.2 (2) 10.4 (10) 3.5 0.115 Dehydration 9.7 (6) 16.7 (16) 1.9 0.221 Anorexia 51.6 (32) 58.3 (56) 1.3 0.407 Dysphagia 19.4 (12) 25.0 (24) 1.4 0.410 Pyrexia 51.6 (32) 55.2 (53) 1.2 0.658 Hepatomegaly 1.0 (1) 4.2 (4) 2.7 0.388 Anuria 1.6 (1) 4.2 (4) 2.7 0.388 Headache 54.8 (34) 47.9 (46) 0.8 0.396 Abdominal pain 37.1 (23) 29.2 (28) 0.7 0.299
Ref group: Age (5–25) 40.3 (25) 14.6 (14) - - - - - + 0
Age (<5 and 25–45) 53.2 (33) 58.3 (56) 3.3 0.000* 8.2 0.001* 2.1 + 4
Age (>45) 6.5 (4) 27.1 (26) 11.6 0.006* 80.9 0.000* 4.4 + 9
Ct value (>20) 87.1 (54) 36.5 (35) 0.70.9 0.000*
Referral time (mean) 4.6 days 3.9 days 0.120 0.6 0.000* -0.5 - 1
Ct (<20) X referral time† - - - - 1.4 0.008* 2.3 0.005* 0.8 + 2
Clinical/laboratory characteristics reported at any time AFTER triage in the ETC (only significant results listed)
Disorientation 14.5 (9) 66.7 (64) 11.8 0.000* 138.6 0.000* 4.9 + 10
Haemorrhage 6.5 (4) 24.0 (23) 6.0 0.000* 17.2 0.001* 2.8 + 6
Age (<5 and>25) 59.7 (37) 85.4 (82) 3.3 0.000* 8.1 0.012* 2.1 + 4
Ref group: Age (5–25) 40.3 (25) 14.6 (14) - - - - - + 0
Days admitted (mean) 10.4 days 4.2 days 0.69 0.000* 0.5 0.000* -0.6 + 1
Clinical and laboratory characteristics found at triage (upper section) or at any time during the patient’s stay at the ETC after triage (lower section). Characteristics appear in order of their differential prevalence (mortality—survival).
The “Univariate” column shows the unadjusted OR of each characteristic to mortality (shaded with a heat map identifying the most predictive characteristics).
The “Multivariate” column presents the characteristics used in the triage score (upper section) and daily score (lower section). Coefficients (Coeff) and their mathematically manipulated score weightings are shown in the final column.
‡Score weights are calculated as 2 X coefficient, rounded off to the nearest whole integer.
† “Ct (<20)” appears twice: First as an unadjusted variable and later as “Ct (<20) X Referral time” where it represents an interaction with referral time to aid
mathematic simplicity of the score.
*: p<0.05, OR: Odds ratio, Coeff: coefficient, ETC: Ebola treatment centre.
load (Ct value<20) was approximately 50% more common among fatal outcomes and uni-variate analysis revealed it as a major correlate of mortality with 11.8 fold odds of death
(p>0.0001) (Table 1). While disorientation on admission was not common in EVD(+)
patients (11.4%), when present, it was associated with 94.4% of fatalities in EVD(+) patients,
and was therefore the strongest indicator of fatal outcome (OR 13.1, p = 0.014) (Table 1).
Other factors showing a statistically significant association with death were diarrhoea,
hic-cups, myalgia, dyspnoea and conjunctivitis (all p<0.05) (Table 1). While haemorrhagic signs
were infrequent on admission (14.6%), developing haemorrhage at any point during
admis-sion at the ETC was associated with a 6-fold higher odds of mortality (p>0.0001) (Table 1).
Finally, malaria infection was more prevalent in fatal outcomes (Fig 2B) and will be
dis-cussed further below.
3. Prognostic value of Ebola virus load (Ct value)
EVD diagnoses were routinely confirmed by qRT-PCR, where the cycle threshold (Ct) value is inversely proportional to the Ebola virus copy number. We used similar parameters presented
in other studies to delineate high and low Ct values [14,32], where a Ct value lower than a
threshold of 20 cycles was categorized as “high viral load”. This also correlated to the natural
threshold for the probability of fatal outcome in our cohort (S3 Fig). Ct values were available
for 144/158 of the EVD(+) cohort (91.1%) and ranged from 13.5 to 37.9. Of these, 39%
(n = 57) were classified as having with high viral loads (Fig 3A). The mean Ct value (22.0) did
not vary by gender (p>0.05) but was differentially distributed across ages, where each 10 years
corresponded to a decrease of 0.4 Ct points (i.e. an increase of viral load) (p = 0.035) (Fig 3B).
Finally, the average Ct value for survivors was significantly higher than those who had a fatal
outcome (24.9 vs. 20.6, p<0.01) (Fig 3C and 3D), where odds of death were 12.6 times higher
for patients with Ct values of less than or equal to 20 (p<0.0001).
4. Impact of EVD referral sensitivity and admission time on outcome
An EVD staging model developed by the UK Defense Medical Services in reference to WHO guidelines on the pathogenesis of haemorrhagic fever, divides the temporal evolution of EVD
into three symptomatic stages [13,14]. Here, the “early” stage is comprised of non-specific
symptoms lasting three days. Considering this timeline, we investigated the impact of early referral on mortality. Crude analysis showed that a fatal outcome was not associated to a later referral time. Oppositely, EVD survivors presented at the ETC one day later than those who died (4.6 vs. 3.6 days) albeit a statistically insignificant trend (p = 0.12). Indeed, those present-ing within 3 days of symptom onset had a 15% higher mortality than those presentpresent-ing later
(p = 0.09) (Fig 4A). This counter-intuitive trend of earlier healthcare seeking behaviour
result-ing in higher death risk could be theoretically explained as the confoundresult-ing effect of disease severity. Here, we propose that patients presenting earlier are doing so as they have a more severe acute disease and thus represent a population predisposed to mortality risk. To investi-gate this hypothesis, we compared viral loads as a proxy for disease severity and found that
those presenting earlier had similar viral loads to those presenting later (Fig 4B). This result
indicates that early presenters have more severe acute disease. Correcting for viral load as a confounding factor (where comparisons are only made between patients with equal viral loads), we found the more intuitive result that delayed treatment was significantly associated with mortality. Here, the probability of death increased by an average of 12% for each day of
delayed treatment during the 1stweek of symptoms (p = 0.012) (Fig 4C) (Table 1). This
Oppositely, each day spent within the ETC increased the odds of survival by 1.4 fold
(p<0.0001) irrespective of viral load (Fig 4D) (Table 1). The average admission duration for
EVD(+) survivors was 10.4 days while deaths occurred, on average, within the first 4.2 days of
admission (Fig 4D).
Finally, quarantine status upon admission was available for 96% of ETC admissions (n = 551), 25% of which were referred from quarantine houses. EVD(+) patients referred from quarantined homes had an earlier referral time than those not referred from quarantine
facili-ties (3.8 days vs. 4.7 days, p = 0.03) (Fig 4E). This quantifies the potential patient benefit of
quarantine in the region, however, we found no difference in mortality by quarantine status (OR = 1.8, p = 0.08).
Fig 3. Prognostic value of Ebola virus load (Ct value). (A) Distribution of Ct values1for EVD(+) patients considered to have a high viral load (Ct20) and low viral load (Ct>20). (B) Ct value distribution across age in the EVD(+) cohort. The red line plots the fractional polynomial prediction of the Ct value. (C) Ct values amongst survivors and fatalities in the EVD(+) cohort. (D) Kaplan-Meier survival analysis of EVD(+) patients according their Ebola virus loads, either considered as high viral (Ct20) or low viral load (Ct>20).1Ct values represent Ebola-specific qRT-PCR results (inversely proportional to the viral load). Statistics in (C) calculated by unpaired t test*: p<0.05,**: p<0.005,***: p<0.001, ns: not significant.
5. Impact of malaria infection on patient outcome
Of the 543 EVD(+) and EVD(-) patients with a known malaria test, 34.8% tested malaria(+). Among EVD(+) patients, 24% were co-infected with malaria compared to 38% EVD(-) (OR = 2, p = 0.005). The prevalence for malaria infection varied drastically across age categories, where 5 year olds had an over 50% probability of being malaria(+) in both EVD(-) and EVD(+)
cohorts (Fig 5A). Despite the WHO standard of care to treat all ETC admissions with
Artemini-sin Combination Therapy (ACT) upon admission (irrespective of malaria status)[33], EVD
(+)/malaria(+) co-infected patients suffered a significantly higher mortality rate compared to
EVD alone (74.3% vs. 53.6%, OR = 3.9, p = 0.03 after controlling for age and gender) (Fig 5B).
Fig 4. Impact of EVD referral sensitivity on diagnosis and patient outcome. (A) Mortality rate for EVD(+) patients who were referred “early” (within
3 days of reported symptom onset) or “late” (after 3 days of symptom onset). (B) Cycle threshold (Ct) values1among early and late EVD(+) referrals. (C) Probability of death according the referral time corrected for Ct value. (D) Probability of death according the number of days spent in the ETC. The average number of days spent in the ETC for patients with fatal or survival outcomes are indicated in colour. (E) Mean referral time of EVD(+) patients according to quarantine (Qt) status.1Ct values represent Ebola-specific qRT-PCR results (inversely proportional to the viral load). Statistics in (A, B and
E) calculated by unpaired t test*: p<0.05,**: p<0.005,***: p<0.001, ns: not significant
Ebola viral load was differentially distributed across EVD(+) patients who were co-infected or not with malaria. Co-infected EVD(+)/malaria(+) patients had significantly higher viral
loads compared to patients infected with EVD alone (mean Ct = 20.8 vs. 22.3, p<0.01) (Fig
5C). Controlling for viral load, the increased mortality in malaria co-infected EVD(+) patients
was abrogated (p = 0.107) (Fig 5D). Taken together, these results reveal a potential pathogenic
synergy between the malaria parasite and Ebola virus.
Fig 5. Impact of malaria co-infection on patient outcome. (A) Probability of malaria infection across age for EVD(-) and EVD(+) cohorts. (B) Mortality rates among EVD(-) and EVD(+) cohorts according to the presence of malaria infection. (C) Ct value1among EVD(+) patients co-infected or not by malaria. (D) Probability of death among EVD(+) patients co-infected or not by malaria according to EVD Ct value1.1Ct values represent Ebola-specific qRT-PCR results (inversely proportional to the viral load). Statistics in (C) calculated by unpaired t test.*: p<0.05,
**: p<0.005,***: p<0.001, ns: not significant
6. Derivation of a prognostic scoring system for EVD outcome
Performing multivariate analysis of the above data, we selected the clinical characteristics most predictive for EVD mortality using data collected at triage or at any time during the patients’
stay in the ETC (Table 1). By stepwise backwards elimination, and prioritizing the most
preva-lent symptoms, we identified several characteristics which yielded significant predictive values at triage and during admission. Characteristics that were statistically significant predictors of
mortality at admission were vulnerable age groups (<5, 25–45 and>45 years), myalgia,
dis-orientation and referral-time (normalised to viral load) (Table 1). Characteristics that were
statistically significant predictors of mortality after admission were vulnerable age groups (<5
and>25 years), disorientation and haemorrhage. Oppositely, days spent in the ETC was a
sig-nificant predictor of survival (OR 1.5-fold for each day, p<0.0001) (Table 1). Despite the
strong association of malaria co-infection with fatality in our univariate analysis above, malaria infection was rendered insignificant in our multivariate analysis.
We then calculated weightings for both scores from the predictive coefficients with the aim to find a simplified scoring model using whole integers and calculations limited to subtraction
or addition (Table 1). Testing the sensitivity and specificity of these weightings for the
predic-tion of EVD infecpredic-tion, we found that the characteristics yielded an area under the ROC curve
(AUC) of 91.4% (CI95%: 87–96%) for discriminating mortality at triage (Fig 6A) and 97.5%
(CI95%: 95–99%) for calculations after admission (Fig 6B). The risk category cut-offs for each
score are illustrated inFig 6C and 6D. Each category contains at least 10% of the cohort. The 3
risk cut-offs (Low, Medium and High) were selected based on the linear risk curve (Fig 7),
where “Low” and “High” categories represent risk plateaus on the extremes of the risk statistic
(Low<7%, and High>98%).
Examining the accuracy of the triage mortality score, we found that the “high” risk classifi-cation was composed of 99% correctly classified fatal outcomes while the “low” risk category
had a less than 10% mortality rate (Fig 6E). After triage, the “high” risk category of the daily
score was composed of 98% fatalities compared to less than 1% in the “low” risk category (Fig
6F). An internal validation of the triage and daily scores yielded a final discriminative power of
89.12% and 97.04% respectively (Table 2). As described in Steyerberg et al [31], bootstrapping
has unavoidable limitations in small cohorts with a large number of predictors and thus the optimism may be over-estimated. External validation is needed to best test these associations.
Discussion
The Ebola virus affects diverse tissues types across various organ systems [8,21–23] and it
is thus unsurprising that infection outcomes have a similarly heterogeneous range: from asymptomatic to multiple organ failure. This heterogeneity presents a situation where blanket therapies would be not only inefficient, but also inappropriate. Improving the efficiency of interventions in the difficult working conditions of an ETC is a priority in resource con-strained environments, where at some points of the epidemic, EVD patients could expect less
than 20min of clinician care per day [34]. In an effort to create an objective measure of disease
severity, we evaluated the clinical features of EVD, which are able to discriminate between death and survival.
As with all the studies reporting on symptomatic outcomes in the Ebola outbreak, analysis is limited by the accuracy of self-reported symptoms that are subject to recall-bias as well as the potential social stigma associated to withholding symptoms, leading to acquiescence or social desirability bias. However, the generalizability of the data collected on this cohort was demonstrated when we externally validated a diagnostic scoring system by Levine et al and obtained an almost identical discriminative power compared to their cohort from rural Liberia
Fig 6. Derivation of prognostic scoring system for EVD outcome. The sensitivity and specificity of predicting mortality in EVD(+) patients using the
scoring system developed with clinical parameters collected (A) at triage or (B) daily during the admission of the patient at the ETC. The area under the receiver-operator characteristic (ROC) curve represents the discriminative power of each score. (C-D) Sensitivity (green) and specificity (blue) according to the score points of (C) the triage score and (D) the daily score. Prevalence of survivors and those with fatal outcome are displayed as bar graphs and risk category cut-offs are shown as vertical lines. (E) Percentage of survivors and patients with fatal outcome classified in each risk category of the triage EVD mortality score and the (F) daily EVD mortality score.
[35]. Further, many of our descriptive findings were consistent with other studies on EVD mortality, where the patients most likely to have a fatal outcome were those over 45 or under 5
years of age (Fig 1D) [14–16,18], and where males and females had similar mortality rates (Fig
1B) [36]. Symptoms predictive of EVD related mortality in our cohort were disorientation,
diar-rhoea, hiccups, myalgia, dyspnoea, and conjunctivitis (Fig 2A and 2B,Table 1), which differ
slightly from other studies, where disorientation [16,18] and diarrhoea [15,16,18] were the
only overlapping symptoms predictive of fatal outcome. In line with other studies, our results show that Ebola viral load is a significant determinant of patient outcome, where mortality was
over 12 times more likely when patients had a Ct value20 (Table 1) [3,18,32,37].
A recent report on the heterogeneous kinetics of Ebola viral load in blood revealed stark
differ-ences between survivors and non-survivors [38], and helps to explain our counterintuitive finding
that morality rates were slightly higher among patients with earlier referral times. Here, we show Fig 7. Scorecards to extrapolate the Ebola severity risk. Ebola Virus disease severity risk calculated at (A) triage and (B) after triage. Full page printable
templates of these scorecards can be found in the supplementary information (S4andS5Figs). doi:10.1371/journal.pntd.0005265.g007
Table 2. Internal validation of EVD prognostic scores.
AUCoriginal Optimism AUCcorrected
Triage mortality score 91.4% 0.022% 89.12%
Daily mortality score 97.56% 0.005% 97.04%
the existence of “survival-bias”, where those presenting earlier may have had more severe acute disease and thus a higher predisposition for mortality, while late-presenters tended to survive. Controlling for viral load, we can conclude the expected finding, that referral time was a
signifi-cant determinant of mortality (Fig 4C), where each day without treatment augmented mortality
risk by over 12% within the first week of symptoms. This information supports the important public health message on the benefits of early referral and the efficacy of supportive care.
In this cohort, malaria co-infection was a prevalent and significant determinant of EVD
mortality where co-infected patients had a 2.5-fold increased odds of death (Fig 5B). As
malaria prevalence was most common among children in this cohort, it is likely to have played a role in their increased mortality. A study on a smaller cohort of 89 patients in Guinea did not find malaria as a significant determinant of mortality, albeit limited by a number of 24 control
patients [39]. Another recent study revealed that patients treated with artesunate-amodiaquine
therapy had a 31% lower risk of death compared to artemether-lumefantrine [40]. Fortunately,
all patients in this study received the antimalarial associated with survival. Our analysis showed that the correlation of mortality to malaria co-infection was confounded by Ebola viral load,
where malaria co-infection was significantly associated to increased viremia (Fig 5C). The fact
that adjusting malaria co-infection for Ebola viremia abrogated malaria’s association with mortality reveals a potential synergy between the malaria parasite and the Ebola virus, where malaria may increase mortality via increased EVD virulence. As malaria parasitemia was not quantified in this study, it is unknown whether the effect of malaria infection had a linear asso-ciation with EVD, or indeed, whether it was reciprocal. While the mechanism of this potential interaction is unknown, the virulent synergy between viruses and parasites has been previously
described to act via the immune system and deserves further investigation [41,42].
After analysing the potential interactions, we included the most prevalent and predictive clinical characteristics of EVD into two prognostic scores, stratifying the risk of mortality at triage and in daily clinical care. We obtained a discriminative power of over 90% for both scores and, using our cohort, we were able to predict high-risk outcome of death with over
95% accuracy (Fig 6E and 6F). It is well appreciated that the accurate diagnostic triage of EVD
is essential to reduce the risk of nosocomial infection. However, prognostic triage may play an equally important role in patient safety by focusing intensive care on those who need it most.
Limitations
All prognostic tools carry the risk of becoming self-fulfilling prophecies if incorrectly used as an indicator for palliation: dooming severely ill patients to death when the score is not reflec-tive of clinical advances. This score is specifically adapted to an Ebola response in resource-constrained settings, where clinical resources achieved a 40% survival rate. As an 80% survival
rate was possible among patients in resource rich environments [5], it is clear that the
interpre-tation of the score would need to evolve with anticipated clinical advancements. However, the major asset of this score is not limited to prediction of the binary outcome of death, but rather its use as a proxy for “disease severity” in resource limited environments. Thus, while the out-come of “death” may change with improved treatment options, patients scoring highly on this tool can still be shortlisted for intensive intervention. Additionally, with the exciting potential
of machine-learning predictive tools [43], scoring systems such as these can become more
durable and evolve with their developing environments, where a future of accurate EVD diag-nosis and progdiag-nosis is a realistic possibility.
As we found for malaria, EVD is certainly not the only contributing factor to mortality within an ETC, and patients who have lived a lifetime within a poorly resourced health care system very probably have diverse and complex competing risks. This is an unavoidable bias,
as accurate secondary diagnostics for co-morbidities were primitive at best for the bulk of the patients. We await retrospective analyses on patient samples that may reveal the presence of other co-infections or confounding genetic/immunologic anomalies.
Finally, external validation is an essential step before the endorsement of any clinical tool. Without external validation, the level of inaccuracy within this cohort cannot be estimated and thus these scoring systems must be used with this caution in mind.
Conclusion
This study identifies several epidemiological and clinical features, which are significantly pre-dictive for the outcome of EVD infection and proposes several highly accurate statistical tools to predict the clinical severity of EVD and aid objective clinical prioritization.
Perspectives
External validation and systematic meta-analyses of the clinical features of EVD are needed to fine-tune the statistical weightings of this score to further improve its accuracy and geographi-cal relevance.
Supporting Information
S1 Checklist. STROBE Checklist.
(DOCX)
S1 Fig. EVD(+) mortality rate by section at the GOAL-Mathaska ETC.
(TIF)
S2 Fig. Probability of death across ages. Age categories were made to ensure mathematic
simplicity of the clinical scores developed in this study. Dotted lines show the age categorisa-tions based on the risk of death. As the lowest risk group, the 5–25 year olds are used as a refer-ence. Comparing the 0–5 year olds to the reference, we obtained an OR of 5.35 (p = 0.006), while the 25–45 category returned an OR of 2.61 (p = 0.002). Comparisons between the 0–5 and 25–45 groups, however, showed that they were not significantly different (p = 0.02). This result qualifies the 0–5 and 25–45 age groups for pooling. The area under the ROC curves for the scoring systems presented in this study were not statistically different when comparing these age categorisations with the polynomial function of age as a continuous variable. (TIFF)
S3 Fig. Probability of death according to Ct value. (A) Predicted risk of death using
frac-tional polynomial analysis. (B) Predicted risk of death (%). The dotted vertical lines indicate
the threshold for “high viral load” (Ct<20) and “low viral load” (Ct>20).
(TIFF)
S4 Fig. Printable scorecard to extrapolate the Ebola severity risk at triage.
(TIFF)
S5 Fig. Printable scorecard to extrapolate the Ebola severity risk after triage.
(TIFF)
S1 Table. Complete data for the multivariate score to predict Ebola severity risk at triage.
(DOCX)
S2 Table. Complete data for the multivariate score to predict Ebola severity risk after triage.
Acknowledgments
Firstly, the authors would like to acknowledge all the patients whose data was used in this study for their valuable contribution to the improved diagnosis and care of future patients with this devastating disease. We also acknowledge the medical staff employed at the GOAL-Mathaska ETC who contributed to this study, especially Elijah Ongeri (RN), Laura Fisher (RN), Luca Saraceno (Ph.D), Alex Salam (MD), Franklin Umenze (MD), and Junior Tumba (MD). Finally, we thank Tim Brook and colleagues at Public Health England for their method-ical laboratory services and the Port Loko Ministry of Health who collaborated on this study.
Author Contributions
Conceptualization: MAH.
Data curation: MAH AY AMT MF. Formal analysis: MAH AY AMT MF. Funding acquisition: MAH AY.
Investigation: MAH AY AMT HHOW MS BM. Methodology: MAH MF.
Project administration: MAH AY. Resources: MAH AAD.
Supervision: MAH. Validation: MAH MF. Visualization: MAH.
Writing – original draft: MAH AY. Writing – review & editing: MAH.
References
1. CDC. Ebola Virus Disease Distribution Map, 17 Feb 2016 Centers for Disease Control and Prevention: http://www.cdc.gov/vhf/ebola/outbreaks/history/distribution-map.html
2. Weyer J, Grobbelaar A, Blumberg L. Ebola virus disease: history, epidemiology and outbreaks. Current infectious disease reports. 2015 May; 17(5):480. doi:10.1007/s11908-015-0480-yPMID:25896751
3. Bah EI, Lamah MC, Fletcher T, Jacob ST, Brett-Major DM, Sall AA, et al. Clinical presentation of patients with Ebola virus disease in Conakry, Guinea. The New England journal of medicine. 2015 Jan 1; 372(1):40–7. doi:10.1056/NEJMoa1411249PMID:25372658
4. World Health Organization. Ebola Situation Report, 17 Feb 2016:http://apps.who.int/iris/bitstream/ 10665/204418/1/ebolasitrep_17Feb2016_eng.pdf?ua=1
5. Uyeki TM, Mehta AK, Davey RT Jr., Liddell AM, Wolf T, Vetter P, et al. Clinical Management of Ebola Virus Disease in the United States and Europe. The New England journal of medicine. 2016 Feb 18; 374(7):636–46. Pubmed Central PMCID: 4972324. doi:10.1056/NEJMoa1504874PMID:26886522
6. Leroy EM, Baize S, Volchkov VE, Fisher-Hoch SP, Georges-Courbot MC, Lansoud-Soukate J, et al. Human asymptomatic Ebola infection and strong inflammatory response. Lancet. 2000 Jun 24; 355 (9222):2210–5. PMID:10881895
7. Becquart P, Wauquier N, Mahlakoiv T, Nkoghe D, Padilla C, Souris M, et al. High prevalence of both humoral and cellular immunity to Zaire ebolavirus among rural populations in Gabon. PloS one. 2010; 5 (2):e9126. Pubmed Central PMCID: 2817732. doi:10.1371/journal.pone.0009126PMID:20161740
8. To KK, Chan JF, Tsang AK, Cheng VC, Yuen KY. Ebola virus disease: a highly fatal infectious disease reemerging in West Africa. Microbes and infection / Institut Pasteur. 2015 Feb; 17(2):84–97.
9. Dean NE, Halloran ME, Yang Y, Longini IM. Transmissibility and Pathogenicity of Ebola Virus: A Sys-tematic Review and Meta-analysis of Household Secondary Attack Rate and Asymptomatic Infection. Clinical infectious diseases: an official publication of the Infectious Diseases Society of America. 2016 May 15; 62(10):1277–86. Pubmed Central PMCID: 4845791.
10. Bellan SE, Pulliam JR, Dushoff J, Meyers LA. Ebola control: effect of asymptomatic infection and acquired immunity. Lancet. 2014 Oct 25; 384(9953):1499–500. doi:10.1016/S0140-6736(14)61839-0 PMID:25390569
11. Lanini S, Zumla A, Ioannidis JP, Di Caro A, Krishna S, Gostin L, et al. Are adaptive randomised trials or non-randomised studies the best way to address the Ebola outbreak in west Africa? The Lancet Infec-tious diseases. 2015 Jun; 15(6):738–45. doi:10.1016/S1473-3099(15)70106-4PMID:25881871
12. Cohen J, Enserink M. INFECTIOUS DISEASE. As Ebola epidemic draws to a close, a thin scientific har-vest. Science. 2016 Jan 1; 351(6268):12–3. doi:10.1126/science.351.6268.12PMID:26721981
13. World Health Organization. Clinical management of patients with viral haemorrhagic fever: a pocket guide for the front-line health workers. 2014.
14. Hunt L, Gupta-Wright A, Simms V, Tamba F, Knott V, Tamba K, et al. Clinical presentation, biochemi-cal, and haematological parameters and their association with outcome in patients with Ebola virus dis-ease: an observational cohort study. The Lancet Infectious diseases. 2015 Nov; 15(11):1292–9. doi: 10.1016/S1473-3099(15)00144-9PMID:26271406
15. Qin E, Bi J, Zhao M, Wang Y, Guo T, Yan T, et al. Clinical Features of Patients With Ebola Virus Disease in Sierra Leone. Clinical infectious diseases: an official publication of the Infectious Diseases Society of America. 2015 Aug 15; 61(4):491–5.
16. WHO Ebola Response Team. Ebola virus disease in West Africa—the first 9 months of the epidemic and forward projections. The New England journal of medicine. 2014 Oct 16; 371(16):1481–95. Pubmed Central PMCID: 4235004. doi:10.1056/NEJMoa1411100PMID:25244186
17. Zhang X, Rong Y, Sun L, Liu L, Su H, Zhang J, et al. Prognostic Analysis of Patients with Ebola Virus Disease. PLoS neglected tropical diseases. 2015 Sep; 9(9):e0004113. Pubmed Central PMCID: 4580459. doi:10.1371/journal.pntd.0004113PMID:26398207
18. Schieffelin JS, Shaffer JG, Goba A, Gbakie M, Gire SK, Colubri A, et al. Clinical illness and outcomes in patients with Ebola in Sierra Leone. The New England journal of medicine. 2014 Nov 27; 371(22):2092– 100. Pubmed Central PMCID: 4318555. doi:10.1056/NEJMoa1411680PMID:25353969
19. Barry M, Traore FA, Sako FB, Kpamy DO, Bah EI, Poncin M, et al. Ebola outbreak in Conakry, Guinea: epidemiological, clinical, and outcome features. Medecine et maladies infectieuses. 2014 Dec; 44(11– 12):491–4. doi:10.1016/j.medmal.2014.09.009PMID:25391486
20. de La Vega MA, Caleo G, Audet J, Qiu X, Kozak RA, Brooks JI, et al. Ebola viral load at diagnosis asso-ciates with patient outcome and outbreak evolution. The Journal of clinical investigation. 2015 Dec; 125 (12):4421–8. Pubmed Central PMCID: 4665775. doi:10.1172/JCI83162PMID:26551677
21. Wauquier N, Becquart P, Padilla C, Baize S, Leroy EM. Human fatal zaire ebola virus infection is associ-ated with an aberrant innate immunity and with massive lymphocyte apoptosis. PLoS neglected tropical diseases. 2010; 4(10). Pubmed Central PMCID: 2950153.
22. Bradfute SB, Bavari S. Correlates of immunity to filovirus infection. Viruses. 2011 Jul; 3(7):982–1000. Pubmed Central PMCID: 3185794. doi:10.3390/v3070982PMID:21994766
23. McElroy AK, Erickson BR, Flietstra TD, Rollin PE, Nichol ST, Towner JS, et al. Ebola hemorrhagic Fever: novel biomarker correlates of clinical outcome. The Journal of infectious diseases. 2014 Aug 15; 210(4):558–66. Pubmed Central PMCID: 4172044. doi:10.1093/infdis/jiu088PMID:24526742
24. O’Shea MK, Clay KA, Craig DG, Matthews SW, Kao RL, Fletcher TE, et al. Diagnosis of Febrile Ill-nesses Other Than Ebola Virus Disease at an Ebola Treatment Unit in Sierra Leone. Clinical infectious diseases: an official publication of the Infectious Diseases Society of America. 2015 Sep 1; 61(5): 795–8.
25. World Health Organization. Case definition recommendations for Ebola or Marburg Virus Diseases http://www.who.int/csr/resources/publications/ebola/ebola-case-definition-contact-en.pdf2014.
26. Roddy P, Colebunders R, Jeffs B, Palma PP, Van Herp M, Borchert M. Filovirus hemorrhagic fever out-break case management: a review of current and future treatment options. The Journal of infectious dis-eases. 2011 Nov; 204 Suppl 3:S791–5.
27. Semper AE, Broadhurst MJ, Richards J, Foster GM, Simpson AJ, Logue CH, et al. Performance of the GeneXpert Ebola Assay for Diagnosis of Ebola Virus Disease in Sierra Leone: A Field Evaluation Study. PLoS medicine. 2016 Mar; 13(3):e1001980. Pubmed Central PMCID: 4811569. doi:10.1371/ journal.pmed.1001980PMID:27023868
28. Kalton G, Kasprzyk D, editors. Imputing missing survey responses. Proceedings of the section on sur-vey research methods, American Statistical Association; 1982.
29. Sauerbrei W, Royston P, Binder H. Selection of important variables and determination of functional form for continuous predictors in multivariable model building. Statistics in medicine. 2007 Dec 30; 26 (30):5512–28. doi:10.1002/sim.3148PMID:18058845
30. Harrell FE Jr., Lee KL, Mark DB. Multivariable prognostic models: issues in developing models, evaluat-ing assumptions and adequacy, and measurevaluat-ing and reducevaluat-ing errors. Statistics in medicine. 1996 Feb 28; 15(4):361–87. doi:10.1002/(SICI)1097-0258(19960229)15:4<361::AID-SIM168>3.0.CO;2-4PMID: 8668867
31. Steyerberg EW, Eijkemans MJ, Harrell FE Jr., Habbema JD. Prognostic modelling with logistic regres-sion analysis: a comparison of selection and estimation methods in small data sets. Statistics in medi-cine. 2000 Apr 30; 19(8):1059–79. PMID:10790680
32. Fitzpatrick G, Vogt F, Moi Gbabai OB, Decroo T, Keane M, De Clerck H, et al. The Contribution of Ebola Viral Load at Admission and Other Patient Characteristics to Mortality in a Medecins Sans Frontieres Ebola Case Management Centre, Kailahun, Sierra Leone, June-October 2014. The Journal of infectious diseases. 2015 Dec 1; 212(11):1752–8. Pubmed Central PMCID: 4633764. doi:10.1093/infdis/jiv304 PMID:26002981
33. World Health Organization. Guidance on temporary malaria control measures in countries with Ebola outbreaks:http://apps.who.int/iris/bitstream/10665/141493/1/WHO_HTM_GMP_2014.10_eng.pdf? ua=12014.
34. Boyles T. Priorities in Ebola research—a view from the field. Lancet. 2015 Jan 3; 385(9962):23.
35. Levine AC, Shetty PP, Burbach R, Cheemalapati S, Glavis-Bloom J, Wiskel T, et al. Derivation and Internal Validation of the Ebola Prediction Score for Risk Stratification of Patients With Suspected Ebola Virus Disease. Annals of emergency medicine. 2015 Sep; 66(3):285–93 e1. doi:10.1016/j.
annemergmed.2015.03.011PMID:25845607
36. WHO Ebola Response Team. Ebola Virus Disease among Male and Female Persons in West Africa. The New England journal of medicine. 2016 Jan 7; 374(1):96–8. doi:10.1056/NEJMc1510305PMID: 26736011
37. Yan T, Mu J, Qin E, Wang Y, Liu L, Wu D, et al. Clinical characteristics of 154 patients suspected of hav-ing Ebola virus disease in the Ebola holdhav-ing center of Jui Government Hospital in Sierra Leone durhav-ing the 2014 Ebola outbreak. European journal of clinical microbiology & infectious diseases: official publi-cation of the European Society of Clinical Microbiology. 2015 Oct; 34(10):2089–95.
38. Lanini S, Portella G, Vairo F, Kobinger GP, Pesenti A, Langer M, et al. Blood kinetics of Ebola virus in survivors and nonsurvivors. The Journal of clinical investigation. 2015 Dec; 125(12):4692–8. Pubmed Central PMCID: 4665798. doi:10.1172/JCI83111PMID:26551684
39. Barry M, Toure A, Traore FA, Sako FB, Sylla D, Kpamy DO, et al. Clinical predictors of mortality in patients with Ebola virus disease. Clinical infectious diseases: an official publication of the Infectious Diseases Society of America. 2015 Jun 15; 60(12):1821–4.
40. Gignoux E, Azman AS, de Smet M, Azuma P, Massaquoi M, Job D, et al. Effect of Artesunate-Amodia-quine on Mortality Related to Ebola Virus Disease. The New England journal of medicine. 2016 Jan 7; 374(1):23–32. doi:10.1056/NEJMoa1504605PMID:26735991
41. Hartley MA, Ronet C, Zangger H, Beverley SM, Fasel N. Leishmania RNA virus: when the host pays the toll. Frontiers in cellular and infection microbiology. 2012; 2:99. Pubmed Central PMCID: 3417650. doi:10.3389/fcimb.2012.00099PMID:22919688
42. Hartley MA, Ronet C, Fasel N. Backseat drivers: the hidden influence of microbial viruses on disease. Current opinion in microbiology. 2012 Aug; 15(4):538–45. doi:10.1016/j.mib.2012.05.011PMID: 22694933
43. Colubri A, Silver T, Fradet T, Retzepi K, Fry B, Sabeti P. Transforming Clinical Data into Actionable Prognosis Models: Machine-Learning Framework and Field-Deployable App to Predict Outcome of Ebola Patients. PLoS neglected tropical diseases. 2016 Mar; 10(3):e0004549. doi:10.1371/journal. pntd.0004549PMID:26991501