Hardware-Software Co-Design for
Network Performance Measurement
Srinivas Narayana*, Anirudh Sivaraman*, Vikram Nathan*, Mohammad Alizadeh*, David Walker†, Jennifer Rexford†, Vimalkumar Jeyakumar‡, Changhoon Kim** *MIT CSAIL,†Princeton University,‡Cisco Tetration Analytics,**Barefoot Networks
ABSTRACT
Diagnosing performance problems in networks is important, for example to determine where packets experience high la-tency. However, existing diagnostic tools are constrained by limited switch mechanisms for measurement. As a result, operators use endpoint information to indirectly infer root causes for performance issues.
Instead of designing piecemeal solutions to work around limited switch mechanisms, we believe that the right ap-proach is to co-design language abstractions and switch hardware primitives for performance measurement. This ap-proach provides confidence that the switch primitives are useful for a variety of existing and unanticipated use cases.
We present a declarative query language that allows oper-ators to ask a diverse set of network performance questions. We show that these queries can be implemented efficiently in switch hardware using a programmable key-value store primitive. Our preliminary evaluations show that our hard-ware design incurs modest additional chip area relative to existing switching chips, suggesting that it is a practical so-lution for network performance measurement.
1.
INTRODUCTION
Measuring network performance is critical to operating large networks such as datacenters, for example to diagnose high application latencies [6], localize queues suffering from incast [38], or measure utilization of different links. Delays in identifying and diagnosing network performance prob-lems can severely affect service availability. As a result, both industry and academia have expended considerable effort in network measurement [3, 6, 11, 18, 26, 32, 40].
Existing approaches to such performance analyses either
Permission to make digital or hard copies of all or part of this work for personal or classroom use is granted without fee provided that copies are not made or distributed for profit or commercial advantage and that copies bear this notice and the full citation on the first page. Copyrights for components of this work owned by others than the author(s) must be honored. Abstracting with credit is permitted. To copy otherwise, or republish, to post on servers or to redistribute to lists, requires prior specific permission and/or a fee. Request permissions from [email protected].
HotNets-XV, November 09 - 10, 2016, Atlanta, GA, USA
c
2016 Copyright held by the owner/author(s). Publication rights licensed to ACM. ISBN 978-1-4503-4661-0/16/11. . . $15.00
DOI:http://dx.doi.org/10.1145/3005745.3005775
rely on switch support to extract performance metrics, or in-fer such metrics indirectly from endpoint observations. To-day’s line-rate switches (switches with 10–100 ports running at 10–100 Gbit/s) support very limited measurement in the form of sampling [3, 11], counting [28, 29, 30, 39], and packet capture [23, 40]. These statistics are insufficient to compute performance metrics like latency or loss. Collect-ing data at endpoints [21, 31] is a more flexible solution, but it is limited in its visibility of the precise locations and root causes of network issues (e.g.,detecting flows contributing to incast at a switch), requiring operators to infer the results indirectly.
Historically, the limited flexibility of switch measurement was rooted in a belief that the sole purpose of switches was high forwarding performance—not flexibility. The recent emergence of programmable switching chips [2, 15, 7] sug-gests a change in thinking. Currently, however, these chips only support flexible packet parsing [20] and header process-ing [17]; their hardware primitives for measurement are still limited. Ideally, these chips would offer similar flexibility for network measurement as well.
At the same time, adding new measurement primitives to switch hardware is costly. To maximize bang-for-buck, any new primitives should be highly programmable, so that net-work operators can re-purpose them to diverse needs. To ensure that new primitives are sufficiently useful, we pro-pose switch architects engage inco-design: design both the hardware primitives and their programming abstractions at the same time. This lets us evaluate if the hardware design is sufficiently flexible to support an effective high-level opera-tor interface to write applications.
More concretely, we ask: can we let operators express performance questions in a high-level declarative query lan-guage, and identify the necessary switch primitives to effi-ciently support such queries?
We make two contributions. First, we introduce a declar-ative performance query language (§2) that allows users to identify packets with specific performance attributes (e.g., high latency packets), aggregate statistics over sets of pack-ets (e.g., to compute per-flow drop rates), and compose multiple queries together to ask more complex performance questions. The language is SQL-like, with queries writ-ten over an abstract table containing timestamped records of
each packet’s arrival and departure at every network queue. However, unlike SQL, the language also allows aggregations that depend on packet order, such as an EWMA over packet queueing latencies. Most importantly, the language frees op-erators from reasoning about the underlying switch imple-mentation of the measurements.
Second, we present a hardware design (§3) that efficiently supports performance queries. We propose aprogrammable key-value storeprimitive on switches to implement aggre-gations efficiently, where the keys are the aggregated fields in queries (e.g., transport 5-tuple), and the corresponding values are performance statistics tracked for each aggregate field (e.g., an EWMA of latencies of packets of each 5-tuple). This key-value store has two challenging require-ments: it must run at the clock frequency (typically 1 GHz) of a switching chip [17, 2, 4], and be large enough to track several million flows. To achieve both, we use a split de-sign: a fast on-chip SRAM cache updates key-value pairs at line rate, while a slower but larger off-chip backing store in DRAM is updated during cache evictions.
A full system design would include a query compiler that translates the high-level queries to configurations of the switch primitives automatically. We have not yet built such a compiler. But in §3.1 and §3.2, we map the language con-structs to hardware primitives that implement them.
We evaluate the expressiveness of the performance query language by programming several performance measure-ments in it (Fig. 2),e.g.,locating queues with a persistently high queue length. We evaluate our hardware design using packet traces from CAIDA [14]. We find that performance queries are feasible using a 32-Mbit SRAM cache, and a backing store that can support ~802K cache evictions per second. These requirements can be easily met: a 32-Mbit SRAM cache occupies < 2.5% of the die area of a switching chip [20]), while scale-out key-value stores such as Mem-cached and Redis support a few hundred thousand operations per second per core [5, 24, 10, 1].
2.
PERFORMANCE QUERY LANGUAGE
We seek a query language that enables network opera-tors to specify diverse performance questions, independent of their implementation on the network’s switches. Specifi-cally, operators should be able to:
1. request per-packet performance information, e.g., a packet’s queueing delay;
2. request traffic experiencing “interesting” performance, e.g.,high queueing delays;
3. aggregate information over packets sharing headers, e.g.,average packet latency per TCP connection; 4. find simultaneous occurrences of performance
condi-tions, e.g., many connections within a queue and a large queue size; and
5. compose queries over results of other queries.
Our abstraction for querying network performance, per-formance queries, follows from these requirements.
For-Fields:
field := srcip | dstip | ... // standard pkt headers | pkt_path | qid | tin | tout | qin | qout
Selection:
select_field := field | expr // field name or expression select_clause := SELECT [select_field]
from_clause := FROM id // table name identifier where_clause := WHERE pred // boolean predicate select_query := select_clause from_clause where_clause
Aggregation:
stmt := id=expr // assign expression code := stmt
| if pred then code else code agg_fun := def id ([id], [field]): code group_field := field | expr | agg_fun group_select := SELECT [group_field] group_clause := GROUPBY [field]
group_query := group_select group_clause from_clause
Join:
join_query := select_clause FROM id JOIN id ON [id]
Queries:
query := select_query | group_query | join_query
Figure 1: Simplified syntax of performance queries. Square brackets denote lists:e.g.,[field]is a list of fields.
mally, a performance query is a function that takes one table of records and returns another. By default, the input table of records contains each packet’s arrival and departure at every queue in a network. While a query is defined over all pack-ets, all packets are not actually collected for analysis: the system compiles queries and installs them on switches, after which only information pertinent to the query is collected. The results are then supplied to applications or human oper-ators for inspection. Our syntax is similar to SQL (Fig. 1); we explain it in detail below.
Performance-oriented schema. What per-packet informa-tion is required to pose diverse performance quesinforma-tions? We propose a table of records with the following schema:
(pkt_hdr, qid, tin, tout, qsize, pkt_path)
Here,pkt_hdrcontains the usual header fields parseable by a switch, such as TCP, IP, and MAC headers. The header also contains a fieldpkt_uniqto identify each packet uniquely.1
In addition to packet headers, the table contains metadata fields that track performance: qididentifies a specific queue on a specific switch at which the current packet is observed;2
tinandtoutare timestamps corresponding to the arrival and departure of the packet at that queue. Using two timestamps enables queries that recognize if two packets co-exist in a queue. If a packet is dropped at a queue, we assign tout
1
The interpretation ofpkt_uniqcould be determined by network operators,e.g.,a combination of invariant packet headers.
2
If a packet goes through multiple queues in a switch, each queue contributes a separate tuple.
Example Query code Description Linear in state? Per-flow counters SELECT COUNT, SUM(pkt_len) GROUPBY srcip, dstip Count packets and bytes for each src-dst IP pair. Yes
Latency EWMA def ewma (lat_est, (tin, tout)): Maintain a per-flow EWMA over queueing latencies Yes lat_est = (1 - alpha) * lat_est + alpha * (tout-tin) of packets.
SELECT 5tuple, ewma GROUPBY 5tuple
TCP out of sequence def outofseq ((lastseq, oos_count), tcpseq): Count packets with non-consecutive sequence Yes if lastseq + 1 != tcpseq: oos_count = oos_count + 1 numbers in each TCP stream.
lastseq = tcpseq + payload_len
SELECT 5tuple, outofseq GROUPBY 5tuple WHERE proto==TCP
TCP non-monotonic def nonmt ((maxseq, nm_count), tcpseq): Count packet retransmissions and reorderings in No if maxseq > tcpseq: nm_count = nm_count + 1 each TCP stream.
maxseq = max(maxseq, tcpseq)
SELECT 5tuple, nonmt GROUPBY 5tuple WHERE proto==TCP
Per-flow high latency R1 = SELECT pkt_uniq, SUM(tout-tin) GROUPBY pkt_uniq Count packets with high end-to-end latency per flow. Yes packets R2 = SELECT 5tuple FROM R1 GROUPBY 5tuple
WHERE SUM(tout-tin) > L
Per-flow loss rate R1 = SELECT COUNT GROUPBY 5tuple Determine loss rates per flow. Yes R2 = SELECT COUNT GROUPBY 5tuple WHERE tout==infinity
SELECT R2.COUNT/R1.COUNT FROM R1 JOIN R2 ON 5tuple
High 99th percentile def perc ((tot, high), qin): Identify queues with a 99th percentile queue size Yes queue size if qin > K: high = high + 1 (over packet samples) higher than a thresholdK.
tot = tot + 1
R1 = SELECT qid, perc groupby qid
R2 = SELECT * from R1 WHERE perc.high/perc.tot > 0.01
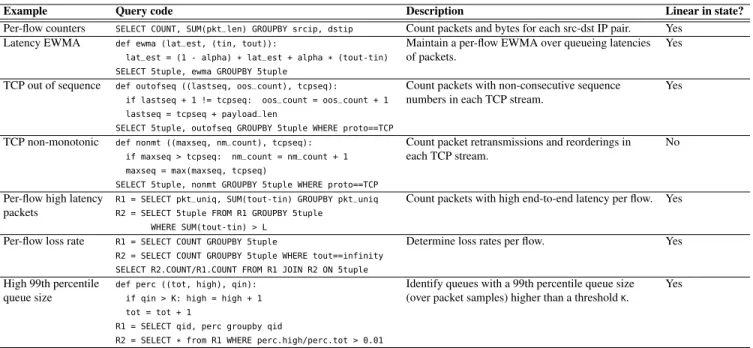
Figure 2: Examples of performance queries. For ease of illustration, we use standard SQL notation (COUNTandSUM) for fold functions that count unique packets or sum up a packet field across packets.
the valueinfinity. The fieldqsizeis the queue length seen by the packet when it is enqueued, andpkt_pathidentifies the packet’s path in the network. We leave its value uninter-preted,e.g.,it could be an opaque MPLS or VXLAN tunnel identifier. In all queries henceforth, we denote this table of packet observationsT.
Filtering based on values of performance metrics. The query language provides a SELECT ... WHERE construct to output records based on the result of boolean-valued tests, which restrict the set of packets or the values of performance metrics. For example, the query
SELECT srcip, qid FROM T WHERE tout - tin > 1ms
returns the source IP addresses of packets that experience a queueing latency higher than 1ms, along with the queue at which the latency was observed.
Aggregating across multiple packets. The query language provides aGROUPBYconstruct to aggregate information across sets of packets that share common attributes. For example, counting the number of bytes for each source-destination IP address pair is achieved as follows:
def sumlen (result, (pkt_len)): result = result + pkt_len SELECT srcip, dstip, sumlen GROUPBY srcip, dstip
Here,sumlenis a user-definedfoldfunction that adds up the packet lengths across all records (packets) sharing the same values of theGROUPBYfields. The fold functions take two ar-guments, an accumulator state and the current packet, and return an updated value of the accumulator state.
Fold functions can be used not only for SQL-style gations like sum, average, and count, but also to track aggre-gate statistics that depend on theorderin which packets were
seen at a given queue. For instance, one could track an expo-nentially weighted moving average of the queueing latency per transport 5-tuple (field list abbreviated to5tuple):
def ewma (lat_est, (tin, tout)):
lat_est = (1 - alpha) * lat_est + alpha * (tout - tin) SELECT 5tuple, ewma GROUPBY 5tuple
Multiple pieces of state can be updated within a fold func-tion. As an example, consider counting the number of “out-of-sequence” packets in every TCP stream:
def outofseq ((lastseq, oos_count), (tcpseq, payload_len)): if lastseq + 1 != tcpseq:
oos_count = oos_count + 1 lastseq = tcpseq + payload_len
SELECT 5tuple, outofseq GROUPBY 5tuple WHERE proto==TCP
Here the functionoutofseqincrements a counter each time the sequence numbers in the current TCP packet are not con-secutive with those of the previous packet in the connection. It also tracks an additional state variablelastseqto check if a packet is consecutive with the previous one.
Such order-dependent aggregation functions are inspired by list comprehensions in functional programming [27], and are not directly expressible with SQL GROUPBY, or even in popular window-based streaming SQL systems [37, 34].
Joining multiple queries.It is convenient to correlate results from multiple queries using relationalJOINs. The current query language is restricted to joins of the formT1 JOIN T2 ON keywherekeyuniquely identifies records in both tables3
T1andT2. An example of a permissibleJOINis the following query that determines packet drop rates for each 5-tuple:
R1 = SELECT COUNT GROUPBY 5tuple
R2 = SELECT COUNT GROUPBY 5tuple WHERE tout == infinity
3
Key Value Key Value On-Chip Cache (SRAM) Off-chip Backing store (DRAM) key Merge Update / Initialize evicted key
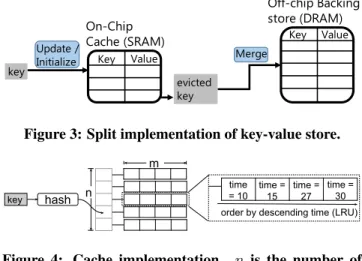
Figure 3: Split implementation of key-value store.
key hash n
m
order by descending time (LRU) time = 10 time = 15 time = 27 time = 30
Figure 4: Cache implementation. n is the number of hash-table buckets. Each bucket is anm-slot LRU.
R3 = SELECT R2.COUNT/R1.COUNT FROM R1 JOIN R2 ON 5tuple
The JOINs permitted in the language can be represented by a more complex aggregation function with a GROUPBY
clause; hence,JOINs are included only for convenience. The restriction on JOINs is driven by the queries we currently know to be correctly and efficiently compilable,i.e., through
GROUPBY. While some JOINs, e.g., T JOIN T ON pkt_5tuple
are inherently expensive because of the result size (i.e.,
(O(#pkts2))), others may produce much smaller results but
are still inexpressible in the current language. Relaxing this restriction is part of planned future work.
Composing queries. Queries can be nested because they have the same input and output types, enabling operators to pose complex questions about performance. For example, one query can be written to compute total queueing latency for each packet, and the results can be aggregated to deter-mine which transport 5-tuple flows experiencedend-to-end packet latencies higher than a thresholdL. In the query be-low, we assume thatpkt_uniqis a tuple of packet fields that includes the5tuple, and determines each packet uniquely.
def sum_lat(lat, (tin, tout)): lat = lat + tout - tin R1 = SELECT pkt_uniq, sum_lat GROUPBY pkt_uniq
R2 = SELECT 5tuple FROM R1 GROUPBY 5tuple WHERE lat > L
In Fig. 2, we list performance queries for many monitoring tasks useful to operators, such as measuring per-flow coun-ters, identifying connections with high average queueing la-tency, measuring the prevalence of TCP reordering, and lo-cating queues with persistently high lengths. We expect both the language syntax and the examples to evolve.
3.
HARDWARE DESIGN
We now describe a hardware design that realizes perfor-mance queries. Our design targets switch pipelines that run at a clock frequency of 1 GHz and hence process a new packet every 1 ns. This architecture is typical of many mod-ern switches [17]. We begin by describing language con-structs that can be realized using emerging programmable
switches (§3.1). Then, we describe a novel programmable key-value store to efficiently implementGROUPBYs (§3.2). We have not prototyped our key-value store in silicon or tested it in cycle-accurate simulations. Hence, we discuss its feasi-bility and area costs using back-of-the-envelope calculations (§3.3).
3.1
Using emerging programmable switches
Many language constructs can be realized using emerging programmable switches. For instance, performance-related fields such as the enqueue and dequeue timestamps are provided by metadata available on programmable switches. These are already leveraged by applications like In-band Network Telemetry [6]. The set of packet headers in the schema—including standard headers, metadata and user-defined ones—can be parsed by a programmable switch parser [20]. The SELECT ... WHERE clause can be realized using a programmable match-action switch pipeline [17] that allows matches and actions on all parsable headers; on such pipelines, we can implement theWHEREpredicate as the match condition.3.2
A programmable key-value store
We next look atGROUPBYs because our restrictedJOINs can be reduced toGROUPBYs (§2). TheGROUPBYclause aggregates information across sets of packets using an aggregation field (e.g., 5-tuples). We propose to implement the aggregation through a programmable key-value store. The key stores a programmable aggregation field. The value stores state ag-gregated across packets belonging to the same key, and is programmatically updated. As an example, the key could be a 5-tuple, while the value could store the updated current byte count for the 5-tuple.
This key-value store has two requirements: (1) it should run at the 1 GHz packet rate of the switch pipeline (accessing memory every 1 ns); (2) it should scale to a large number of keys to support a long-running query system where the number of flows increases over time. This is challenging: fast memories like SRAM scale only to a few Mbits, while large memories like DRAM have large access times.
Hence, we propose a split implementation (Figure 3) for our key-value store, similar to processor memory hierarchies and hardware designs for switch counters [35] and packet buffers [25]. A fast cache resides in SRAM within the switching chip’s match-action pipeline and supports one ini-tializeoperation (for a key’s first packet) or oneupdate oper-ation (for subsequent packets) to a single key in the key-value store every clock cycle (1 ns). This cache stores frequently accessed key-value pairs. The cache is backed by a slower and larger key-value store maintained in a backing store in off-chip DRAM,e.g.,the switch CPU’s memory, or a scale-out key-value store scale-outside the switch.
Currently, we use the least recently used (LRU) cache-eviction policy. Implementing a full LRU across all cache entries is challenging in hardware. Hence, similar to proces-sor caches, we layout our cache as a hash table ofnbuckets
with LRU being enforced within themslots in each bucket when that bucket fills up (Figure 4).
When a key is evicted, the key and its value are erased entirely: a subsequent packet from the evicted key is treated as a packet from a new key by the cache. In general, this complete erasure could yield incorrect results for arbitrary fold functions. However, in many cases, we can ensure the correctness of the value in the backing store bymergingthe new value from the cache into an existing value for the same key in the backing store. We describe thismergeoperation next and characterize the condition on the update operation that is required for the merging to work correctly.
The merge operation.When a key is evicted from the cache, we need a procedure tomergethe value of the evicted key with its previous value in the backing store. To illustrate this, consider aGROUPBY clause that tracks an exponentially weighted moving average (EWMA) across packet latencies belonging to a flow. Here the state update operation for any key is
S= (1−α)·S+α·(tout−tin)
Suppose that at some point after an eviction, the EWMA state for a key in the backing store issd. A subsequent packet from that key is processed like a packet from a new key in the cache, starting from an initial states0. Assume thatN
packets are processed by the key-value store in the cache fol-lowing an eviction, resulting in the state being updated from
s0tosnew. Then, the correct state valuescorrectsatisfies:
scorrect=snew+ (1−α)N(sd−s0)
Hence, the correct EWMA value can be obtained by adding
(1−α)N(s
d−s0)tosnewwhen mergingsnewwithsd.
The linear-in-state condition. We can generalize the EWMA example to show that the same merge technique ap-plies to any state update operation that islinear in state. For-mally, supposeS is a vector representing the current state. The state updateS = A·S+B is linear in state if A and B are both functions of the current packet alone and do not depend on S.4For the EWMA example above, A and B are 1−αandα·(tout−tin), respectively.
The linear-in-state condition allows us to update the cur-rent value of the key in the backing store without sacrificing correctness. However, the correct value at any time only re-sides in the backing store and cannot be read from the cache. This is not a severe restriction: keys can be periodically evicted to ensure the backing store is fresh, and monitoring applications can pull results from the backing store.
Operations that are not linear in state.While the linear-in-state condition is sufficient for many examples (§2), some examples violate it, e.g., “TCP non-monotonic” in Fig. 2. Here we count the number of packets with a sequence num-ber greater than the maximum seen so far for a flow. This ex-ample is not linear in state because the update tonm_count
de-4
A and B can also be functions of a constant number of packets preceding and including the current packet.
pends on the maximum sequence number (through the pred-icatemaxseq > tcpseq), which is itself a state variable.
For this example, no merge function guarantees that the correct value is always available in the backing store. In such cases, we evict keys as we do for queries satisfying the linear-in-state condition, but do not merge them with previ-ous versions. In the backing store, we maintain a list of val-ues for this key; each item in the list tracks the key’s value between two evictions. If a key ends up with multiple values associated with it, we mark it invalid because a single correct value cannot be inferred. Section 4 shows that the fraction of invalid keys is low for typical packet traces. Note that such invalid keys may still be usable since each value in the list is correct over a specific time interval.
3.3
Hardware feasibility
The core operations in our key-value store that run at line rate are looking up a key, evicting a key, and updating a key’s value. Key lookups are well understood in the context of flow counter tables used by NetFlow [28, 3]. The LRU cache evic-tion logic is found in many CPU L1 caches today that support access latencies comparable to our cache [8]. Finally, updat-ing a key’s value amounts to updatupdat-ing a state variable within one clock cycle. For the linear-in-state operations, this up-date is of the formS∗A+B, which is similar to the fused multiply-add operation in processors today [9]. For the other operations, the problem of updating a state variable within a single clock cycle is tackled by Domino [36], which pro-poses many small combinational circuits to update state.
The bulk of the area in our key-value store is taken up by the SRAM storing the keys and values. The digital logic (e.g.,for the LRU eviction policy, for the linear-in-state and other updates, and for the hash functions for key lookups) in-curs little additional area relative to the SRAM. Hence, when evaluating our design in §4, we ignore logic area and only account for the memory area of the key-value store.
4.
EVALUATION OF HARDWARE DESIGN
We now evaluate our hardware design. Specifically, 1. What is a reasonable on-chip cache memory size? 2. What throughput should the backing store support? 3. What is the accuracy for queries not linear in state?
Setup. We simulate the query SELECT COUNT GROUPBY
5tuple on our split hardware design, over a 5 minute
CAIDA Internet traffic trace from April 2016, containing 157M packets at a 10 Gbit/s link speed [14]. The aggrega-tion key (5-tuple) requires 104 bits, and we assume a 24-bit counter value, which totals 128 bits per key-value pair.
We tested 3 LRU geometries (Figure 4).
1. Thehash table(m=1) evicts a key on hash collisions. 2. Thefully associativecache (n=1) is a full LRU. 3. The8-way associativecache (m=8) is an 8-way LRU
similar to many processor L1 caches [8].
Based on a study of datacenter traffic [16], we pick an av-erage packet size of 850 bytes and a network utilization of
30%. Under these typical conditions, a switch processing a billion 64-byte packets per second (1 GHz) will process 22.6M average-sized packets per second.
Cache memory size. SRAM densities are now around
7000Kb/mm2 [13]. The smallest switching chips occupy
200mm2[20]. Relative to these chips, a 32-Mbit cache in
SRAM costs under 2.5% additional area, which we believe is reasonable. Thus, we target a cache size of 32 Mbits, and test a range of cache capacities around this target, from 8 Mbits (216pairs) to 256 Mbits (221pairs).
The split design is crucial: the backing store can not sus-tain line rate, and storing all keys in the on-chip cache is infeasible. For instance, our 5 minute trace has around 3.8M unique 5-tuples; if stored on-chip, we would need a 486-Mbit cache for a prohibitive 38% chip area overhead. To make matters worse, in an always-on system, the number of unique 5-tuples will increase with time.
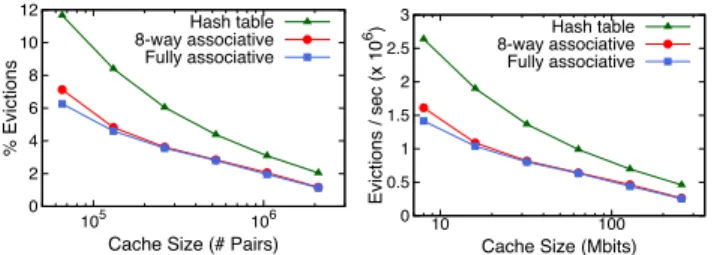
Eviction Rate. Keys evicted from the SRAM cache must be persisted in the backing store, which requires the backing store to process keys at the eviction rate. Figure 5 shows the average eviction rate over a range of cache capacities, reported in two ways: (i) as a fraction of total packets seen, which is independent of the switch’s line rate, and (ii) as a write rate to the backing store, which assumes the typical workload conditions and query described above.
0 2 4 6 8 10 12 105 106 % Evictions
Cache Size (# Pairs)
Hash table 8-way associative Fully associative 0 0.5 1 1.5 2 2.5 3 10 100 Evictions / sec (x 10 6)
Cache Size (Mbits)
Hash table 8-way associative Fully associative
Figure 5: Eviction rates for a range of cache sizes. The results provide two insights. First, even though a fully associative cache provides the lowest eviction rates, using just an 8-way associative cache comes within 2% of this op-timum. Second, the eviction rate of the 8-way associative cache at the target SRAM size of 32 Mbits is 3.55%. For the typical datacenter workload described above, the abso-lute eviction rate is 802K writes per second. This is within the capabilities of scale-out key-value stores that support a few hundred thousand requests per second per core [5, 24, 10, 1].
Accuracy for queries that are not linear-in-state. For queries that do not satisfy the linear-in-state condition, we mark keys evicted multiple times to the backing store as invalid. However, these invalid keys are still valid over a shorter time interval (until they reappear in the cache after their first eviction). Thus, if we quantify the result’s accu-racy as the percent of valid keys over the time window dur-ing which the query was run, the accuracy is higher if we run the query over a shorter time interval. Figure 6 shows
40 50 60 70 80 90 100 10 100 Accuracy (%)
Cache Size (Mbits) 1 min 3 min 5 min
Figure 6: Accuracy for a query not linear-in-state.
this accuracy-time tradeoff for 8-way associative caches of varying size. As an example, for a 32-Mbit cache, running the query over 1-min (instead of 5-min) intervals increases accuracy from 74% to 84%.
5.
RELATED WORK
Prior switch-based network measurement systems [18, 19, 32, 23, 40, 22] are constrained by their raw data, sourced from limited measurement support in existing switches,e.g., NetFlow, match-action rules, and packet mirroring. More recently, Guptaet al. [22] propose to partition monitoring queries between switches and a stream processor (e.g.,Spark streaming [12]), iteratively refining the set of packets cap-tured through match-action rules in the switch. In contrast, by designing new switch primitives, we enable operators to answer a more diverse set of performance questions.
Endpoint-based solutions [21, 31] do not allow an operator to directly localize problems deep inside the network. For instance, using TPP/INT [26, 6], it is hard to track which applications contribute to TCP incast at a particular queue, because the data needed to answer this question is scattered over multiple endpoints. Further, the fate of measurement is tied to the fate of packets: if packets are dropped, telemetry information is lost, leading to inaccurate diagnoses.
Sketch-based systems [39, 29, 28, 30] track flow-level counters. However, performance queries allow operators to ask questions much broader than per-flow counters (Fig. 2). Further, our hardware design scales to a large number of keys, sidestepping the accuracy-memory tradeoff of sketches for the broad class of queries that are linear-in-state.
Concurrently with our work, Nelsonet al.[33] make the case for new switch features to check stateful invariants for network protocols. We designed our programmable key-value store for performance monitoring, but it can be used to implement some of these checks in the data plane as well.
6.
CONCLUSION
This paper suggests that co-designing declarative perfor-mance queries along with their associated hardware primi-tives can bring the benefits of programmability to high-speed network performance measurement. We are further study-ing the expressiveness of our query language, designstudy-ing a query compiler, and carrying out a detailed investigation of our hardware design.
Acknowledgments. We are grateful to the anonymous Hot-Nets reviewers, Hari Balakrishnan, Mina Tahmasbi, and Vibhaalakshmi Sivaraman for their thoughtful feedback on this paper. This work was funded in part by NSF grants CNS-1563826, CNS-1617702, CNS-1526791, and AiTF-1535948; DARPA grant HR0011-15-2-0047; and a gift from Cisco. We also thank the industrial members of the MIT Center for Wireless Networks and Mobile Computing (Wire-less@MIT) for their support.
7.
REFERENCES
[1] An Update on the Memcached/Redis Benchmark. http://oldblog. antirez.com/post/update-on-memcached-redis-benchmark.html. [2] Barefoot: The World’s Fastest and Most Programmable Networks.
https://barefootnetworks.com/media/white_papers/
Barefoot-Worlds-Fastest-Most-Programmable-Networks.pdf. [3] Cisco IOS NetFlow. http://www.cisco.com/c/en/us/products/
ios-nx-os-software/ios-netflow/index.html.
[4] High Capacity StrataXGSRTrident II Ethernet Switch Series. http://www.broadcom.com/products/Switching/Data-Center/ BCM56850-Series.
[5] How Fast is Redis? http://redis.io/topics/benchmarks. [6] In-band Network Telemetry.
https://github.com/p4lang/p4factory/tree/master/apps/int.
[7] Intel FlexPipe. http://www.intel.com/content/dam/www/public/us/en/ documents/product-briefs/ethernet-switch-fm6000-series-brief.pdf. [8] Intel64 and IA-32 Architectures Optimization Reference Manual.
http://www.intel.com/content/dam/www/public/us/en/documents/ manuals/64-ia-32-architectures-optimization-manual.pdf. [9] Intrinsics for Fused Multiply Add Operations | Intel Software.
https://software.intel.com/en-us/node/513979. [10] Redis VS Memcached.
http://dormando.livejournal.com/525147.html. [11] sFlow. https://en.wikipedia.org/wiki/SFlow. [12] Spark Streaming. http://spark.apache.org/streaming/. [13] SRAM - ARM. https://www.arm.com/products/physical-ip/
embedded-memory-ip/sram.php.
[14] The CAIDA UCSD Anonymized Internet Traces 2016 - April. http://www.caida.org/data/passive/passive_2016_dataset.xml. [15] XPliantTMEthernet Switch Product Family. http:
//www.cavium.com/XPliant-Ethernet-Switch-Product-Family.html. [16] T. Benson, A. Anand, A. Akella, and M. Zhang. Understanding Data
Center Traffic Characteristics.SIGCOMM Computer Communication Review, Jan. 2010.
[17] P. Bosshart, G. Gibb, H.-S. Kim, G. Varghese, N. McKeown, M. Izzard, F. Mujica, and M. Horowitz. Forwarding Metamorphosis: Fast Programmable Match-Action Processing in Hardware for SDN. InSIGCOMM, 2013.
[18] C. Cranor, T. Johnson, O. Spataschek, and V. Shkapenyuk. Gigascope: A Stream Database for Network Applications. In
SIGMOD, 2003.
[19] N. Foster, R. Harrison, M. J. Freedman, C. Monsanto, J. Rexford, A. Story, and D. Walker. Frenetic: A Network Programming Language. InICFP, 2011.
[20] G. Gibb, G. Varghese, M. Horowitz, and N. McKeown. Design Principles for Packet Parsers. InANCS, 2013.
[21] C. Guo, L. Yuan, D. Xiang, Y. Dang, R. Huang, D. Maltz, Z. Liu, V. Wang, B. Pang, H. Chen, Z.-W. Lin, and V. Kurien. Pingmesh: A Large-Scale System for Data Center Network Latency Measurement and Analysis. InSIGCOMM, 2015.
[22] A. Gupta, R. Birkner, M. Canini, N. Feamster, C. Mac-Stoker, and W. Willinger. Network Monitoring is a Streaming Analytics Problem. InHOTNETS, 2016.
[23] N. Handigol, B. Heller, V. Jeyakumar, D. Mazières, and
N. McKeown. I Know What Your Packet Did Last Hop: Using Packet Histories to Troubleshoot Networks. InNSDI, 2014.
[24] S. Hart, E. Frachtenberg, and M. Berezecki. Predicting Memcached Throughput Using Simulation and Modeling. InSymposium on Theory of Modeling and Simulation, 2012.
[25] S. Iyer, R. R. Kompella, and N. McKeown. Designing Packet Buffers for Router Linecards.IEEE/ACM Transactions on Networking, 2008. [26] V. Jeyakumar, M. Alizadeh, Y. Geng, C. Kim, and D. Mazières.
Millions of Little Minions: Using Packets for Low Latency Network Programming and Visibility. InSIGCOMM, 2014.
[27] S. P. Jones and P. Wadler. Comprehensive Comprehensions. In
Proceedings of the ACM SIGPLAN Workshop on Haskell Workshop, Haskell ’07, pages 61–72, New York, NY, USA, 2007. ACM. [28] Y. Li, R. Miao, C. Kim, and M. Yu. FlowRadar: A Better NetFlow for
Data Centers. InNSDI, 2016.
[29] Z. Liu, A. Manousis, G. Vorsanger, V. Sekar, and V. Braverman. One Sketch to Rule Them All: Rethinking Network Flow Monitoring with UnivMon. InSIGCOMM, 2016.
[30] Y. Lu, A. Montanari, B. Prabhakar, S. Dharmapurikar, and A. Kabbani. Counter Braids: A Novel Counter Architecture for Per-Flow Measurement. InSIGMETRICS, 2008.
[31] M. Moshref, M. Yu, R. Govindan, and A. Vahdat. Trumpet: Timely and Precise Triggers in Data Centers. InSIGCOMM, 2016. [32] S. Narayana, M. Tahmasbi, J. Rexford, and D. Walker. Compiling
Path Queries. InNSDI, 2016.
[33] T. Nelson, N. DeMarinis, R. Fonseca, and S. Krishnamurthi. Switches are Monitors too: Stateful Property Monitoring as a Switch Design Criterion. InHOTNETS, 2016.
[34] Oracle. [Online. Retrieved July 12, 2016]
http://docs.oracle.com/middleware/12211/osa/cql-reference/toc.htm. [35] D. Shah, S. Iyer, B. Prahhakar, and N. McKeown. Maintaining
Statistics Counters in Router Line Cards.IEEE Micro, 2002. [36] A. Sivaraman, A. Cheung, M. Budiu, C. Kim, M. Alizadeh,
H. Balakrishnan, G. Varghese, N. McKeown, and S. Licking. Packet Transactions: High-Level Programming for Line-Rate Switches. In
SIGCOMM, 2016.
[37] SQLStream Inc. [Online. Retrieved July 12, 2016] http://www.sqlstream.com/stream-processing-with-sql/.
[38] V. Vasudevan, A. Phanishayee, H. Shah, E. Krevat, D. G. Andersen, G. R. Ganger, G. A. Gibson, and B. Mueller. Safe and Effective Fine-Grained TCP Retransmissions for Datacenter Communication. InSIGCOMM, 2009.
[39] M. Yu, L. Jose, and R. Miao. Software Defined Traffic Measurement with OpenSketch. InNSDI, 2013.
[40] Y. Zhu, N. Kang, J. Cao, A. Greenberg, G. Lu, R. Mahajan, D. Maltz, L. Yuan, M. Zhang, B. Y. Zhao, and H. Zheng. Packet-Level Telemetry in Large Datacenter Networks. InSIGCOMM, 2015.