SHORT COMMUNICATION
†To whom correspondence should be addressed.
E-mail: [email protected]
Kinetics of volume expansion during infusion of Ringer’s solution
based on two volume model
Kyu Taek Choi, Eun Ho Lee* and Yeong Koo Yeo*,†
Dept. of Anesthesiology and Pain Medicine, Asan Medical Center, University of Ulsan, Seoul 138-736, Korea *Dept. of Chemical Engineering, Hanyang University, Seoul 133-791, Korea
(Received 2 January 2006 • accepted 12 June 2006)
Abstract−In this work mathematical models were developed to represent the kinetics of volume changes of fluid spaces associated with infusion of Ringer’s solution. During infusion of Ringer’s solution, the human body is assumed to be characterized by the two-fluid space model which has second volume space in addition to the first volume so that fluid exchanges between these two spaces are possible. Various infusion types were tested to accommodate dif-ferent medical situations. Volunteers were given Ringer’s solution and the changes in blood hemoglobin were detected. From the comparison with experimental data, the two-fluid space model was found to represent adequately the kinetics of human volume expansion during infusion of Ringer’s solution.
Key words: Volume Expansion, Ringer’s Solution, Two-fluid Space, Parameter Estimation, Blood Hemoglobin INTRODUCTION
Ringer’s solution is an electrolyte solution similar to blood plas-ma. It is usually used to supply water and electrolyte during physi-cal operation or when the human body is in the dehydration state. Ringer’s solution consists of 130 milli-equivalent/liter of Na+, 4
milli-equivalent/liter of K+, 3 milli-equivalent/liter of Ca++, 109
milli-equiv-alent/liter of Cl− and 28 milli-equivalent/liter of lactate.
Infusion of Ringer’s solution (or Hartman’s solution) is an im-portant part of patient care in surgery or trauma care. It is well known that the amount of Ringer’s solution needed to restore normal blood volumes is thought to be three to five times the volume of blood lost. The fluid molecules infused within the human body have been assumed to be distributed within a fluid space of constant volume. But it is obvious that volumes of fluid spaces change when a con-siderable amount of fluid is added or removed from the body. The volume expansion effect of the administered fluid is believed to be the therapeutic goal. However, this volume effect is difficult to study. Major differences in volume expansion between infusion fluids are fairly well known, but there is a lack of methods that represent their dynamic properties [Dorbin and Hahn, 2002]. A water molecule entering the fluid space consisting of one expandable portion and one rigid portion can be found anywhere and therefore has a volume of distribution, being the sum of the two portions of the entire fluid space. But only the expandable portion of the fluid space is influ-enced by added water molecules. The volume effect of Ringer’s solution has a time course that determines the optimal rate of infu-sion for the fluid. The blood volume is expanded most during and just after the infusion, but the expansion becomes less pronounced with time.
Recently, simple single and two fluid space volume models have been proposed and tested experimentally [Stahle et al., 1997; Drobin et al., 1999; Sjostrand et al., 2001]. Stahle et al. [1997] proposed
elementary mathematical models to represent the changes in vol-ume of fluid spaces associated with intravenous administration of a crystalloid solution. They employed experimental results to esti-mated model parameters but failed to show the effectiveness of the proposed models upon which our study is based. Svensen and Hahn [1997] analyzed volume kinetics of Ringer’s solution, Dextran 70 and Hypertonic saline in male volunteers. They confirmed that the distribution of intravenous fluids can be analyzed by a kinetic model adapted for fluid spaces even with slightly different results depend-ing on the marker used to indicate dilution of the primary fluid space. Volume kinetics of glucose solutions given by intravenous infusion were also analyzed by Sjostrand et al. [2001].
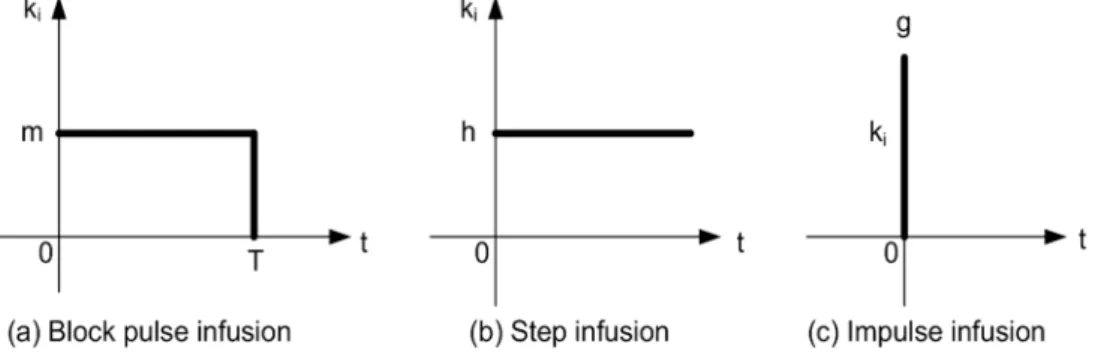
In all the volume expansion models proposed so far the infusion was assumed to be represented as a block pulse. But, in some cri-tical situations such as emergent surgery, infusion of Ringer’s solu-tion can be represented as a step or an impulse funcsolu-tion. The purpose of the present study is to develop a clear description of volume ex-pansion caused by various types of infusion of Ringer’s solution. In this study, we have worked with kinetic models that allow var-ious types of infusion and can be applicable during and after vol-ume loading.
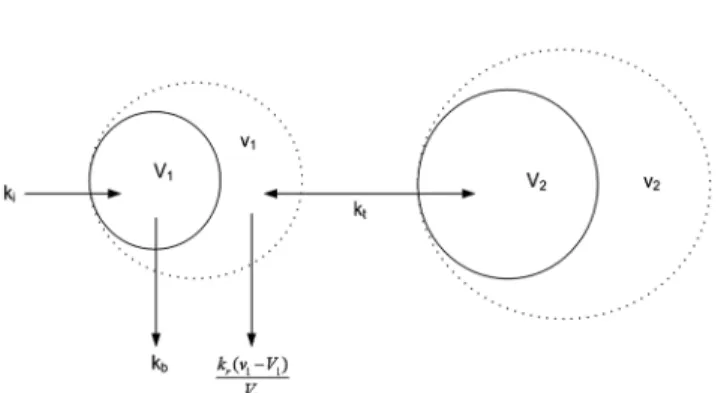
TWO-FLUID SPACE MODEL
effluence of fluid from the fluid space by perspiration, basal diure-sis and controlled efflux and due to the fluid exchange with the
sec-ondary fluid space. v2 is time dependent due to the fluid exchange
with the primary fluid space. The rate of fluid change between the two fluid spaces is assumed to be proportional to the difference in relative deviations from the target volumes with the proportional constant of kt. The combined rate of fluid effluence from v1 due to
perspiration and diuresis is represented as kb. It is assumed that
con-trolled efflux is proportional to the relative deviation of v1 from the
target volume V1 with the proportional constant kr. The behavior
of the expandable volumes can be represented by the following dif-ferential equations.
(1) (2)
v1(0)=V1, v2(0)=V2 (3)
We assume that V1, V2, kt and kr are constant. As in the single-fluid
space model, parameters kb and ki are considered to be known. We
now consider three typical types as shown in Fig.2: block pulse, step and impulse. Solutions of Eqs. (1) and (2) for these infusion
Ringer’s lactate solution was given to six healthy volunteers (four males and two females). The ages and weights of volunteers are within the range of 28-34 years and 48-80kg, respectively. The infu-sion experiments were approved by the Ethics Committee of Asan medical center in Seoul, Korea and each volunteer gave informed consent. Twelve hours before the experimental procedure, food and water were discontinued. Volunteers were placed comfortably on beds, and 20minutes of equilibration was allowed before the fluid administration. Cannulae were placed into the antecubital vein and the radial artery. Ringers’ lactate solution (Choong wae, Seoul, Korea),
electrolyte contents of which were 130mmol/l of Na, 4mmol/l of
K, 2mmol/l of Ca, 1mmol/l of Mg, 24mmol/l of lactate 24 and
110mmol/l of Cl. The Ringer’s solution was infused into a vein at a
constant rate of 15ml/kg over 30min with the aid of infusion pumps (IVAC 560, San Diego).
Samples (1ml each) for measurement of blood hemoglobin con-centration were obtained from the radial arterial cannula at 0, 5, 10, 15, 20, 25, 30, 45, 60, 80, 100 and 120minutes after administra-tion. After a blood sample is drawn, 3ml of Ringer’s solution is injected to flush the cannula and one 2-ml sample to be discarded is drawn before each blood sampling to avoid undue hemodilution caused by this fluid. Before infusion of the fluid, one sample is drawn
dv1 dt ---=ki−kb−kr(vV1−V1) 1 ---−kt v1−VV1 1 ---−v2−V2 V2 ---⎝ ⎠ ⎛ ⎞ dv2 dt ---=kt v1V−V1 1 ---−v2−V2 V2 ---⎝ ⎠ ⎛ ⎞
Fig. 2. Three types of infusion.
Table 1. Data for numerical simulations
Infusion type T (min) kb (ml/min) ki (ml/min) kr (ml/min) kt (ml/min) V1 (liter) V2 (liter)
Block pulse 30 2.5 50 100 200 4 8
Step - 2.5 50 100 200 4 8
in duplicate and the mean value is used in the calculations. It takes 4hours to perform whole procedures on a volunteer. Basic apparatus required in experiments are Hartman’s solution (1 liter), 4 infusion pumps, a pressure bag, an arterial pressure kit, an ear tem-perature probe and a syringe (2ml). Blood sampling: through 3-way route connected to pressure bag, discard the first 1ml, take the next 1ml of blood as a sample and flush with 2-ml Hartman’s solution connected to the pressure bag.
Fig.4 shows a snapshot of experiments. Tables2 and 3 show ex-perimental data represented as fractional dilutions obtained from
infusion experiments for male and female volunteers, respectively.
ESTIMATION OF MODEL PARAMETERS
For the block pulse infusion, in which duration time is T and kb=
b=constant, the volume change characteristics are given in the Ap-pendix. The experimental data in Table2 exhibits characteristics of the first volume. Thus we can estimate parameters kr, kt, V1, V2 for
the two volume model as follows:
: 0≤t<T (4) f=u1( )t −K A( 1+B1er1t+C1er2t) f=u1( )t + KAm 1b −b ---⎝ ⎠ ⎛ ⎞−KB1er1t 1 − mm −b ---⎝ ⎠ ⎛ ⎞e−r1T ⎩ ⎭ ⎨ ⎬ ⎧ ⎫
Fig. 3. Results of simulations for various infusion types ((a) block pulse infusion, (b) step infusion, (c) impulse infusion).
Fig. 4. Infusion dynamics experiment.
Table 2. Results of block pulse infusion experiments for male
vol-unteers (T=30 min, kb=1.94 ml/min)
Time (min) pch ID (Male volunteers)lyj pcw Ljy Average
00 0.000 0.000 0.000 0.000 0.000 05 0.073 0.012 0.076 0.017 0.045 10 0.117 0.041 0.045 0.034 0.059 15 0.133 0.028 0.055 0.052 0.067 20 0.078 0.024 0.050 0.064 0.054 25 0.122 0.050 0.110 0.079 0.090 30 0.087 0.078 0.087 0.064 0.079 45 0.107 0.104 0.050 0.045 0.076 60 0.069 0.050 0.026 0.027 0.043 80 0.056 0.059 0.013 0.041 0.042 1000 0.060 0.024 0.017 0.027 0.032 1200 0.056 0.008 0.036 0.038 0.034 Parameters Weight (kg) 072 076 080 068 074 Urine (ml)* 750 400 600 190 485 kb (ml/min) 1.94 1.94 1.94 001.94 1.94 T (min) 030 030 030 030 030 ki (ml/min) 036 038 040 034 037
: T≤t (5)
Values of parameters that minimize the objective function f can easily be found as in the single-fluid model case. Table4 shows results of estimation for the two-volume model.
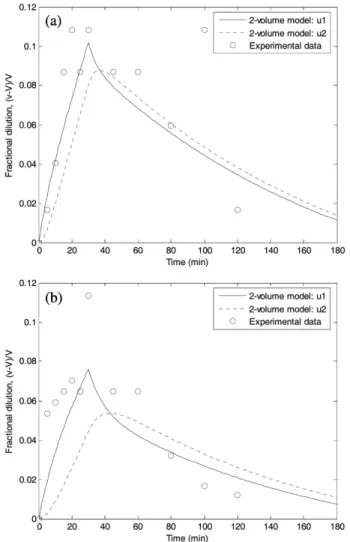
In order to validate the two-volume model, the estimated param-eters were plugged into the model and results of computations were compared with experimental data. Fig.5 shows results of compari-son between experimental values of fractional dilutions and com-putational results of models based on the estimated parameters for three male volunteers, and Fig.6 shows those for two female volun-teers. Characteristics of males and females may be more distinguish-able if we compare average values for males and females. Fig.7 shows results of comparison between average experimental frac-tional dilutions and computafrac-tional results of models based on the estimated parameters using average experimental values.
CONCLUSIONS
Characteristics of the volume expansion effect during infusion of Ringer’s solution were analyzed by using the two-fluid space model. During infusion of Ringer’s solution, the human body is as-sumed to be characterized by the two-fluid space model into which fluid is fed and from which fluid leaves. The two-fluid space model has secondary volume space in addition to the first volume so that fluid exchanges between these two spaces are possible. Various
infu-−KC1er2t 1− mm −b ---⎝ ⎠ ⎛ ⎞e−r2T ⎩ ⎭ ⎨ ⎬ ⎧ ⎫ 80 0.060 0.032 0.046 100 0.108 0.017 0.063 120 0.017 0.012 0.014 Parameters Weight (kg) 045 057 051 Urine (ml)* 280 200 240 kb (ml/min) 1.51 1.51 1.51 T (min) 030 030 030 ki (ml/min) 022.5 028.50 025.5
*: Amount of urine collected after 120 minutes of infusion.
Table 4. Results of estimation (two-volume model)
Volunteers kr (ml/min) (ml/min)kt (ml)V1 (ml)V2 Male pch 045.5 399.2 1,358.6 06,212.5 lyj 126.0 067.0 7,745.0 10,079.0 pcw 173.9 085.2 6,900.4 08,474.5 ljy 064.0 286.0 6,654.0 12,973.0 Average 098.1 305.7 6,493.5 03,651.2 Female swj 038.8 309.1 3,692.8 02,338.7 ymo 086.2 301.9 6,182.7 05,107.4 Average 077.2 620.8 2,888.2 02,466.5
Fig. 5. Comparison between experimental values of fractional dilu-tions (Male volunteers: (a) pch, (b) lyj, (c) pcw).
sion types were tested to accommodate different medical situations. Volunteers were given Ringer’s solution and the changes in blood hemoglobin were detected. From the comparison with experimen-tal data, the two-fluid space model was found to represent ade-quately the kinetics of human volume expansion during infusion of Ringer’s solution.
APPENDIX
We now introduce and Then we have
u1(0)=u2(0)=0, dv1=V1du1, dv2=V2du2. Eqs. (3) and (4) can be rewritten as
At steady-state we can see that From the
La-place transform of above relations, we have after some rearrange-ment
(6)
where
Case I: kb=b=constant and ki=block pulse with magnitude of m
and duration time T. This type of infusion can be represented as Fig.2(a). Substitution of ki(s) and kb(s) into Eq. (6) gives after some
rearrangement u1=v1V−V1 1 --- u2=v2V−V2 2 ---. V1 kr+kt ---⎝ ⎠ ⎛ ⎞du1 dt ---=k1 r+kt --- k( i−kb)−u1+kkt r+kt ---u2 V2 kt ---⎝ ⎠ ⎛ ⎞du2 dt ---=u1−u2 u1s=u2s=kis−kkbs r ---=0. U1( )s = k (τ2s+1) r+kt ( ) τ( 1s+1) τ( 2s+1)−kt --- k{ i( )s −kb( )s} U2( )s = 1 τ2s+1 ---U1( )s = k {ki( )s −kb( )s } r+kt ( ) τ( 1s+1) τ( 2s+1)−kt ---τ1=kV1 r+kt ---, τ2=Vk2 t ---U1( )s = m−b τ1τ2(kr+kt) ---τ2s+1 ( ) 1− mm −b ---⎝ ⎠ ⎛ ⎞e−Ts ⎩ ⎭ ⎨ ⎬ ⎧ ⎫ s s2+ τ1+τ2 τ1τ2 ---⎝ ⎠ ⎛ ⎞s+ 1 τ1τ2 --- 1− kt kr+kt ---⎝ ⎠ ⎛ ⎞ ⎩ ⎭ ⎨ ⎬ ⎧ ⎫ ---⋅ = m−b τ1τ2(kr+kt) --- A1 s---+s---B−1r1+ C1 s−r2 ---⎝ ⎠ ⎛ ⎞ 1− m m−b ---⎝ ⎠ ⎛ ⎞e−Ts ⎩ ⎭ ⎨ ⎬ ⎧ ⎫
Fig. 6.Comparison between experimental values of fractional
From the inverse Laplace transformation we have (7) or : 0≤t<T : T≤t Where
Similarly, from the inverse Laplace transformation of U2(s) gives
(8)
or
: 0≤t<T
: T≤t
Case II: kb=b=constant and ki=step with magnitude of h. This type
of infusion can be depicted as Fig.2(b). Substitution of ki(s) and
kb(s) into Eq. (6) gives after some rearrangement
and kb(s) into Eq. (6) gives after some rearrangement
where
From the inverse Laplace transformation of U1(s) and U2(s) we have
(11) (12)
where
NOMENCLATURE
A-, Bi, Ci: parameters [-]
b : magnitude of base diuresis [ml/min]
g : magnitude of impulse infusion [ml/min]
h : magnitude of block infusion [ml/min]
K, K1: gain [-]
kb : base diuresis rate [ml/min]
kr : proportional constant for single fluid model [ml/min]
kt : proportional constant for two fluid model [ml/min]
m : magnitude of block infusion [ml/min] r1, r2 : constants [-]
t : time [min]
T, T1, T2 : infusion duration time [min]
u, u1, u2: relative deviation from the target volume [-]
U, U1, U2: relative deviation from the target volume [-]
us : unit step function [-]
A2=A1=r 1r2 ---, B2=r 1(r1−r2) ---, C2=r 2(r2−r1) ---U1( )t =u1( )t =K A( 1+B1er1t+C1er2t) −K mm −b ---⎝ ⎠ ⎛ ⎞ A1+B1er1(t−T)+C 1er2(t−T) { }us(t−T) u1( )t =K A( 1+B1er1t+C1er2t) u1( )t =− KAm 1b −b ---⎝ ⎠ ⎛ ⎞+KB1er1t 1− m m−b ---⎝ ⎠ ⎛ ⎞e−r1T ⎩ ⎭ ⎨ ⎬ ⎧ ⎫ +KC1er2t 1− mm −b ---⎝ ⎠ ⎛ ⎞e−r2T ⎩ ⎭ ⎨ ⎬ ⎧ ⎫ K= m−b τ1τ2(kr+kt) ---=kt(m−b) V1V2 ---U2( )t =u2( )t =K A( 2+B2er1t+C2er2t) −K mm −b ---⎝ ⎠ ⎛ ⎞ A2+B2er1(t−T)+C 2er2(t−T) { }us(t−T) u2( )t =K A( 2+B2er1t+C2er2t) u2( )t =− KAm 2b −b ---⎝ ⎠ ⎛ ⎞+KB2er1t 1 − mm −b ---⎝ ⎠ ⎛ ⎞e−r1T ⎩ ⎭ ⎨ ⎬ ⎧ ⎫ +KC2er2t 1− mm −b ---⎝ ⎠ ⎛ ⎞e−r2T ⎩ ⎭ ⎨ ⎬ ⎧ ⎫ U1( )s = h−b τ1τ2(kr+kt) --- (τ2s+1) s s2+ τ1+τ2 τ1τ2 ---⎝ ⎠ ⎛ ⎞s+ 1 τ1τ2 --- 1− kt kr+kt ---⎝ ⎠ ⎛ ⎞ ⎩ ⎭ ⎨ ⎬ ⎧ ⎫ ---⋅ = h−b τ1τ2(kr+kt) --- A1 s---+s---B−1r1+ C1 s−r2 ---⎝ ⎠ ⎛ ⎞ U1( )s = 1 τ1τ2(kr+kt) --- (τ2s+1)(gs−b) s s2+ τ1+τ2 τ1τ2 ---⎝ ⎠ ⎛ ⎞s+ 1 τ1τ2 --- 1− kt kr+kt ---⎝ ⎠ ⎛ ⎞ ⎩ ⎭ ⎨ ⎬ ⎧ ⎫ ---⋅ =τ 1 1τ2(kr+kt) --- A3 s---+s---B−3r1+ C3 s−r2 ---⎝ ⎠ ⎛ ⎞ U2( )s = 1 τ2s+1 ---U1( )s = 1 τ1τ2(kr+kt) --- A4 s---+s---B−4r1+ C4 s−r2 ---⎝ ⎠ ⎛ ⎞ A3=rb 1r2 ---, B3=(τ2r1r+1)(gr1−b) 1(r1−r2) ---, C3=(τ2r2r+1)(gr2−b) 2(r2−r1) ---A4=−rb 1r2 ---, B4=r(gr1−b) 1(r1−r2) ---, C4=r(gr2−b) 2(r2−r1) ---U1( )t =u1( )t =K2(A3+B3er1t+C3er2t) U2( )t =u2( )t =K2(A4+B4er1t+C4er2t) K2= 1 τ1τ2(kr+kt)
---v : volume [ml]
V, V1, V2: target volume [ml]
Greek Letters
τ, τ1, τ2: time constant [-]
REFERENCES
Brauer, K.I., Svensen, C., Hahn, R.G., Traber, L.D. and Prough, D.S., “Volume kinetic analysis of the distribution of 0.9% saline in con-scious versus isoflurane-anesthetized sheep,” Anesthesiology, 96, 442 (2002).
Drobin, D. and Hahn, R.G., “Kinetics of isotonic and hypertonic plas-ma volume expanders,” Anesthesiology96, 1371 (2002). Drobin, D. and Hahn, R.G., “Volume kinetics of Ringer’s solution in
hypovolemic volunteers,” Anesthesiology90, 81 (1999). Hahn, R.G. and Svensen, C., “Plasma dilution and the rate of infusion
of Ringer’s solution,” British J. Anaesthesia, 79, 64 (1997). Hahn, R.G., Drobin, D. and Stahle, L., “Volume kinetics of Ringer’s
solution in female volunteers,” British J. Anaesthesia, 78, 144 (1997). Sjostrand, F., Edsberg, L. and Hahn, R.G., “Volume kinetics of glucose
solutions given by intravenous infusion,” British J. Anaesthesia, 87, 834 (2001).
Stahle, L., Nilsson, A. and Hahn, R.G., “Modelling the volume of ex-pandable body fluid spaces during I.V. fluid therapy,” British J. Ana-esthesia, 78, 138 (1997).
Svensen, C. and Hahn, R.G., “Volume kinetics of ringer solution, Dex-tran 70, and hypertonic saline in male volunteers,” Anesthesiology,