University of Massachusetts Amherst University of Massachusetts Amherst
ScholarWorks@UMass Amherst
ScholarWorks@UMass Amherst
Doctoral Dissertations Dissertations and Theses
Fall November 2014
Model-Driven Analytics of Energy Meter Data in Smart Homes
Model-Driven Analytics of Energy Meter Data in Smart Homes
Sean K. Barker
University of Massachusetts - Amherst
Follow this and additional works at: https://scholarworks.umass.edu/dissertations_2 Part of the Other Computer Sciences Commons
Recommended Citation Recommended Citation
Barker, Sean K., "Model-Driven Analytics of Energy Meter Data in Smart Homes" (2014). Doctoral Dissertations. 156.
https://doi.org/10.7275/m9tr-hq42https://scholarworks.umass.edu/dissertations_2/156
This Open Access Dissertation is brought to you for free and open access by the Dissertations and Theses at ScholarWorks@UMass Amherst. It has been accepted for inclusion in Doctoral Dissertations by an authorized administrator of ScholarWorks@UMass Amherst. For more information, please contact
MODEL-DRIVEN ANALYTICS OF
ENERGY METER DATA IN SMART HOMES
A Dissertation Presented by
SEAN BARKER
Submitted to the Graduate School of the
University of Massachusetts Amherst in partial fulfillment of the requirements for the degree of
DOCTOR OF PHILOSOPHY September 2014
c
Copyright by Sean Barker 2014 All Rights Reserved
MODEL-DRIVEN ANALYTICS OF
ENERGY METER DATA IN SMART HOMES
A Dissertation Presented by
SEAN BARKER
Approved as to style and content by:
Prashant Shenoy, Co-chair
David Irwin, Co-chair
James Kurose, Member
Deepak Ganesan, Member
Michael Zink, Member
Lori A. Clarke, Chair Computer Science
ACKNOWLEDGMENTS
I am deeply indebted to my advisors, Professors Prashant Shenoy and David Irwin, for their mentorship while I worked towards the completion of this thesis. I am very grateful for their insights and support during this process, and have learned a great deal from them about all facets of research. In particular, I am thankful to Prashant for his help in both identifying important questions and framing those questions in meaningful terms, and to David for his endless support in producing cohesive research papers. I am also thankful to both of them for their advice and patience in sitting through too many practice talks to list (or remember).
I am grateful to my committee members, Professors Jim Kurose, Deepak Ganesan, and Michael Zink, for providing invaluable feedback during the completion of my thesis, as well as to Dr. Emmanuel Cecchet for ongoing help and advice. I am thankful to Leeanne Leclerc for help in navigating the graduate school process, to Karren Sacco for handling many administrative tasks, to Tyler Trafford for frequent technical support, and to my past and present labmates in the Laboratory for Advanced System Software for their friendship and collaboration.
Last (but certainly not least), I owe a great deal of thanks to my wife, Elizabeth, who has endlessly supported and motivated me for the past five years of our lives in Amherst. I would not have reached this point if not for her love and support, and I look forward to the next phase of our journey together.
ABSTRACT
MODEL-DRIVEN ANALYTICS OF
ENERGY METER DATA IN SMART HOMES
SEPTEMBER 2014
SEAN BARKER B.A., WILLIAMS COLLEGE
M.Sc., UNIVERSITY OF MASSACHUSETTS AMHERST Ph.D., UNIVERSITY OF MASSACHUSETTS AMHERST
Directed by: Professor Prashant Shenoy and Professor David Irwin
The proliferation of smart meter deployments has led to significant interest in analyzing home energy use as part of the emerging ‘smart grid’. As buildings account for nearly 40% of society’s energy use, data from smart meters provides significant opportunities for both utilities and consumers to optimize energy use, minimize waste, and provide insight into how modern homes and devices use energy. Meter data is often difficult to analyze, however, owing to the aggregation of many disparate and complex loads as well as relatively coarse measurement granularities. At utility scales, analysis is further complicated by the vast quantity of data, which precludes the use of computationally intensive techniques when monitoring hundreds or even thousands of homes.
In this thesis, I present an architecture for enabling smart homes using smart energy meters, encompassing efficient data collection and analysis to understand the
behavior of home devices. I consider four primary challenges within this domain: (1) providing low-overhead data collection and processing for many devices, (2) designing models characterizing the energy use of modern devices, (3) using these models to track the real-time behavior of known devices, and (4) automatic identification of unknown devices in the home.
To enable practical smart homes, my proposed architecture combines low-cost, off-the-shelf sensing equipment with a hybrid local and cloud-based processing backend. To analyze data within the environment, I first characterize the basic device types present in today’s homes (e.g., resistive, inductive, or non-linear) and distill the essen-tial usage characteristics of each type. Using these characteristics, I construct a set of models that more accurately represents real-world devices than previous simplistic models. I then leverage this modeling framework to track the behavior of specific de-vices, using a technique that runs in close to real-time and can scale to many devices. Finally, I present a technique to automatically identify unknown devices attached to smart outlets in homes, which relieves homeowners of the need to manually describe devices in order to employ smart home optimizations.
TABLE OF CONTENTS
Page ACKNOWLEDGMENTS . . . .iv ABSTRACT. . . v LIST OF FIGURES. . . x CHAPTER 1. INTRODUCTION . . . 11.1 Background and Motivation . . . 1
1.2 Contributions . . . 3 1.2.1 Architecture . . . 3 1.2.2 Modeling . . . 4 1.2.3 Tracking . . . 5 1.2.4 Identification . . . 6 1.3 Outline . . . 7 2. RELATED WORK . . . 8
2.1 Smart Home Monitoring and Control . . . 8
2.2 Device Modeling . . . 10
2.3 Non-Intrusive Load Monitoring . . . 11
2.4 Device Identification . . . 12
3. SMART HOME ARCHITECTURE. . . 13
3.1 Sensing and Processing Infrastructure . . . 14
3.2 Real-World Deployment . . . 16
3.3 Combining Monitoring and Control . . . 19
3.3.1 Insteon Protocol . . . 20
3.3.3 Smart Polling Evaluation . . . 25
3.4 Summary . . . 26
4. APPLIANCE LOAD MODELING . . . 28
4.1 Background and Motivation . . . 28
4.2 Empirical Data Collection and Characterization . . . 31
4.2.1 Resistive Loads . . . 32 4.2.2 Inductive Loads . . . 33 4.2.3 Capacitive Loads . . . 36 4.2.4 Non-linear Loads . . . 36 4.2.5 Composite Loads . . . 38 4.2.6 Reactive Power . . . 39
4.3 Modeling Electric Loads . . . 42
4.3.1 On-off Model . . . 43
4.3.2 On-off Growth/Decay Model . . . 44
4.3.3 Stable Min-Max Model . . . 46
4.3.4 Random Range Model . . . 47
4.3.5 Compound Models . . . 48
4.4 Case Study: Device-accurate Synthetic Building Data . . . 51
4.5 Summary . . . 53
5. ONLINE LOAD TRACKING. . . 54
5.1 Background and Motivation . . . 54
5.2 Tracking Overview and Approach . . . 55
5.3 Offline Feature Identification and Selection . . . 60
5.3.1 Stable Power Steps . . . 61
5.3.2 Power Growth, Decay, and Spikes . . . 61
5.3.3 Bounded Power Oscillations . . . 62
5.3.4 Stable Power Oscillations . . . 62
5.3.5 Power Cycles . . . 63
5.3.6 Selecting Identifiable Features . . . 64
5.4 Online Load Tracking . . . 65
5.4.1 Tracking Algorithm . . . 65
5.4.2 Stable Oscillation Detector . . . 68
5.4.3 Bounded Oscillation Detector . . . 69
5.4.5 Spike Detector . . . 72 5.4.6 Step Detector . . . 73 5.4.7 Cycle Detector . . . 73 5.5 Implementation . . . 74 5.6 Evaluation . . . 75 5.6.1 Tracking Efficiency . . . 76 5.6.2 Tracking Accuracy . . . 80
5.6.3 Case Study: Demand Response Capacity . . . 84
5.7 Summary . . . 86
6. AUTOMATIC LOAD IDENTIFICATION . . . 88
6.1 Background and Motivation . . . 88
6.2 Problem Statement and Approach . . . 91
6.3 Identification Algorithm . . . 93
6.3.1 Preprocessing . . . 93
6.3.2 Feature extraction . . . 94
6.3.3 Classification . . . 95
6.4 Evaluation . . . 96
6.4.1 Identification of previously seen devices . . . 97
6.4.2 Breakdown by device and type . . . 98
6.4.3 Identification of previously unseen devices . . . 100
6.5 Summary . . . 102
7. SUMMARY . . . 103
7.1 Thesis Summary . . . 103
7.2 Future Work . . . 104
LIST OF FIGURES
Figure Page
3.1 In-home architecture of a smart home. . . 15 3.2 A smart home architecture supplemented with a remote, central
server for storage and analysis over large data streams. . . 16 3.3 CT installation at the mains panel. . . 18 3.4 Error between Home A’s aggregate electricity data and the sum of all
the individual circuits . . . 18 3.5 Insteon does not support high outlet query rates. . . 23 3.6 Frequency- and event-driven polling capture more energy events than
basic round-robin polling. . . 26 3.7 Event-driven polling drastically decreases the bandwidth required to
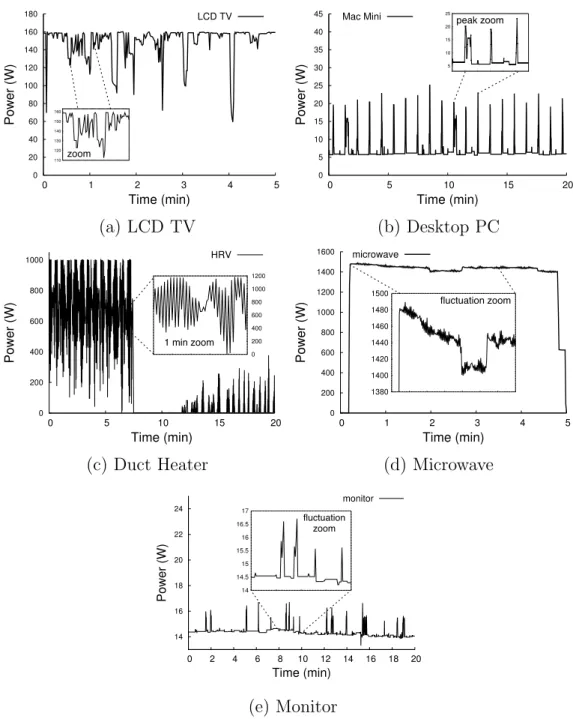
monitor a set of outlets. . . 27 4.1 An LCD TV’s power usage varies rapidly, significantly, and
unpredictably while on, and does not conform to a simple on-off
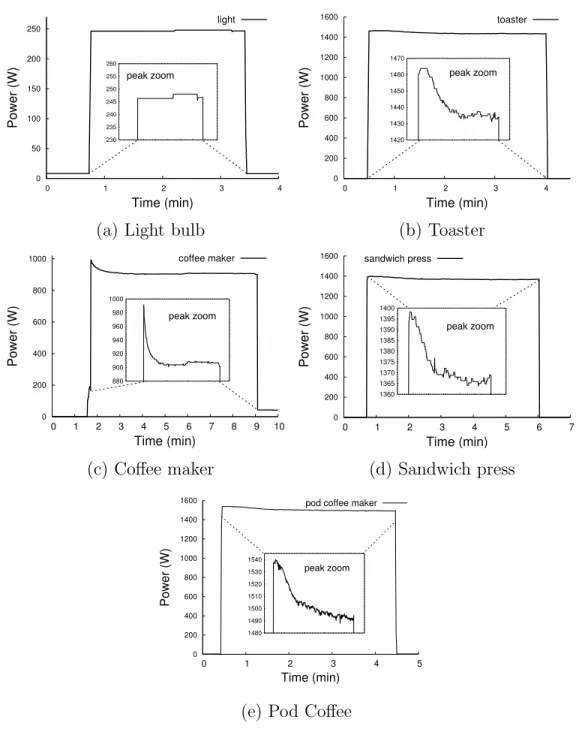
load model. . . 29 4.2 Example resistive loads, demonstrating “step” behavior with a
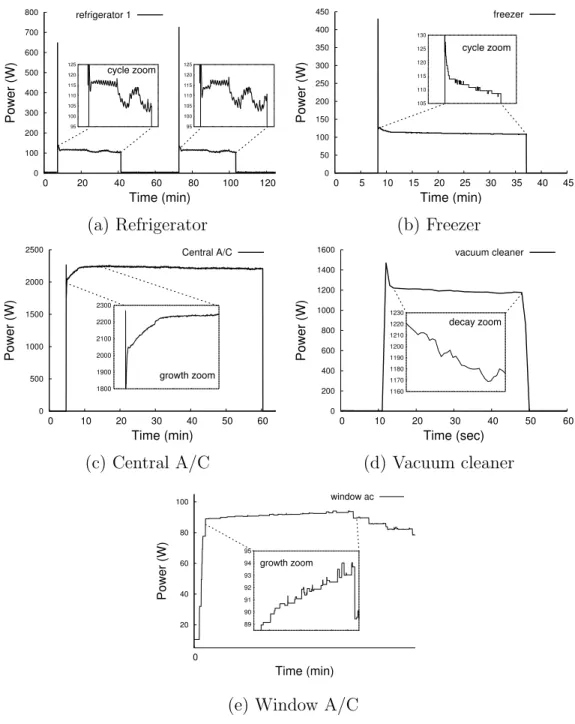
possible initial surge and slow decay to a stable power level. . . 34 4.3 Example inductive loads, demonstrating significant surge current
followed by steady power growth or decay. . . 35 4.4 Example non-linear loads, demonstrating rapid and significant
random variations with possible ceilings and/or floors. . . 37 4.5 Example composite loads, demonstrating combinations of the simpler
loads above arranged in phases. . . 40 4.6 Reactive power demonstrates the same types of patterns as real power
4.7 An on-off growth/decay model closely matches the average power usage measured each second for a variety of resistive and
inductive loads. . . 43
4.8 On-off growth/decay models are more accurate than on-off models. . . 46
4.9 A stable-max model of the LCD TV from Figure 4.1. . . 47
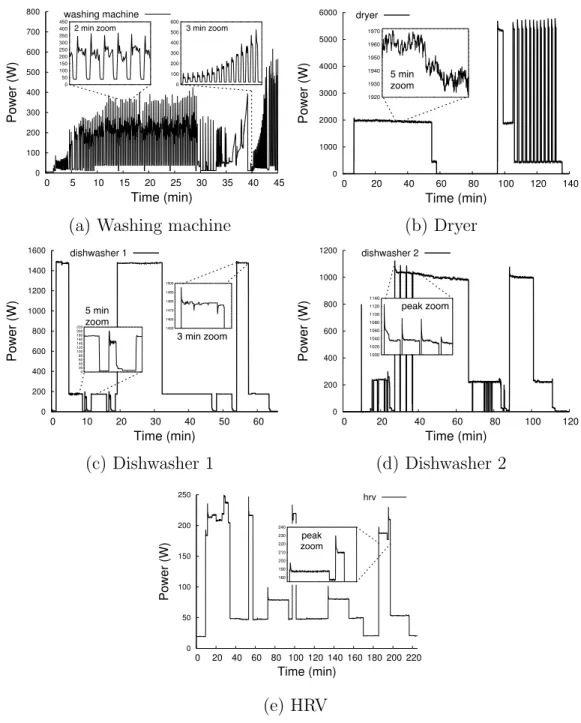
4.10 A single complete cycle of a washing machine, annotated with the model types for the operation of simpler internal loads. . . 50
4.11 Aggregate home power from measured data (a) and from our corresponding device models (b), along with a zoom-in comparison over 15 minutes. . . 52
5.1 PowerPlay’s approach, which uses offline modeling and feature extraction for online load tracking. . . 58
5.2 Features of the different basic electrical loads. . . 61
5.3 Annotated features from representative loads. . . 63
5.4 Detection of a stable oscillation feature. . . 69
5.5 Example of bounded oscillation detector. . . 71
5.6 Operation of the decay/growth detector. . . 71
5.7 Operation of the cycle detector. . . 74
5.8 PowerPlay’s tracking algorithm is efficient, with tracking delays of at most a few seconds. . . 77
5.9 PowerPlay efficiency enables it to scale to many homes, while maintaining a low tracking delay. . . 79
5.10 Both PowerPlay and the FHMM approach accurately assign the energy used by loads each day. . . 81
5.11 PowerPlay error factors when scaling up to highly noisy and complex smart meter data. . . 82
5.12 PowerPlay is more robust to noisy smart meter data than the FHMM-based approach. . . 83
5.13 Online load tracking in PowerPlay generates an inferred time-series of each tracked load’s power data (middle column) that is closer to the load’s actual usage (left column) than a recent disaggregation algorithm based on Factorial Hidden Markov Models
(FHMM) [37, 34] (right column). This figure visually compares actual power usage, PowerPlay’s inferred power usage, and the FHMM approach’s inferred power usage for representative
loads. . . 85 6.1 Software and hardware architecture for NILI-enabled smart
building. . . 92 6.2 Classification performance on the entire dataset, i.e., identifying
previously seen devices, using 10-fold cross-validation. Both performance on specific device instances and general device
classes is shown. . . 98 6.3 Individual device identification accuracy per device. Devices A and B
represent two instances of the same device type (with different
specific models). . . 98 6.4 General device type identification accuracy, broken down by type. . . 99 6.5 Accuracy of device type identification on previously ‘unseen’ devices,
along with accuracy when all devices are in the training dataset
CHAPTER 1
INTRODUCTION
The management of energy in today’s environment of ever-increasing demand is an issue with profound economic, environmental, and social impact. As homes and office buildings represent over 70% of total grid electricity consumption today [14], significant attention has been paid to ‘smart grid’ initiatives focused on reducing or optimizing the energy consumption of buildings. This thesis discusses challenges involved in designing energy-aware smart homes and proposes a model-based approach to tackling these challenges.
1.1
Background and Motivation
Computing for sustainability—where real-world physical infrastructure leverages sensing, networking, and computation to mitigate the negative environmental and economic effects of energy use—has emerged as an important new research area. As a result, in addition to improving the energy efficiency of information technology (IT) infrastructure such as mobile devices, servers, and data centers, computing researchers are expanding their focus to now include building energy efficiency. Since buildings account for nearly 40% of society’s energy use [32], compared to an estimated 1-2% for IT infrastructure [39], the emerging ‘smart grid’ has the potential to make a significant impact on society’s energy footprint. Managing electricity is particularly critical because buildings consume the vast majority (73%) of their energy in the form of electricity [32].
Existing management techniques typically employ sense-analyze-respond control loops: various sensors monitor the building’s environment (including electricity) via a smart meter, and transmit collected data in real-time to servers, which analyze it to reveal detailed information about building devices and occupants, and finally re-spond by automatically controlling electrical loads to optimize energy consumption. However, research challenges exist at each stage of the control loop. Sensing at neigh-borhood or utility-scales is complicated by the need for prohibitively large numbers of sensors and the associated cost, invasiveness, and upkeep of such deployments. Analysis is often difficult due to the desire to extract fine-grained information (e.g., the behaviors of individual devices) from the relatively coarse-grained data that is generally available (e.g., as from a typical smart meter). When employed by utilities, analysis techniques are further complicated by the need to process large quantities of meter data efficiently. Finally, responding to observations made from analyses is often complicated by practical concerns, such as the presence (or lack thereof) of actuating capabilities within homes themselves. All of these challenges must be addressed to truly design sustainable smart buildings capable of influencing and managing their energy footprint.
This thesis addresses many of these challenges by combining a flexible architecture for efficient energy data collection and processing in buildings with a set of analytic techniques for interpreting this data. In particular, we focus specifically on the case of residential homes, as homes tend to exhibit similar devices, patterns, and oppor-tunities for energy optimization. In particular, we consider the following set of key challenges concerning the design of smart homes:
1. How can we enable energy-aware smart homes capable of data collection and analysis without excessive instrumentation overhead?
2. How can we understandthe energy usage of a home as a function of the many individual devices that make up a home?
3. How can we apply this understanding to monitor and analyze the dynamic behavior of smart homes?
1.2
Contributions
In this thesis, I present an architecture for energy-aware smart homes and a set of model-driven techniques for analyzing smart meter data in such homes. The primary components and contributions of this thesis are as follows:
• Architecture: A general-purpose architecture for monitoring and processing the energy use of a home environment, focusing on low-cost, off-the-shelf home automation (HA) devices to enable pervasive energy sensing.
• Modeling: A modeling framework enabling efficient, device-accurate models of individual loads, based on an understanding and analysis of the essential load types and characteristics of nearly all devices in a typical home environment.
• Tracking: A technique that employs the aforementioned modeling framework to accurately track the behavior of individual, previously identified loads within smart homes, in effect providing a ‘virtual energy meter’.
• Identification: A technique that automatically identifies devices attached to ‘smart outlets’, thereby relieving homeowners of the need to maintain a mapping of devices to attached outlets in the home.
Each component is described in more detail below.
1.2.1 Architecture
In order to achieve energy optimizations in practice, homes must be able to both collect and manage data about their own environments. The primary challenge here is providing these capabilities without excessive overhead, both in terms of equipment
and installation costs (i.e., beyond what a typical ‘dumb’ home would contain). I describe the design of a smart home architecture centered around an off-the-shelf home energy meter, potentially coupled with smart outlets for finer-grained data collection. In particular, I explore the use of low-bandwidth home automation (HA) devices for fine-grained energy sensing. Data processing is split between a low-power home controller and remote servers for long-term storage and more intensive processing. Results of data analysis are returned to the home in order to perform optimizations (e.g., reducing peak electricity use). Several real-world smart homes following the proposed design comprise an ideal environment for the development and evaluation of data analytics, as described below.
1.2.2 Modeling
The increasing availability of smart meter data in homes has led to significant interest in analyzing this data to understand device behavior, occupant behavior, and key contributors to overall energy use. As raw energy data is often difficult to interpret without prior knowledge of how devices actually operate, most analysis techniques rely on models of device behavior to interpret data from smart meters. Accurate modeling is particularly important when the only data available is aggregated, as is typically the case with a single energy meter providing energy data from the entire house.
Most existing models, however, have been based on overly simplistic assumptions of device operation. For example, most prior work assumes a device will turn on, consume a stable level of power (or possibly one of several stable levels), and then turn off. Through a detailed study of real-world device energy use, I demonstrate that many types of devices do not consume energy in this straightforward way, and therefore that more complex models are necessary to present truly device-accurate models. I present a compact but expressive set of models based on fundamental
elec-trical characteristics (e.g., resistive, inductive, or non-linear loads) and demonstrate how nearly all significant devices in today’s homes can be represented by one or more of the fundamental model types. Furthermore, I demonstrate how these models in-crease accuracy and enable more sophisticated analyses of real-world smart meter data when compared to simpler models.
1.2.3 Tracking
Many energy optimizations that consumers and utilities would like to employ (e.g., automatically shifting the operation of specific devices to decrease peak elec-tricity consumption) require relatively up-to-date data from individual devices. For example, an alert system that notifies homeowners of specific events of interest (e.g., a dryer completing its cycle) requiresreal-time data from the device in question, either through a dedicated energy meter attached to the device, or a way to extract this data from aggregated smart meter data. However, existing analysis techniques for extract-ing individual devices from aggregate meter data (typically known as non-intrusive load monitoring) are not designed to operate online, and are therefore unsuitable for these types of applications.
To address this issue, I present PowerPlay, an efficient, onlineapproach to track-ing the behavior of specific devices within a home, based on detecttrack-ing recognizable features from the device models previously proposed. The design of the features and detectors employed allows for online operation on a low-power machine such as in an individual home, or on a server when handling a utility-level quantity of data (e.g., hundreds of homes simultaneously). In doing so, PowerPlay effectively provides the illusion of a ‘virtual’ smart meter without actually requiring the installation of additional meters. Furthermore, PowerPlay is highly resilient to background devices operating within the same home, which preserves its effectiveness even when many other (potentially unknown) devices are installed in the home. Using our smart home
deployments, I demonstrate the accuracy, scalability, and efficiency of PowerPlay on real smart meter data.
1.2.4 Identification
In homes containing smart outlets capable of individually monitoring connected devices, the tracking problem described above is less significant – as individual device data is available directly, there is no need to extract this data from the whole-house data stream. However, this environment introduces new challenges – in particular, in order to effectively make use of smart outlet data, the nature of the attached devices should be known (e.g., type of device, device model, etc). Traditionally, this issue is dealt with by manually maintaining a mapping of outlets to devices (e.g., outlet #6 is attached to the kitchen refrigerator). Maintaining this mapping, however, is difficult for the hundreds of devices that may be found in homes, and error prone when attached devices change (such as a wall outlet that may have a vacuum cleaner or laptop charger attached at different times).
To negate the need to maintain an outlet-to-device mapping, I present a technique for performing ‘non-intrusive load identification’ (NILI) – that is, automatically iden-tifying the device attached to an outlet based on the energy data from that outlet. By training a classifier to detect specific device types and periodically processing the most recent data from a smart outlet, a dynamic outlet-device mapping may be automatically maintained without manual intervention.
Note that the NILI problem is essentially the inverse of the tracking problem described previously; for tracking, the device of interest is known but its energy use is not, while for identification, the energy use is known but the device itself is not. Both problems are of interest depending on the level of smart home instrumentation (i.e., whether smart outlets are present in addition to the whole-house smart meter).
1.3
Outline
Chapter 2 provides a summary of related work in the areas of smart homes and energy metering. In Chapter 3, I present the flexible smart home architecture enabling energy-based optimizations and summarize the implementation of a real deployment following this design. In the context of this data-driven architecture, Chapter 4 then presents a modeling framework for describing the energy use of commonplace home devices. Using this framework, Chapter 5 describes a technique for tracking specific devices in a smart home using only data from a whole-house energy meter. Chapter 6 addresses the challenge of automatically identifying devices attached to individual smart outlets when such outlets are available. Finally, Chapter 7 provides an overview of this work and summarizes future directions.
CHAPTER 2
RELATED WORK
This chapter presents a survey of background work in smart homes, modeling, and non-intrusive load monitoring (NILM).
2.1
Smart Home Monitoring and Control
Smart buildings use demand-side energy management to self-regulate their energy footprint to reduce overall energy consumption and peak power usage, while better aligning consumption with renewable generation [54]. Demand-side management re-quires buildings to 1)continuously monitor the power consumption of electrical loads and 2) remotely control when and how much power each load consumes, e.g., to en-able automated demand response. Although load monitoring and control are closely coupled in demand-side management, two disjoint sets of technologies have evolved to perform these tasks in smart homes.
On the monitoring front, researchers have developed numerous techniques to en-able fine-grain tracking of electric usage at various spatial and temporal dimensions, e.g., [19, 23, 29, 35, 42]. Several past efforts focus on outlet-level monitoring, and in some cases control, of electric loads using wireless technologies, such as 802.15. These technologies are still expensive for typical homes, which may contain several tens to hundreds of outlets. For instance, while not commercially available, ACme meter components cost $85 plus time for assembly and calibration [28, 40], while Tweet-a-watt components cost $60 per meter plus time for assembly [56]. Similarly, the commercial PloggSE plug meter costs $215 per outlet [48]. Other problems
in-clude upkeep, communication interference, and aesthetic concerns when deploying large numbers of meters [24]. A less expensive option is to deploy a single sensor at a home’s electric panel to monitor aggregate usage, and use NILM or load tracking techniques to disaggregate individual loads. However, this approach alone is not suf-ficient for developing such techniques, as it lacks the capacity for ground-truth data necessary for evaluation. The collection of high-quality datasets has attracted the interest of many researchers in sustainability [37, 2, 7] and represents another goal of smart home deployments.
On the control front, Home Automation (HA) protocols, such as X10 and In-steon [26, 27], were designed explicitly for remote load control. The protocols en-able programatic actuation of outlets and switches hard-wired into a building and controlled from a central server, via command-line or remote web/smartphone in-terfaces, using the building’s powerlines for communication. HA protocols are also mature standards: X10 was introduced in 1975 and Insteon in 2005. Many of these protocols communicate over building power-lines, which has been proposed as a path towards smart buildings [44]. Increasingly, monitoring and control capabilities can be combined via ‘smart outlets’ such as the Belkin WeMo Insight Switch [59], which in-tegrate sensing and actuation capabilities into a single outlet-like device. We consider the challenge in Chapter 3 of augmenting HA protocols for high-resolution monitoring, which requires compensating for very low bandwidths provided by these protocols. The use of HA devices for outlet- and switch-level energy monitoring supplements our proposed smart home architecture, which is based around a whole-house smart meter and low-power controller for performing local data processing. Notably, in contrast to HA protocols, many past efforts focus on outlet- and switch-level energy monitoring using wireless technologies, such as Z-Wave, ZigBee, and WiFi. WiFi is especially attractive due to existing WiFi networks and relatively high bandwidth for fine-grained monitoring. Unfortunately, since outlet and switch boxes are embedded
in walls and may be behind large appliances, wireless communication often exhibits interference that severely degrades its performance and reliability.
2.2
Device Modeling
While recent work targets modeling for specific appliances, e.g., a particular brand of refrigerator [54] or an HVAC chiller [9], it does not generalize to a broad range of devices. While the problem of modeling devices is not exclusively useful in NILM or load tracking applications, most prior work in modeling devices has been in the context of performing NILM.
All NILM approaches inherently use some form of load models for devices. How-ever, most existing approaches employ generic on-off load models that represent de-vices as simple ‘step’ functions. These techniques typically use these simple models to either i) detect changes in load power states by observing changes in building power, [60] or ii) use Viterbi-style algorithms [17] to determine the most likely set of “hidden” states, e.g., combinations of power states for multiple loads, from a sequence of changes in building power [34]. The simplest edge-detector approaches [22, 23] rep-resent devices using only two states – on and off.
The modeling work presented in Chapter 4 targets a more expressive modeling framework based on understanding the electrical properties of common devices. As nearly all devices fall into a few categories describing their electrical characteristics (e.g., heating devices are resistive, motors are inductive, etc), I detail a compact yet comprehensive set of models that is more accurate than prior models based on small numbers of static states. This work represents a novel application of domain-specific knowledge (i.e., fundamental properties of power systems) to the problem of modeling appliances in homes.
2.3
Non-Intrusive Load Monitoring
One of the highest profile types of smart meter data analysis is termed non-intrusive load monitoring(or NILM), which refers to decomposing a house-level smart meter trace into its component devices. Performing this decomposition provides useful information such as (i) the percentage of energy use attributable to certain devices or class of devices, and (ii) the operational patterns of specific devices. There has been over two decades of work on NILM and recent surveys describe and contrast these various approaches [4, 18, 60, 61]. The earliest approaches to NILM involved simple edge-detection (i.e., matching on with off steps within a meter trace) [22, 23], while more recent techniques use more sophisticated machine learning techniques such as Factorial Hidden Markov Models [34, 37].
A key determinant of the type of technique that is best suited to perform NILM depends on the sampling resolution of the energy meter. Prior approaches have tar-geted a range of sampling resolutions by using meters that produce 10 million readings every second [45] to 1 reading every hour [38]. Clearly, sampling the total power usage thousands or millions of time every second produces very clearly discernible “signa-tures” when each device turns on, allowing detection and identification of individual loads [45]. As the sampling resolution becomes coarser, the readings represent the mean power usage over larger and larger intervals, making it harder to discern the turning on and off of individual loads. For instance, at a one hour granularity, it is nearly impossible to detect that a light bulb was switched on for a few minutes during that hour—since the reading indicates the average power usage of a larger collection of loads that were active over the entire hour, making it harder to discern individual loads. Today’s utility-grade smart meters provide minute-level sampling (a reading every 5 minutes is typical) but there are indications that the next generation of smart meters will provide sampling resolution of seconds [57].
The work in load tracking presented in Chapter 5 differs from NILM in a few keys ways, most notably by focusing on online operation and accurate per-load disaggre-gation (i.e., effectively providing the abstraction of a ‘virtual’ smart meter) . Most existing NILM techniques are designed to operate offline over large ranges of data (e.g., 1 day) and output a complete energy breakdown, which is difficult due to the number of distinct devices (often 100+) in the home. Furthermore, the per-device accuracy of NILM often suffers when considering fine-grained timescales. The ap-proach to tracking loads detailed in this work explicitly does notattempt to account for every load in the home, but instead focuses on efficient, accurate extraction of a small number of devices of interest in an online fashion.
2.4
Device Identification
Prior work on device identification has largely been in the context of whole-house metering, and thus falls under the umbrella of NILM. Device identification from outlet-level meters, or ‘non-intrusive load identification’ (NILI), however, has received substantially less attention. Accurate load identification has been achieved using high-frequency smart meters [51], but this granularity of data is not typically available from off-the-shelf smart outlets. For lower frequency data, e.g., 1 Hz, the use of classifiers for learning device labels has been proposed, but not extensively evaluated [63, 52], particularly for previously unseen devices. Other approaches to device classification have focused on explicit per-device training to generate ‘signatures’ that can be used to detect devices in the future [53]. These techniques, however, rely on user-guided training periods to recognize specific devices, as opposed to transparent recognition of devices classes. In this work, we investigate the identification of devices using typical meter data (i.e., 1 Hz) and consider both specific device identification (i.e., a specific model of refrigerator) as well as general device type identification (i.e., any type of refrigerator).
CHAPTER 3
SMART HOME ARCHITECTURE
Any smart home requires two fundamental components: monitoring, in which data about electrical usage and any other relevant environmental data is collected, and analysis, in which this data is used to derive insights into the home’s energy use. An optional third component is control, which refers to the ability of the home to automatically actuate loads. While control enables the implementation of automatic energy optimizations, such as rescheduling appliances, it is not necessary for other types of applications, such as user recommendations and many types of analytics.
In this chapter, we describe a smart home architecture encompassing monitor-ing and analysis, which provides a representative environment in which to explore smart home applications. In particular, we discuss the challenges of providing high-resolution energy monitoring using widely available home automation (HA) products, such as Insteon devices, which allows for adding monitoring capabilities onto existing control capabilities in smart homes. We also provide an overview of our own real-world smart home deployment, which was implemented following this architecture and has been live for over three years. Data gathered from our deployment provides a virtual laboratory for the analytics discussed in Chapters 4 through 6 of this thesis. While actuation and end-user applications (e.g., device scheduling policies) are also important components of real-world smart homes, this thesis focuses only on data analytics, which are necessary precursors to many smart home applications.
3.1
Sensing and Processing Infrastructure
The general-purpose smart home architecture we consider consists of several com-ponents within the home, which are pictured in Figure 3.1 and described below.
• A smart meter attached to the home’s electrical panel. The meter reads the aggregate home energy usage via current transducers and streams power read-ings every second to thegateway(described below). The meter may also collect and transmit other types of data, such as reactive power, frequency, and volt-age information. Numerous commercial power meters are available, such as the TED 5000, BrulTech ECM-1240, Current Cost Envi, and eGauge. These meters sense electricity usage using current transducers (CTs) wrapped around each leg of a home’s split-phase input power.
• A gateway server operating the software platform for the home. This gateway is the ‘brain’ of the smart home and processes and stores (at least temporarily) data from all sensors in the home. The gateway also performs load analysis on incoming data and load actuation based on customizable optimization policies. While any machine may be used as a gateway server, well-suited choices include ‘plug’ computers such as the GuruPlug [20], which are compact, low-power, and inexpensive ($100 or less).
• Off-the-shelfprogrammable switches and meters connected to appliances in the home. The gateway communicates with the programmable switches via Power-Line networking, which has been proposed for use in smart buildings [44] and requires no additional infrastructure in the home. Outlet-level meters commu-nicate by PowerLine or wirelessly and provide ground-truth data on individual loads within the home. Both metering and programmability may be provided by all-in-one “smart outlets”, which impart these capabilities to any attached
de-Gateway grid power renewables Outlet/Switch Meters Panel Meter power readings Programmable Switches Appliances comma nds power readings
Figure 3.1. In-home architecture of a smart home.
vice. Optionally, other types of sensors may also transmit data to the gateway, such as motion sensors, door sensors, and weather stations.
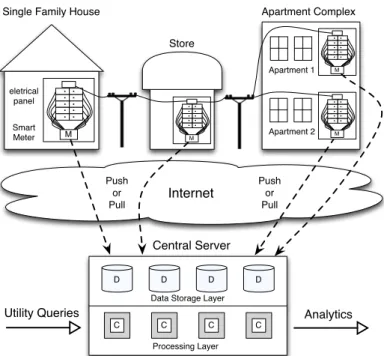
While the basic components described above are ‘complete’, the architecture is limited by the capabilities of the gateway server, which will typically be only a low-power machine or even directly integrated into a smart meter. A low-low-power gateway both limits the processing and data storage capabilities of the smart home. To remedy this issue, we can easily extend the architecture with remote servers accessed over the Internet, as illustrated in Figure 3.2. Here, each home communicates with a central server or set of servers (possibly operated by the utility) and sends data to the central server for long-term storage and analysis. An added benefit of this approach is that the central server may run analytics over multiple homes at once, such as if a utility wishes to calculate the total energy use of its customers’ air conditioners. Mechanisms for control within homes themselves, may or may not be accessible, depending on the level of control that homeowners wish to delegate to the utility.
M eletrical
panel
Smart Meter
Single Family House Apartment Complex
Internet
D D
D D
Data Storage Layer
Central Server Push or Pull Push or Pull M M Apartment 1 Apartment 2 M Store C C C C Utility Queries Processing Layer Analytics
Figure 3.2. A smart home architecture supplemented with a remote, central server
for storage and analysis over large data streams.
3.2
Real-World Deployment
We have implemented the smart home architecture detailed in Section 3.1 within three real-world homes in order to drive our research (including, but not limited to, the work detailed in the remainder of this thesis). The most fully instrumented home is described below, while details on the other two are available in [7].
Our primary instrumented home is a two-story, 1700 square foot home with three full-time occupants. The home has a total of eight rooms including its basement. Major appliances include window air conditioning units, an electric dryer, a washing machine, a heat recovery ventilation (HRV) unit, a dishwasher, a refrigerator, and a freezer. The home has 35 wall switches, which primarily control room and closet lighting; switches also control an exhaust fan in each bathroom and the garbage disposal. The electrical panel has 26 individual circuits.
The smart home deployment is centered around a gateway in the form of an em-bedded Linux server (a GuruPlug) that queries each sensor to collect data. Using an
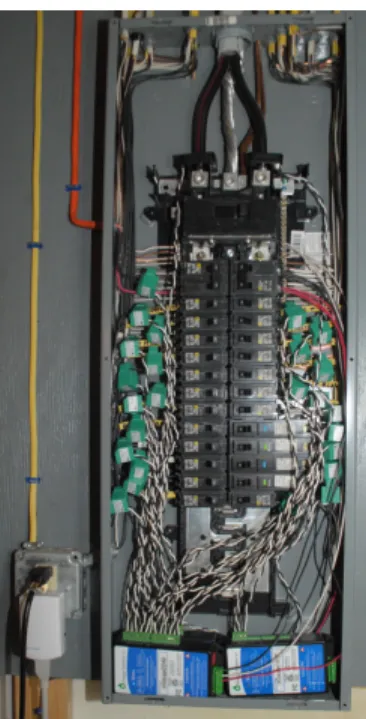
eGauge [15] smart meter installed in the mains panel (pictured in Figure 3.3, we col-lect ecol-lectricity data every second for the entire home as well as each individual circuit. We have replaced 30 of the home’s 35 wall switches with units that transmit on-off-dim events for the switches to the gateway server. We are able to derive the power usage from the uninstrumented switches via the circuit data: the basements switches are on dedicated circuits, the garbage disposal is on a circuit with only the dishwasher (which has a dramatically different power profile), and the kitchen switch is on a cir-cuit dedicated to kitchen lights, which has only one other already-instrumented load. The home’s electrical wiring also aids our data collection. Each circuit is dedicated to either lighting (monitored at wall switches), outlets (monitored by plug meters – in effect providing smart outlets), or individual large appliances (monitored at the mains panel). Our plug-level sensors are commodity Insteon iMeters [25] and Z-Wave Smart Energy Switch meters [1], which use powerline and wireless communication, respectively, to transmit readings to our smart home gateway. Since our wall switches report on-off-dim events, rather than raw power, having the lighting on separate cir-cuits makes it simple to correlate lighting events with power usage using the circuit data. In addition to local storage on the gateway server, data from eGauges and wall outlets is also transmitted nightly to a central server (as detailed in Section 3.1), where it is archived for later retrieval and analysis.
As our analytic work is highly dependent on the quality of the energy data collected by our deployment, we have conducted experiments to verify the accuracy of our meters. The primary eGauge meter is rated to have less than 1% error for current and voltage. Redundant monitoring of both the home’s aggregate data and every circuit allows us to determine the relative error of the sensors, by comparing the aggregate usage with the sum of all circuits’ usage. Figure 3.4 demonstrates that over 90% of the per-second readings for the entire home and the sum of the circuits is within 2% of each other, while over 99% of readings are within 4% of each other.
Figure 3.3. CT installation at the mains panel. 40 50 60 70 80 90 100 0 2 4 6 8 10 % Readings < Error Error (%) Grid vs. ΣCircuits
Figure 3.4. Error between Home A’s aggregate electricity data and the sum of all
the individual circuits
In addition to monitoring power usage in the home, our infrastructure has support for tracking other metrics, such as solar generation and environmental data from weather sensors (temperature, wind speed, etc.). Additional sensors also track events within the home, such as motion detectors, door sensors, and thermostat sensors.
Our system has been continually monitoring hundreds of individual loads every second for over three years in each of our three instrumented homes. Since our level of instrumentation is time-consuming and expensive to replicate, we have made much of our collected data available to benefit other researchers [7]. To date, this dataset
has been downloaded by over 600 unique users in over 80 countries. This data has also enabled our own smart home research, such as the analytic challenges discussed in Chapters 4 through 6.
3.3
Combining Monitoring and Control
Many of the “smart home” devices available today (e.g., remotely controlled switches and sensors), as well as much of our own deployment, fall under the umbrella of “home automation” (HA). Once designed for hobbyists, HA has now become main-stream and is widely used in smart buildings for actuation of outlets and switches, using a building’s powerline for communication via protocols such as Insteon. These protocols have a number of advantages that make them attractive for use in smart homes, including widespread commercial availability, open standards, compatibility with existing buildings using HA protocols, and the high reliability of the power-line communication typically used. Despite these benefits, however, using HA-based protocols for energy monitoring poses significant challenges:
1. Scalability. HA protocols were not designed to support continuous monitoring
traffic and often lack basic features such as collision avoidance, making high-resolution energy monitoring challenging for even a small set of devices. Thus, a key research challenge is scaling HA protocols to monitor large numbers of devices.
2. Accuracy. HA protocols are capable of monitoring power state changes for
switches and low resolution power usage for outlets. Thus, another key challenge isaccurately translating switch state change events and coarse outlet power data into high resolution power usage measurements.
As many of our own outlet-level meters are Insteon devices, we have tackled this challenge by designing “smart polling” techniques to enable reliable, high resolution
power monitoring using HA protocols. Here we provide an overview of the Insteon protocol as well as our polling techniques to enable high-resolution sensing in smart homes using Insteon hardware.
3.3.1 Insteon Protocol
To support monitoring, Insteon-enabled wall switches send asynchronous notifi-cations whenever someone toggles the switch, while the Insteon-enabled outlets must be explicited queried for their power usage. The primary difficultly in using HA pro-tocols such as Insteon for energy monitoring is their extreme bandwidth limitations. While more recent powerline-based protocols, such as HomePlug, provide much more bandwidth, they are not used for HA, and instead are targeted at high-bandwidth data from Internet traffic. HomePlug is not typically embedded into standard wall outlets and switches due to both cost and form factor constraints. We focus on In-steon in our deployment, since it is an extension of the original X10 HA protocol with greater reliability and higher bandwidth.
In the Insteon protocol, senders broadcast messages over a building’s powerline, while receivers listen for messages and send acknowledgements upon receipt. All Insteon devices also act as repeaters that automatically repeat messages they hear a fixed number of times, alleviating the need for complex routing protocols to transfer messages. The protocol also avoids flooding and collisions when repeating messages, since all devices synchronize retransmissions using the 60Hz AC powerline frequency— each transmission begins exactly 800 microseconds before the zero crossing and ends exactly 1023 microseconds after the zero crossing.
The Insteon protocol supports two types of messages: 10 byte standard messages and 24 byte extended messages, which require 6 and 13 zero crossings to transmit, respectively. Since there are 120 zero crossings per second with 60Hz AC power, a standard message takes 50ms to transmit and an extended message takes 108.33ms,
with no additional hops. While Insteon’s maximum theoretical bandwidth is 2880bps, in practice, messages typically travel three hops and return acknowledgements, which reduces the maximum bandwidth by 16X to 180bps. In addition to repeated messages, a sender that does not receive an acknowledgement within a timeout will retransmit a message up to five times. Thus, actual bandwidth may be much less than 180bps with three hops.
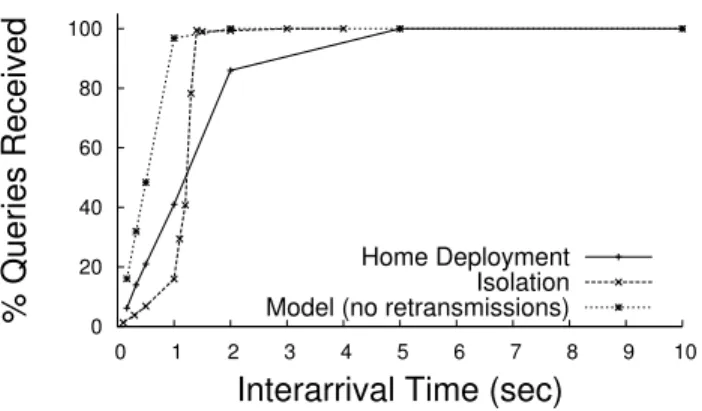
Finally, note that Insteon does not prevent multiple devices from sending dif-ferent messages at the same time. While repeating messages avoids flooding and collisions due to the synchronized retransmissions, Insteon has no collision avoidance mechanism (likely due to its design towards low bandwidth control). At high mes-sage rates, Insteon’s lack of backoff combined with its static number of multiple hops and retransmissions per message results in repeated collisions, causing bandwidth to abruptly collapse. Setting the query rate for outlets presents a tradeoff: a rate too high will saturate the available bandwidth and result in the loss of either asyn-chronous switch notifications or control commands, while a rate too low will result in coarser and less accurate outlet power data. To understand this tradeoff, we experi-ment with our smart home deployexperi-ment by varying the rate of outlet queries, and then determining both the percentage of queries lost (Figure 3.5) and the percentage of switch notifications lost. For each data point, we issue outlet queries at the specified interarrival time on the x-axis for 10 minutes, while turning wall switches on and off 50 times, such that the time between toggling the switch is uniformly random between 0 and 20 seconds. We also perform a similar experiment in isolation in a separate building with no other devices attached to the powerline.
Each outlet query includes three standard Insteon messages and one extended mes-sage: a standard query message from PLM → outlet, an extended response message from outlet → PLM with the outlet’s current average power usage, and a standard acknowledgement for each message. Based on the protocol specification, each
out-let query should take 4*(0.05+0.05+0.1083+0.05) = 1.0333 seconds, including the original message and the three additional hops.
Below, we use the specification to model the percentage of outlet queries we expect to receive, and the percentage of switch notifications we expect to lose for different query rates. We construct a simple model of the probability of losing a switch notifi-cation (Slose) as a function of the interarrival time of outlet queries (Ti) and the length
of an individual query (Tq = 1.0333). For simplicity, our model assumes that when
transmissions collide, the transmission from the device physically closer to the PLM is successful. In addition, our model assumes one retransmission due to powerline noise, and no additional retransmissions due to collisions. Thus, the model divides the length of an individual query (Tq) by two times the interarrival time between
queries (Ti), where the factor of two in the denominator approximates the effect of
one extra retransmission.
Slose = Tq 2∗Ti = 0.5166 Ti (3.1) We also model the probability of receiving a query Qreceive as the function below.
If we issue queries at an interval greater than the query length, then we expect to receive every query. For intervals less than the query length, we expect queries to increasingly collide. Qreceive= 1 :Ti >1.0333 Ti Tq = Ti 1.0333 :Ti <1.0333
Figure 3.5 shows that, as expected, issuing queries faster then the 1.0333 seconds it takes to complete them rapidly degrades performance. In isolation, our results show an abrupt drop in the percentage of outlet queries received once the interarrival time hits the protocol’s saturation point at 1.0333 seconds. In isolation, the actual drop is more sudden than our model, since the model does not account for multiple
0 20 40 60 80 100 0 1 2 3 4 5 6 7 8 9 10 % Queries Received
Interarrival Time (sec) Home Deployment
Isolation Model (no retransmissions)
Figure 3.5. Insteon does not support high outlet query rates.
retransmissions of a lost message, which immediately collapses the available band-width. Our smart home deployment also shows more query losses than our model before the saturation point, which is likely due to i) additional losses from powerline noise due to other devices and ii) collisions with switch notifications and the resulting retransmissions.
Our results highlight the limitations of using Insteon for monitoring the energy usage of many devices. Consider a simple approach to querying outlets that issues one query every 10 seconds to a new outlet in round-robin fashion. Thus, given N
outlets in a building, this approach can query each outlet once every 10∗N seconds. Since our home deployment currently uses thirty Insteon-enabled outlets, we are able to measure each outlet’s power once every five minutes.
A five minute data resolution is not effective at monitoring the energy usage of most types of devices. As we show in prior work [6], many non-linear electronic de-vices, such as LCD televisions, exhibit rapid and significant changes in power, e.g.,
>100W every second, when turned on. Other high-power resistive and inductive de-vices also exhibit complex patterns of power usage that change every second. Further, since many devices, such as a microwave or toaster, have operating times much less five minutes, this approach cannot detect their operation. In fact, the only devices this simple approach can accurately detect are low-power resistive devices, which
ex-hibit highly stable power usage, that are left on for more than five minutes. The only prominent low-power resistive devices are incandescent light bulbs, which are slowly being phased out. Of course, additional outlets will further decrease the power data resolution.
In addition, even when employing such a low query rate, the probability of losing a switch notification or a control command is still near 5%. Since the OS issues control commands, losing them does not present a significant issue, since it can recognize their loss at application-level and resend them. However, our simple approach to monitoring would have no way to detect a lost switch notification, so it will miss 5% of them at this query rate. Thus, our results motivate a more efficient approach to to monitoring outlet power usage that judiciously controls the number of outlet queries.
3.3.2 Smart Outlet Polling
Insteon-enabled outlets must be polled in order to read the energy use of the at-tached device, which results in many devices competing for limited global bandwidth. The simplest polling approach is to continuously query Insteon-enabled outlets in a round-robin fashion at a static query rate. While simple, this approach suffers the most from bandwidth limitations, since devices that rarely change state (such as lights) are polled at the same rate as highly variable devices (such as a washing ma-chine). Instead, we employ several “smart polling” techniques to make better use of bandwidth, as described below.
Frequency-based polling. The first technique we consider is a modification
of round-robin polling in which devices are polled at different rates. Highly active devices may be polled more frequently in order to more accurately capture their behavior, while mostly static devices may be polled infrequently. Here, we define a device’s level of ‘importance’ as its frequency of energy state changes (i.e., power increases or decreases) that the device exhibits over a typical day. Given the state
change frequency for each outlet, our system polls each outlet at a rate proportional to its frequency, scaled such that the system continuously polls at a fixed global query rate (as in round-robin).
Event-driven polling. Our second technique makes use of a centralized “smart”
meter that monitors power for an entire building at high resolution. Such smart meters are widely available commercially, and are increasingly being installed by utilities: in 2011, nearly 500 utilities in the U.S. had collectively installed more than 37 million smart meters. In our deployment, we use an eGauge meter installed in the electrical panel, which measures building-wide average power usage as well as per-phase average voltage and frequency each second.
Given a centralized meter, event-driven polling analyzes live data from the meter to poll on-demand when energy changes (events) occur. Since the meter records aggregate energy, an energy event stemming from any individual device will be re-flected in the aggregate data. When an event is detected, a frequency-based polling round of individual outlets is conducted to attribute the event to a specific device, and stopped once the matching energy change is found. As a result, in most cases, only a subset of devices must be polled to identify the source of an event.
3.3.3 Smart Polling Evaluation
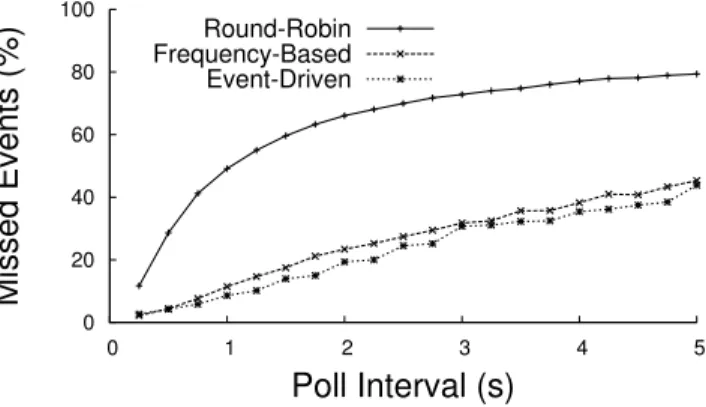
To evaluate the three polling approaches, we conduct a simulation study using real-world, device-level data gathered from our deployment. Our sample dataset consists of 24 hours of 1 Hz data from 22 distinct outlets. We replay this data while simulating polling at a variable rate and measure the number of ‘events’ captured in the resulting monitored traces, where an event is defined as a power change of at least 10W. The percentage of events missed for each of the three polling approaches is shown in Figure 3.6 as the polling interval is varied (here we assume that all polls are completely successful).
0 20 40 60 80 100 0 1 2 3 4 5 Missed Events (%) Poll Interval (s) Round-Robin Frequency-Based Event-Driven
Figure 3.6. Frequency- and event-driven polling capture more energy events than
basic round-robin polling.
We immediately see that the naive round-robin approach misses significantly more events (at least 2X) than the frequency-based or event-driven approaches. The poor performance of round-robin is largely due to a small number of highly-variable devices, such as a TV and washing machine. Smart polling compensate for these devices by polling them much more rapidly, which ensures that most events continue to be captured. Notably, frequency-based polling performs nearly as well as event-driven polling despite its lack of a building-wide smart meter.
The key benefit of event-driven polling is that polling may be stopped completely when no events are occurring. Figure 3.7 shows the aggregate bandwidth consumption over the course of the (simulated) day using the event-driven approach. While round-robin and frequency-based polling both poll continuously (effectively using 100% of available bandwidth), the event-driven polling employs far fewer polls — less than 20% — to achieve the high accuracy seen in Figure 3.6. Thus, we expect the event-driven approach to scale well to large number of devices.
3.4
Summary
This chapter presents a general-purpose architecture for designing smart homes that provide robust capabilities for energy monitoring and data analysis. In
0 20 40 60 80 100 0 1 2 3 4 5 Bandwidth Usage (%) Poll Interval (s) Continuous Event-Driven
Figure 3.7. Event-driven polling drastically decreases the bandwidth required to
monitor a set of outlets.
lar, by combining a whole-house smart meter, a low-power home gateway server, and optionally a set of smart outlets, we can provide an efficient, flexible, and low-cost platform for smart home applications. We also discuss the challenges of providing high-resolution energy monitoring using home automation protocols such as Insteon, which are popular in smart homes but not generally designed for continuous monitor-ing. We present an approach to leverage HA protocols for monitoring through “smart polling” technqiues, and show that they outperform naive polling approaches in both monitoring accuracy (increased by 2X) and total bandwidth consumption (decreased by 80%).
CHAPTER 4
APPLIANCE LOAD MODELING
The rapid deployment of digital smart meters by electric utilities has resulted in the availability of substantial amounts of fine-grained electricity data for buildings and homes. For example, Pacific Gas and Electric now operates over nine million smart meters in California [46]. While today’s deployed smart meters typically measure average power usage at intervals ranging from fifteen minutes to an hour, the gran-ularity of data is trending downwards (e.g., some utilities already provide 5-minute data [47]), and commodity meters are available that measure and transmit, via the Internet, energy usage at intervals as small as every second [15, 55]. Combined with the emergence of “big data” cloud storage systems, these smart meter deployments are spurring renewed interest in analysis techniques for smart meter data. In this chapter, we present a flexible modeling framework for describing the energy use of modern devices that is more accurate than simpler models previously employed.
4.1
Background and Motivation
While prior research has made significant progress in deriving insights from smart meter data [6], one issue that often limits accuracy is the use of general, and often simplistic, load models. In particular, many prior techniques for analyzing and mod-eling building electricity data characterize loads using simple on-off models, which associate a small number of fixed power levels with the “on” state (often just one) and either no power usage, or some minimal amount, with the “off” state.
20 40 60 80 100 120 140 160 0 10 20 30 40 50 60 70 80 Power (W) Time (min) LCD TV
Figure 4.1. An LCD TV’s power usage varies rapidly, significantly, and
unpre-dictably while on, and does not conform to a simple on-off load model.
On-off models do have a number of advantages. For instance, they exactly capture many simple loads, including light bulbs and other low-power resistive devices with mechanical switches. In addition, on-off models allow researchers to describe buildings as state machines that associate each building state with a fixed power level (implying the set of loads that are on), and where state transitions occur whenever a load turns on or off. Characterizing buildings as state machines admits a plethora of analysis techniques. For instance, much prior work maps building state machines to Hidden Markov Models (HMMs), and applies HMM-based techniques, such as Viterbi’s algorithm [17, 58], to determine which loads are on in each state. In this case, using only a few (often two) power states per load is advantageous, since it minimizes the number of distinct power states for the entire building and reduces the complexity of analyzing the resulting state machine. Of course, even with only two power states per load, the number of building power states is still exponential in the number of loads, i.e., 2n for n loads. Thus, even assuming simplistic on-off load models, precise analysis may still be intractable, i.e., require enumerating an exponential number of states.
Unfortunately, while on-off load models are simple, they are often inaccurate, since they fail to capture the complex power usage patterns common to many loads. As a simple motivating example, Figure 4.1 shows a time-series of an LCD TV’s electricity
usage each second. In this case, the TV’s switched mode power supply (SMPS) causes power variations as large as 120 watts (W) by rapidly switching between a full-on and full-off state to minimize wasted energy. The magnitude of these variations is effectively random—determined by the color and intensity of the TV’s pixels. An on-off model clearly does not accurately capture the TV’s power usage. As a result, modeling the TV as an on-off load may complicate higher-level analysis techniques for smart meter data. For example, the TV may obscure the use of low-power loads, such as a 60W light bulb, since its power usage varies rapidly by >60W.
Our premise is that simple on-off models discard a significant amount of informa-tion that is potentially useful in analyzing data. As a result, here we focus explicitly on accurately characterizing and modeling a variety of common household loads. Our methodology is empirical: we i) gather fine-grained electricity usage data from dozens of loads across multiple homes, ii) characterize their behavior by distilling a small number of common usage attributes, and then iii) derive accurate load-specific models based on these attributes. One of our contributions is to show that a small number of model types, stemming from basic knowledge of power systems, accu-rately describe nearly all household loads. Thus, one of our goals is to highlight how many identifiable load attributes, which are well-known in power systems, manifest themselves in electricity data collected by smart meters. Our hypothesis is that ac-curate load models, which leverage domain knowledge from power systems, provide a foundation for designing new electricity data analysis techniques. In evaluating our hypothesis, we make the following contributions.
1. Empirical Data Collection and Characterization. We instrument a wide
variety of common electrical loads in multiple homes, and collect electricity usage data for each load, every second, for over two years. We show empirically that homes operate similar types of loads, e.g., lighting, AC motors, heating elements, electronic devices, etc., which results in significant commonality in
power usage profiles across loads. We then characterize the data to identify distinguishing attributes in per-load power usage, forming the building blocks of our models. While many of these attributes are well-known in power systems, we show how they manifest in sensor data.
2. Data Modeling Methodology. We use our empirical characterization to
construct a small number of load-specific model types. We show that our basic models, or a composition of them, capture nearly all household loads. Our models go beyond on-off models, by capturing power usage characteristics that i) decay or grow over time, ii) have frequent variations (as with the TV in Figure 4.1), iii) exhibit complex repetitive patterns of simpler internal loads, and iv) are composites of two or more simpler loads. We show that our models are significantly more accurate than on-off models, decreasing the root mean square error by as much as 8X for representative loads. Since our methodology is general, it is applicable to modeling other types of loads as well beyond those described in this chapter.
4.2
Empirical Data Collection and Characterization
A typical home consists of dozens of electrical loads, including heating and cooling equipment, lights, appliances of various kinds and electronic equipment. A partial list includes:
• Heating, cooling, and climate control equipmentsuch as a central air conditioner, window air conditioner, space heater, electric water heater, dehumidifier, fan, air purifier;
• Kitchen appliances such as an electric range, microwave, refrigerator, coffee maker, toaster, blender, dishwasher;
• Lighting including incandescent and fluorescent lights;
• Miscellaneous electronic devices such as a television, audio receiver, radio, bat-tery charger, laptop and desktop computer, and gaming console; and
• Other appliances such as a vacuum and carpet cleaner.
Despite their tremendous variety, most residential loads fall into one of a few ele-mental load types based on how they consume power in an alternating current (AC) system. In particular, loads are categorized as either resistive, inductive, capacitive, or non-linear based on how they draw current in relation to voltage, which in an AC system varies along a smooth sinusoidal pattern. These categories reveal prop-erties of the loads that we leverage in our models. Since many researchers outside of power systems may be unfamiliar with these load types, for each type of load we first review its salient characteristics. We then employ data collected from our smart home deployments (described previously in Chapter 3) to empirically characterize data from representative loads of each type. In doing so, we observe how the specific characteristics of these loads manifest themselves in the data.
4.2.1 Resistive Loads
Loads that consist of any type of heating element are resistive. Incandescent lights, toasters, ovens, space heaters, coffee makers, etc., are examples of common resistive loads in a home. Formally, if a load draws current along a sinusoidal pattern in the same phase as the voltage, i.e., the maximum, minimum, and zero points of the voltage and current sine waves align, then the load is purely resistive.
Figure 4.2 depicts a time-series of the power usage for five different resistive loads with heating elements: an incandescent light bulb, a toaster oven, a coffee maker, a sandwich press, and a pod coffee maker, e.g., a Keurig or Tassimo. In general, the power usage of these loads resembles a “step” when turned on, with usage that remains
relatively stable and flat. The incandescent light acts as a nearly perfect resistive load with a power usage equal to the bulb’s wattage. While the toaster oven, coffee maker, sandwich press, and pod coffee maker act similar to the light bulb, they experience an initial higher power usage that slowly decays to a relatively stable usage, highlighted in Figure 4.2. The initial high power is due to the large inrush (or surge) current that occurs as the device warms up and the resistance decreases, after which it stabilizes. Observation 1: Resistive loads exhibit stable power usage when turned on, with high-power heating elements exhibiting an initial surge followed by a slow decay to stable power.
4.2.2 Inductive Loads
AC motors are the most common and widely-used examples of inductive loads. Motors are the primary component of many household devices, including fans, vacuum cleaners, dishwashers, washing machines, and compressors in refrigerators and air conditioners. Formally, if a load draws current along a sinusoidal pattern that peaks afterthe voltage sine wave, i.e., the current waveform lags the voltage waveform, then the load is purely inductive.
Figure 4.3 depicts a time-series of the power usage for five inductive loads: a re-frigerator, a freezer, a central air conditioner (A/C), a vacuum cleaner, and a window A/C unit. All five loads operate AC motors. Unlike the resistive loads above, each inductive load experiences a significant, but brief, initial power usage. The surge is also due to inrush current that occurs when starting an AC motor, although it is typically much higher than for heating elements. Intuitively, the underlying reason is that, while heating elements heat up slowly, the rotor inside a motor must transition from completely idle to full speed within seconds. Power usage then exhibits either a decay or growth, depending on the motor’s operation, that eventually stabilizes. In contrast to resistive loads, motors exhibit small variations even during this “stable”
0 50 100 150 200 250 0 1 2 3 4 Power (W) Time (min) light 230 235 240 245 250 255 260 peak zoom 0 200 400 600 800 1000 1200 1400 1600 0 1 2 3 4 Power (W) Time (min) toaster 1420 1430 1440 1450 1460 1470 peak zoom
(a) Light bulb (b) Toaster
0 200 400 600 800 1000 0 1 2 3 4 5 6 7 8 9 10 Power (W) Time (min) coffee maker 880 900 920 940 960 980 1000 peak zoom 0 200 400 600 800 1000 1200 1400 1600 0 1 2 3 4 5 6 7 Power (W) Time (min) sandwich press 1360 1365 1370 1375 1380 1385 1390 1395 1400 peak zoom
(c) Coffee maker (d) Sandwich press
1480 1490 1500 1510 1520 1530 1540 0 200 400 600 800 1000 1200 1400 1600 0 1 2 3 4 5 Power (W) Time (min)
pod coffee maker
peak zoom
(e) Pod Coffee
Figure 4.2. Example resistive loads, demonstrating “step” behavior with a possible
initial surge and slow decay to a stable power level.
phase. For instance, the refrigerator shown in Figure 4.3(a) exhibits small fluctuations that repeat during each cycle of the compressor. The freezer, central A/C, vacuum cleaner, and window A/C depicted in Figures 4.3(b), (c), (d), and (e) all show an ini-tial spike followed by a sharper, smoother growth (central and window A/C) or decay