M. Papadrakakis, V. Papadopoulos, G. Stefanou (eds.) Crete, Greece, 24-26 June 2019
UNCERTAINTY QUANTIFICATION OF OPTIMAL THRESHOLD
FAILURE PROBABILITY FOR PREDICTIVE MAINTENANCE USING
CONFIDENCE STRUCTURES
Adolphus Lye1, Alice Cicirello2, and Edoardo Patelli1 1Institute for Risk and Uncertainty, University of Liverpool University of Liverpool, Chadwick Building, Liverpool L69 7ZF
e-mail:{adolphus.lye, epatelli}@liverpool.ac.uk
2 Dynamics, Vibration and Uncertainty (DVU) Lab, University of Oxford University of Oxford, Parks Road, Oxford OX1 3PJ
e-mail: [email protected]
Keywords: Uncertainty Quantification, Confidence Structures, Predictive Maintenance, Opti-mization, Maintenance Cost, Negative Binomial Distribution, Plasma Etching.
Abstract. This paper seeks to analyze the imprecision associated with the statistical modelling method employed in devising a predictive maintenance framework on a plasma etching cham-ber. During operations, the plasma etching chamber may fail due to contamination as a result of a high number of particles that is present. Based on a study done, the particle count is observed to follow a Negative Binomial distribution model and it is also used to model the probability of failure of the chamber. Using this model, an optimum threshold failure probability is de-termined in which maintenance is scheduled once this value is reached during the operation of the chamber and that the maintenance cost incurred is the lowest. One problem however is that the parameter(s) used to define the Negative Binomial distribution may have uncertainties associated with it in reality and this eventually gives rise to uncertainty in deciding the optimum threshold failure probability. To address this, the paper adopts the use of Confidence structures (or C-boxes) in quantifying the uncertainty of the optimum threshold failure probability. This is achieved by introducing some variations in the p-parameter of the Negative Binomial dis-tribution and then plotting a series of Cost-rate vs threshold failure probability curves. Using the information provided in these curves, empirical cumulative distribution functions are con-structed for the possible upper and lower bounds of the threshold failure probability and from there, the confidence interval for the aforementioned quantity will be determined at50%,80%, and95%confidence level.
1 INTRODUCTION
Predictive maintenance (PdM) is the technique which seeks to predict the time in which a maintenance of an equipment is to be carried out through the monitoring of its operating conditions in real-time. A key advantage of PdM over the conventional practice of preventive maintenance (PM) is that PdM allows for the lowering of maintenance costs owing to the fact that maintenance is conducted only when necessary instead of on a routine basis as observed in the case of PM [1]. This is the basis on which the literature by Ducet al. [2] is written.
In this conference paper, a case-study based on this literature will be presented in section 2.1 with a study of the statistical modelling method employed in devising a PdM framework on a plasma etching chamber. This devised framework seeks to determine an optimized threshold failure probability (PrF) beyond which, maintenance is performed on the chamber. The statis-tical model adopted, however, contains a parameter which was determined with a significant degree of uncertainty. As such, the research methodology proposed in this literature aims to investigate the effect of this uncertainty in determining the optimum PrF and the quantification of its associated uncertainty. This is achieved using Confidence boxes (or C-boxes) to which details will be provided in section 3.1. Using this tool, the2-sided confidence interval of the op-timum threshold PrF can be determined and it will be attained at50%,80%, and95%confidence level.
2 CASE-STUDY: PLASMA ETCHING CHAMBER
2.1 Background
In his paper, Duc starts off by highlighting the key reasoning behind the decrease in the production yield of the plasma etching chamber, and therefore its reliability, being the presence of particles on the wafer [3]. These particles are generated as by-product of the plasma etching process [4] and its amount can be monitored via the Particle per Wafer Pass (PWP) method [5]. However, only particles exceeding a specified size are recorded in the total particle count.
Next, Duc identifies the stochastic nature associated with the total particle count based on data obtained over 8-months of chamber operation and models it to follow a Negative Binomial distribution [6] as shown below:
P(Y =y) = Γ(y+r)
y!·Γ(r) ·p
r·(1−p)y (1)
In Equation (1),yindicates the random variable for particle count,rindicates the number of runs by the chamber in which the particle count is zero,pindicates the probability of the particle count being zero within a single run, and Γ()represents the Gamma function [7]. According to the literature, the value of r was determined to be2.2608 (rounded down to 2) while that of p was determined to be 0.039 (±30%) [2]. Based on these information, he then derives a cumulative distribution function to model the PrF of the chamber. Here, failure is defined as the event in which the particle count reaches or exceeds a certain threshold value,kt. As such, the
mathematical expression for the PrF is as follows:
P(Y ≥kt) =
∞
X
k=kt
P(Y =k) (2)
To ensure cost-effectiveness, a threshold PrF has to be set such that upon reaching this value, the plasma etching chamber undergoes a scheduled maintenance. This threshold value of PrF
cannot take values which are either too small or too large. A small threshold value would mean that maintenance would now have to be performed more frequently resulting in high maintenance costs. A large threshold value, on the other hand, would imply that the chamber is allowed to operate for a longer duration without maintenance but this increases the occurrence of failure due to high particle count which leads to a loss in production yield and earnings. As such, Duc proceeds to devise a method to determine the optimum value of threshold PrF analytically.
2.2 Methodology
In the literature, he introduces a new quantity called the Cost-rate,g, which is defined to be the mean total costs associated with maintenance and particle count failures,C, divided by the total time between two successive scheduled maintenance, T. This value of T would depend on the value of PrF that is set. Further details to the calculation of C and T can be found in reference [2]. From there, Duc proceeds to tabulate the values ofg for the respective values of threshold PrF and plots a graph to illustrate the relationship between these two quantities. The result is as shown in the next section.
2.3 Results
Figure 1: Graph of Cost-rate,g, against threshold PrF. Image obtained from [2].
Based on the results illustrated in Figure 1, the optimum threshold PrF corresponds to the value at which theC is at a minimum. From this, the optimum threshold PrF is determined to be 0.16 [2]. This implies that a scheduled maintenance is performed once the PrF of the plasma etching chamber reaches16%during its operation.
3 PROPOSED FRAMEWORK 3.1 Concept of C-boxes
C-boxes are structures which serve to provide a generalized approach in producing confi-dence distributions. They can be used as a tool to estimate values of fixed, real-valued quantities obtained through random sampling and contains information of its Neyman-Pearson confidence at every level of confidence [9]. Unlike traditional confidence intervals, C-boxes can be prop-agated via mathematical calculations and can be used in calculations to produce results with identical confidence interval interpretation. From there, it is able to reflect both the uncertainty associated with the sampled quantity which stems from the process of inferring observations as well as the effects of imprecision in the data and demographic uncertainty which comes from the process of characterizing a continuous parameter based on discrete observations. One sig-nificant advantage of C-boxes is that it can be constructed even if the distribution of the sampled quantity is unknown [10] which makes it the favoured method to perform uncertainty quantifi-cation for the purpose of this research. More details to the theory of C-boxes can be found in reference [9].
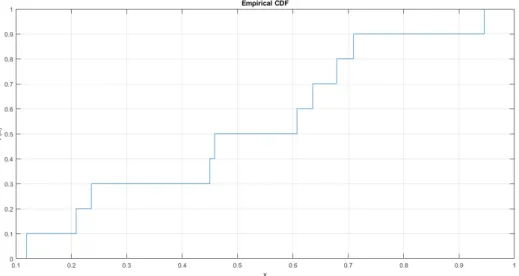
A C-box can be constructed using one of the two forms of cumulative distribution functions (CDFs): Continuous or Empirical. In this paper, the latter is used given that the distribution to which the parameterpfollows is unknown. Empirical CDFs can be described as a step-function which jumps up by 1nunit of probability at each of thendata points wherenis the total number of data available [11]. Like continuous CDFs, the value of the cumulative probability increases with the value of the data point. A simple illustration of an empirical CDF is provided below as an example:
Figure 2: Empirical CDF curve obtained forx∈ {0.1994,0.2089,0.2362,0.4501,0.4587,0.6073,0.6358,0.6790, 0.7093,0.9452}. As seen in the image, the cumulative probability,F(x), increases by101 with each value ofx.
For a set of data x with its associated uncertainty, each data consists of a lower bound, x, and an upper bound value,x. Based on these information, the empirical CDF for the lower bound values (the Belief function),F(x), and the upper bound values (the Plausibility function), F(x), can be plotted simultaneously. This gives rise to an interval which exists between F(x)
resulting plot is a C-box structure. To determine a two-sided confidence interval of a parameter θat1−αconfidence level,θis such thatF(θ) = α2 whileθis such thatF(θ) = 1− α
2.
3.2 Methodology
The proposed methodology in this conference paper seeks to supplement the work by Ducet al. by introducing some “noise” into a key parameter within the Negative Binomial distribution model and then observing its effects in the determination of the optimum threshold PrF and its associated uncertainty. As seen in Equation (1), the Negative Binomial distribution is defined by two parameters: r andp, whose respective values can be found in section 2.1. Given that it was mentioned that the value ofphas an upper and lower bound of30%, this provides a degree of uncertainty inpwhich can be adopted to realize the outcome of this research.
To perform the investigation, 20 sets of values of threshold PrF and Cost-rate will first be extracted from the Cost-rate vs threshold PrF curve in Figure 1 using the Getdata Graph Dig-itizer software [8]. The obtained values of threshold PrF will serve as references to obtain the approximate values ofktfrom the PrF function shown in Equation 2 with parametersr = 2and
p = 0.039. This process is done using Wolfram Mathematica and the results are presented in Table 1 of section 3.3.
Next, an assumption will be made that the Cost-rate,g, is only affected bykt. This is because
physically, it is the amount of particles which will determine the machine down-time due to the duration of cleaning. In essence, the more particles there are, the longer time it takes to clean, the longer the down-time and the higher the costs incurred due to failure (excluding the costs from scheduled maintenance), thus increasingg. With this in mind, new threshold PrF values will be obtained for the respective values ofktvia Equation (2) for different values ofpwhiler
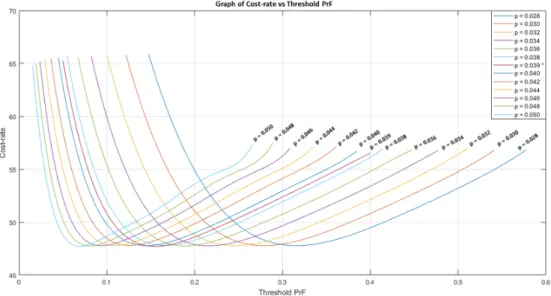
is kept at2. The values ofpare chosen such that they are within the aforementioned upper and lower bounds with respect to the derived value of0.039. As such, pwill take values ranging between 0.028 to 0.050 in steps of 0.002. For each value of p, a graph of Cost-rate, g, vs threshold PrF will be plotted in similar fashion to Figure 1. This would yield a family of curves for all13values ofpas shown in Figure 3 of section 3.3. From there, the optimum threshold PrF for each of these curves and its range of values of the threshold PrF will be determined graphically. The results are summarized in Table 2 of section 3.3.
Finally, to perform the necessary uncertainty quantification associated with the optimum threshold PrF values, C-boxes will be constructed with empirical CDFs of the lower bounds, upper bounds, and the optimum threshold PrF using the data presented in Table 2. The resulting C-box diagram is illustrated in Figure 4 of section 3.3.
3.3 Results Threshold PrF kt Threshold PrF kt 0.05642 115 0.18401 78 0.06426 111 0.20825 73 0.07424 107 0.22607 71 0.08422 103 0.24817 67 0.09420 99 0.26955 65 0.10346 96 0.29735 61 0.11986 91 0.31731 59 0.13055 89 0.33299 57 0.14908 84 0.36365 54 0.16548 81 0.39644 51
Table 1: Results forktand its respective values of threshold PrF for the default parameter values ofr = 2and
p= 0.039.
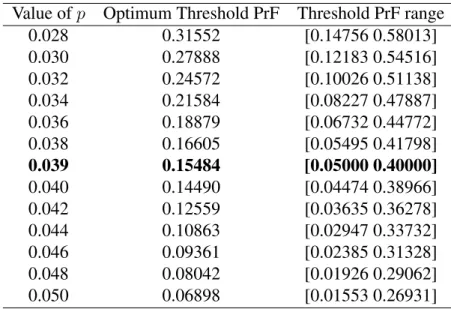
Value ofp Optimum Threshold PrF Threshold PrF range 0.028 0.31552 [0.14756 0.58013] 0.030 0.27888 [0.12183 0.54516] 0.032 0.24572 [0.10026 0.51138] 0.034 0.21584 [0.08227 0.47887] 0.036 0.18879 [0.06732 0.44772] 0.038 0.16605 [0.05495 0.41798] 0.039 0.15484 [0.05000 0.40000] 0.040 0.14490 [0.04474 0.38966] 0.042 0.12559 [0.03635 0.36278] 0.044 0.10863 [0.02947 0.33732] 0.046 0.09361 [0.02385 0.31328] 0.048 0.08042 [0.01926 0.29062] 0.050 0.06898 [0.01553 0.26931]
Table 2: Results for optimum threshold PrF and the range of threshold PrF for the respective values ofp.
3.4 Discussion
Based on the C-box constructed, the confidence interval for the value of threshold PrF can be determined at50%,80%, and95%confidence level and the results are summarized in Table 3 below:
Confidence level Confidence interval of threshold PrF 50% [0.02947 0.47887]
80% [0.01926 0.54516] 95% [0.01553 0.58013]
Table 3: Confidence interval of threshold PrF for the respective level of confidence.
The results above could serve as a guide for the industry in the decision–making of suitable value of threshold PrF under uncertainty and from there, devise and compare the numerous PdM plan for the plasma etching chamber based on the range of threshold PdF chosen as well as the respective maintenance costs associated with the respective PdM plan.
4 CONCLUSION
This paper has addressed the problem of quantifying the uncertainty associated with the optimum threshold PrF as a result of the uncertainty in the determination ofpwhich is a key parameter of the Negative Binomial distribution model as seen in Equation (1). In summary, the threshold PrF values are calculated for the respective values of kt using different values
of p whilst assuming that the Cost–rate is only affected by kt. From there, the Cost–rate vs
threshold PrF curves are plotted for the different values ofpand the information illustrated in the family of curves is then used to construct the C-box structure. Using the C-box structure, the confidence interval of the optimum threshold PrF value is obtained at50%,80%, and95%
confidence level.
ACKNOWLEDGEMENTS
This research is made possible with the guidance and insights to the concepts from Dr Alice Cicirello and Dr Edoardo Patelli who are also co-authors of this paper. In addition, we would also like to express our sincere gratitude to the Institute for Risk and Uncertainty for providing the facilities and resources necessary for this research to take place. Finally, we would also like to acknowledge the Singapore Nuclear Research and Safety Initiatives (SNRSI) for the sponsorship and the financial support without which the undertaking of this PhD programme would not have been possible.
REFERENCES
[1] R. K. Mobley, An Introduction to Predictive Maintenance, Second Edition. Amsterdam: Butterworth-Heinemann, 2002. ISBN: 9780750675314.
[2] L. M. Duc, C. M. Tan, M. Luo, & I. C. Leng, Maintenance Scheduling of Plasma Etching Chamber in Wafer Fabrication for High-Yield Etching Process. IEEE Transactions on Semiconductor Manufacturing,27(2), 204–211, 2014. doi: 10.1109/tsm.2014.2304461 [3] T. Moriya, H. Nakayama, H. Nagaike, Y. Kobayashi, M. Shimada, & K. Okuyama, Particle
Reduction and Control in Plasma Etching Equipment.IEEE Transactions on Semiconduc-tor Manufacturing,18(4), 477–486, 2005. doi: 10.1109/tsm.2005.858464
[4] H. Jansen, H. Gardeniers, M. D. Boer, M. Elwenspoek, & J. Fluitman, A Survey on the Reactive Ion Etching of Silicon in Microtechnology.Journal of Micromechanics and Mi-croengineering,6(1), 14–28, 1996. doi: 10.1088/0960-1317/6/1/002
[5] K. Reinhardt, & W. Kern,Handbook of Silicon Wafer Cleaning Technology, Third Edition. William Andrew, 2018. ISBN: 9780323510844.
[6] R. A. Fisher, The Negative Binomial Distribution.Annals of Human Genetics,11(1), 182– 187, 1941. doi: 10.1111/j.1469-1809.1941.tb02284.x
[7] P. J. Davis, Leonhard Eulers Integral: A Historical Profile of the Gamma Function. The American Mathematical Monthly, 66(10), 849–869, 1959. doi: 10.1080/00029890.1959.11989422
[8] H. Zein, V. L. H. Tran, A. Azmy, A. T. Mohammed, A. M. Ahmed, A. Iraqi, & N. T. Huy, How to Extract Data from Graphs using Plot Digitizer or Getdata Graph Digitizer. 2015. doi: 10.13140/RG.2.2.17070.72002
[9] M. S. Balch, Mathematical Foundations for a Theory of Confidence Structures.
International Journal of Approximate Reasoning, 53(7), 1003-1019, 2012. doi: 10.1016/j.ijar.2012.05.006
[10] S. Ferson, M. Balch, K. Sentz, & J. Siegrist, Computing with Confidence: Imprecise Posteriors and Predictive Distributions. Sixth International Symposium on Uncertainty, Modeling, and Analysis (ISUMA), 895–904, 2014. doi: 10.1061/9780784413609.091 [11] A. W. Van der Vaart, Cambridge Series in Statistical and Probabilistic Mathematics:
![Figure 1: Graph of Cost-rate, g, against threshold PrF. Image obtained from [2].](https://thumb-us.123doks.com/thumbv2/123dok_us/10977320.2985711/3.892.170.725.548.970/figure-graph-cost-rate-threshold-prf-image-obtained.webp)