location of the distributed generation sources
Noor Zaihah Jamal1,Mohd Herwan Sulaiman2 and Omar Aliman31 Faculty of Engineering Technology, Univesiti Malaysia Pahang, 26300 Gambang, Malaysia. 2,3 Faculty of Electrical & Eectronics Engineering, Univesiti Malaysia Pahang, 26600 Pekan,
Malaysia.
Abstract. In presence of the Distributed Generation (DG) brought new chal-lenges to the protection engineers since novel coordination scheme is no longer appropriate with the penetration of the DG. The extreme case is violation to the primary and backup relay selectivity constraint. This violation will have resulted to the degradation of the relay performance. Therefore, this paper proposes the best location of the DG penetration to decrease the effect of the DG presentation to the relay performance using the grey wolf optimization (GWO) algorithm. The impacts of the DG prior to the location of the insertion are implemented to the radial 7 bus test system. As a consequence, the best location of the DG penetra-tion is then identified.
Keywords: Grey wolf optimization, distributed generation, protection coordi-nation.
1
Introduction
Distributed generation (DG) are becoming an important backup source to the electrical distribution system due to reasons such as increasing power demand, environmental factor and advances in technology. On the other side of advantages of DG, it has op-posing effect to the distribution system, as the value of short circuit current increases depending upon its size, location and level of DG [1-3]. The type of DG insertion also has significant effect on the protection coordination problem.
Protective devices are to detect fault occurrences and remove the faulty section to ensure the reliability of the system is remaining as normal operation. Relay is widely used in power system protection at distribution and sub-transmission level. Coordina-tion among relays in a distribuCoordina-tion network is a complicated problem. The overall pro-tection scheme should be smart enough to ensure that a large part of the network gets un-interrupted power supply. In a case of fault at any feeder, the primary relay should be the first to react, whereas if it fails, the backup relay should play role to replace the operation. During this process, the selectivity constraint known as coordination time
interval (CTI) should be in consideration to ensure no redundancy of operation is oc-curring. If any of the CTI are violated, the coordination among the relay pairs are con-sidered fail.
Grey Wolf Optimization (GWO) algorithm was selected to be implemented for the coordination study. GWO was inspired from hunting mechanism and leadership hier-archy of grey wolves in nature. The GWO had been first introduced by Mirjalili [4]. In the grey wolves’ hierarchy, the first tier is nominated as a leader which known as alpha (α), next tier is beta (β), delta (δ) and followed by Omega (ω). The grey wolves’ hunt-ing activity is dedicated into three phases known as trackhunt-ing, encirclhunt-ing and attackhunt-ing the prey. The GWO has been reported to be very flexible and efficient in various areas [5-7]. The GWO algorithm is implemented to the original power distribution system (without presence of DG) to optimized the selection of the parameter of the time mul-tiplier setting (TMS) and plug setting (PS). This selection with regards to the several constraints as mention in section 3 will be the system’s novel coordination scheme. The scheme will be verified with the DG penetration to several locations to test the con-straints violation of CTI value. The less violation to the constraint of DG location will be testified as the best results.
2
DG integration problem
The integration of the DG to the conventional system will no longer maintain the exist-ing configuration such as fault current value. The problem arises from the fault current value is depends on location, size and type of the DG integrated to the system [8]. The additional voltage sources can cause higher value of the fault current which lead to the changes of the protection scheme. This modification will initiate sympathy trip and fuse blowing which lead to huge impact to the system reliability, damages to the components and decrease the productivity of the users [9]. The increasing short circuit value will also have affected the sizing of the cable, circuit breaker, relay, transformer size and etc.
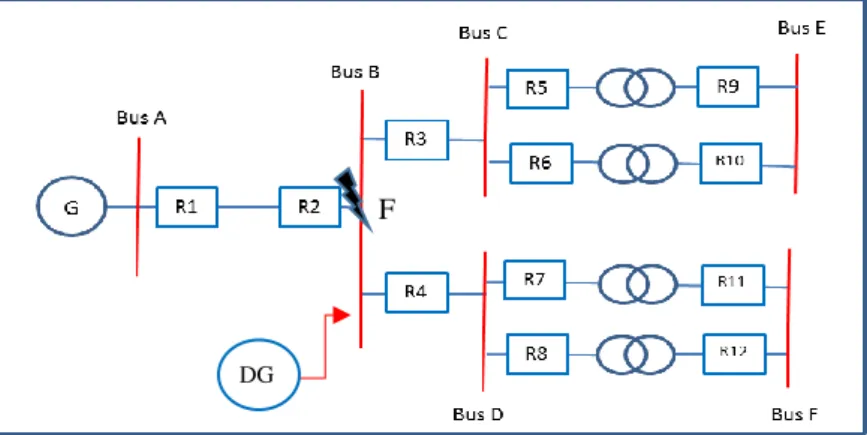
Basically, the protection scheme is accommodating with primary and secondary re-lay in order to response during fault occurrences to ensure the safety of the equipment and users. The requirement of the coordination time interval (CTI) in between primary and secondary relay should be followed to ensure no redundancy of the response relay had happened. The violation to the CTI value is known as coordination loss [10]. Dur-ing the integration of the DG, the relay will sense the different value of the short circuit current and as a result, the circuit breaker will trip either faster or slower from the pre-determined value in original scheme. As example, fault has occurred at bus E (see Er-ror! Reference source not found.), from the existing coordination scheme R9-R5 (pri-mary-backup) and R10-R6 (pri(pri-mary-backup). Due to the DG integration, the short cir-cuit current is increased, R9 and R10 will response to the fault faster than the existing predetermined value. This lead to the CTI violation for which the original scheme with-out DG is used. This modification will be affected protection coordination scheme in whole.
During the fault occurrence, the relay will sense and initiate the circuit breaker to break the line and isolate the faulty area from the system. When the fault is cleared, the system will automatically reconnect to the main line. However, with the DG integra-tion, the faulty portion of the system will be isolated from the main network due to natural condition. As an example, when fault occurs at point F (see Error! Reference source not found.), relay R2 will response and isolate the remaining line of bus B, D and F from the network and forming a micro grid fed by the DG (with assumption that the capacity of DG is sufficient for a stable operation for the new grid). If fault re-occurs during the isolation period at any point on bus B, D and F; short circuit current value sensed by the relay R4, R7, R8, R11 and R12 is low and suffer time delay in clearing the fault. The delaying in response time can cause a huge problem to the equipment, end user and protection device itself.
Fig. 1. Radial distribution system
3
Problem formulation
The objective of the optimization problem is to optimize the parameter of the time mul-tiplier setting (TMS) and plug setting (PS) in order to minimize the total operating time of the primary relay while maintaining the selectivity (coordination time interval (CTI)) value in between primary and backup relays with regards the location of the DG inte-gration.
3.1 Objective function
The objective function of the problem is expressed as below:
i m i
T
z
1min
(1) where m is the number of relays inside the system that need to be coordinated. Ti is the operating time of near end fault relay.DG
3.2 Characteristic curve
In this paper, normal inverse definite minimum time (IDMT) characteristic will be used according to IEC standard where k = 0.14 and α = 0.02. The relay time operating formulae is simplified as
1
*
i f i iPS
I
TMS
k
T
(2) where PSiis theplug setting, TMSi is the time multiplier setting, Ifis the fault current which may be seen by the respective relay.3.3 Inequality constraints
The time delay for all relays are determined by the TMS value where TMS minis mini-mum limit andTMS maxis maximum limit value of TMS. The bounds of TMS is varies from 0.1 to 1.1.
The current delay for all relays are determined by the PS value which given as: where
PS min and PS max are the minimum and maximum value of PS for respective relay. The boundary limit is 1.5 to 5. max min
TMS
TMS
TMS
(3) max minPS
PS
PS
(4) The Coordination time interval (CTI) value in between primary and back up relay must be fullfilled to ensure that relays are operating in sequence.CTI
Ti
Ti
bc
pr
(5) where Tibc is the back-up relay time operating, Tipr is primary relay time operating and CTI varies between 0.2s – 0.5s.
4
Simulation results
The 11kV radial distribution system has been selected as the test system to study the impact of the location of the DG integration to the overcurrent coordination scheme. The size of the DG that was integrated to the system was chosen as refered to [11] (see
Error! Reference source not found.). The short circuit current has been calculated. The GWO algorithm was implemented to the chosen test system with maximum no. of iteration is 1000 with 30 agents. The 0.3s CTI value is considered. All simulations are
using MATLAB and executed on 2.3GHz with 8GB RAM and an intel core i5-6200U CPU.
Fig. 2. DG capacity for different distribution network [11]
4.1 Radial 7 bus test system.
The 11kV system consists of 7 bus with 8 lines and 8 overcurrent relays (see Error! Reference source not found.). Two cases of DG penetration was considered when the DG of 2MVA is penetrated to the bus A and bus C (nearer to the load). Value of the voltage drop due to the installation (such as material and length of the cable) of the DG will not be considered in this study. From this simulation, the best location (with less number of constraint’s violation) during the DG penetration is then analyzed. The CTI < 0.3s in between primary and back-up relay pair is considered as constraint’s violation.
Fig. 3. Schematic of the 7 bus test system
The following Error! Reference source not found. gives the optimize parameter of TMS and PS value which have been implemented with GWO algorithm for the original system (without DG integration). From the stated CTI value, it can be seen that without DG insertion, there were no CTI violation and it had fulfilled the selectivity constraint. However, the CTI value have been violated during DG presentation inside the system (see Error! Reference source not found.).
During the DG integration at bus A, the violation of the CTI value can be clearly seen at relay no. 1 with the decreasing value of 0.02s. The decreasing value of CTI were worsen at relay no. 7 and 8. However, for DG integration at bus C, the CTI violations
only started at relay no. 3 without interfering the upstream relay. The CTI value were worsen at the relay no. 7 and 8.
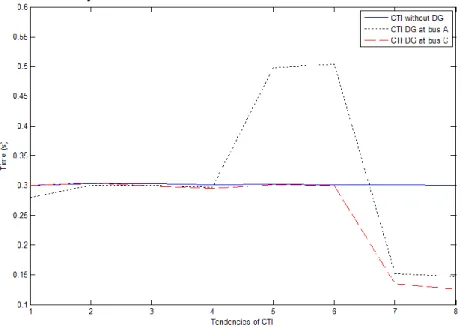
Table 1. CTI value for system without DG, with DG at bus A and bus C
Relay no. TMS PS CTI Without DG With DG at bus A With DG at bus C 1 0.6383 0.5263 0.3000 0.2800 0.3000 2 0.4990 0.5181 0.3031 0.2999 0.3040 3 0.3508 0.7189 0.3037 0.3008 0.2995 4 0.3911 0.5139 0.3011 0.2973 0.2955 5 0.2009 0.5467 0.3021 0.4978 0.3009 6 0.1934 0.6190 0.3014 0.5046 0.3008 7 0.1002 0.5913 0.301 0.1523 0.1346 8 0.1006 0.6349 0.3005 0.1474 0.1254
It can be concluded that, the best location of the DG penetration is at bus C since less number of relays are disturbed with less violation to the CTI value
Fig. 4. Tendencies of CTI
5
Conclusion
The DG integration to the distribution network surely have numerous benefits but on the adverse side it also degraded the existing protection scheme and affected the sensi-tivity and selecsensi-tivity sequence in between primary and backup relay during fault occur-rences. The degradation varies depends on the location of the DG penetration.
Thefore, studying the location of the DG integration using GWO algorithm manage to re-duce the impact to the CTI violations and lessen the numbers of relays affected by the increasing short circuit value. The scheme is robust and appropriate to be implemented for future system operational and topology revolutions.
Acknowledgements
This work was supported by Universiti Malaysia Pahang under grant no. RDU1803101,
References
1. Zhan, H., et al., Relay Protection Coordination Integrated Optimal Placement and Sizing of Distributed Generation Sources in Distribution Networks. IEEE Transactions on Smart Grid, 2016. 7(1): p. 55-65.
2. Bastiao, F., P. Cruz, and R. Fiteiro. Impact of distributed generation on distribution networks. in 2008 5th International Conference on the European Electricity Market. 2008.
3. Britto, T.M.d., et al. Distributed generation impacts on the coordination of protection systems in distribution networks. in 2004 IEEE/PES Transmision and Distribution Conference and Exposition: Latin America (IEEE Cat. No. 04EX956). 2004.
4. Mirjalili, S., S.M. Mirjalili, and A. Lewis, Grey Wolf Optimizer. Advances in Engineering Software, 2014. 69: p. 46-61.
5. Sulaiman, M.H., et al., Using the gray wolf optimizer for solving optimal reactive power dispatch problem. Applied Soft Computing, 2015. 32(0): p. 286-292.
6. Panagant, N. and S. Bureerat, Truss topology, shape and sizing optimization by fully stressed design based on hybrid grey wolf optimization and adaptive differential evolution. Engineering Optimization, 2018: p. 1-17.
7. Moazami Goodarzi, H. and M.H. Kazemi, An optimal autonomous microgrid cluster based on distributed generation droop parameter optimization and renewable energy sources using an improved grey wolf optimizer. Engineering Optimization, 2017: p. 1-21.
8. Chaitusaney, S. and A. Yokoyama. Impact of protection coordination on sizes of several distributed generation sources. in 2005 International Power Engineering Conference. 2005.
9. Shih, M.Y., et al. Mitigating the impact of distributed generation on directional overcurrent relay coordination by adaptive protection scheme. in
2016 IEEE 16th International Conference on Environment and Electrical Engineering (EEEIC). 2016.
10. Shih, M.Y., et al., An Adaptive Overcurrent Coordination Scheme to Improve Relay Sensitivity and Overcome Drawbacks due to Distributed Generation in
Smart Grids. IEEE Transactions on Industry Applications, 2017. PP(99): p. 1-1.
11. N.Jenkins, Embedded Generation. Energy Engineering Series. 2000: Instritution of Engineering and Technology.
![Fig. 2. DG capacity for different distribution network [11]](https://thumb-us.123doks.com/thumbv2/123dok_us/10949227.2983457/5.892.263.651.265.440/fig-dg-capacity-different-distribution-network.webp)