Cape Town Container Terminal Case study
Lilian Potgieter
Thesis presented in fulfilment of the requirements for the degree of Masters of Commerce in
Logistics Management in the Faculty of Economics and Management Sciences at Stellenbosch
University
Supervisor: Dr Leila Goedhals-Gerber
Co-Supervisor: Prof Jan Havenga
i
Declaration of Originality
By submitting this thesis electronically, I declare that the entirety of the work contained therein is my own, original work, that I am the sole author thereof (save to the extent explicitly otherwise stated), that reproduction and publication thereof by Stellenbosch University will not infringe any third party rights and that I have not previously in its entirely or in part submitted it for obtaining any qualification.
Lilian Potgieter Date: ……….
Copyright © 2016 Stellenbosch University All rights reserved
ii
Abstract
Supply chains, both complex and simple, are often exposed to various levels of risk stemming from different sources. These risks, whether minor or critical, require a certain level of management to mitigate and control frequency and overall impact. The South African maritime industry suffers from a number of risks, with the most prominent source of risk stemming from vessel and vehicle congestion within port terminals. In most cases, this is due to a lack of port capacity, lack of operator productivity, severe weather conditions and/or system-related challenges.
In South Africa, one of the most important ports – the Port of Cape Town – faces two risks associated with port congestion, namely, severe weather and system delays. These two risks place pressure on port management and can cause inefficiencies in both port operations and the operations of international shipping companies.
This study focuses on developing risk profiles of current and future port congestion within the Cape Town Container Terminal, with the primary objective being to highlight the importance of managing weather- and system-related port congestion within the container terminal. The secondary objective of the study is to suggest areas for future research on port congestion in other South African ports.
Overall, the purpose of this study is to offer some insight into port congestion as a risk to efficiency for the benefit of both South African ports and international shipping companies. The research conducted for this study was done in two phases, namely, exploratory secondary research followed by self-conducted primary research. The secondary literature research provided background information on the maritime industry, the Port of Cape Town, and port congestion in the World and in South Africa specifically. In addition, the primary data collected was used to analyse current port congestion within the container terminal, create forecasts of future congestion, and finally develop risk profiles of port congestion within the Cape Town Container Terminal specifically.
The findings of this study indicate that vessel related congestion, specifically anchorage congestion, is the main risk within the Cape Town Container Terminal, while landside port congestion is likely to become a less severe risk over time. This is, however, likely to be influenced by truck queuing time and the 2015 truck ban, which were not included in this study. The findings of this study indicate that maritime-side risk is of greater concern, and that risk mitigation strategies should be considered in the present and the future.
iii In conclusion, it is recommended that further research be conducted on the cost implications of port congestion, to determine the need for long-term financial investments, and on the impact of vehicle queuing and the proposed truck ban.
Furthermore, it is suggested that a similar study be conducted on port congestion within the Durban Port container terminal, as research indicates that this terminal is also prone to port congestion issues.
Keywords:
Cape Town Container Terminal; Container trucks; Ocean carriers; Operational risk; Port congestion; Risk profile; Weather and system-related port congestion.
iv
Opsomming
Voorsieningskettings, beide kompleks en eenvoudig, word gereeld aan verskeie grade van risiko uit verskillende bronne blootgestel. Hierdie risiko’s, hetsy klein of krities, benodig ‘n sekere vlak van bestuur om die frekwensie en algehele uitwerking te versag en te beheer. Die Suid-Afrikaanse maritieme industrie ervaar ‘n aantal risiko’s. Die mees prominente bron van risiko is die opeenhoping van skepe en voertuie binne hawens. In die meeste gevalle is dit as gevolg van ‘n tekort aan kapasiteit, lae arbeidsproduktiwiteit, swaar weersomstandighede en/of stelselverwante uitdagings.
Een van Suid-Afrika se belangrikste hawens – Kaapstad-hawe – staar twee risiko’s verwant aan hawe-opeenhoping in die gesig, naamlik swaar weersomstandighede en stelselvertragings. Hierdie twee risiko’s plaas druk op hawe-bestuur en kan ondoeltreffendhede in beide hawebedrywighede en vir internasionale skeepsmaatskappye veroorsaak.
Hierdie studie fokus op die ontwikkeling van risikoprofiele van huidige en toekomstige opeenhoping binne die Kaapstad-houerterminaal, met die primêre doel om die belangrikheid van die bestuur van weer- en stelselverwante opeenhopings binne die houerterminaal te beklemtoon. Die sekondêre doel van die studie is om toekomstige navorsing in hawe-opeenhoping in ander Suid-Afrikaanse hawens voor te stel.
In die algemeen was die doel van hierdie studie om insig te kry in hawe-opeenhoping as ‘n risiko tot doeltreffendheid, tot die voordeel van beide Suid-Afrikaanse hawens en internasionale skeepsmaatskappye.
Die navorsing vir hierdie studie het in twee fases plaasgevind, naamlik, ondersoekende sekondêre navorsing gevolg deur self-uitgevoerde primêre navorsing. Die sekondêre literatuurnavorsing verskaf agtergrondinligting oor die maritieme industrie, Kaapstad-hawe en hawe-opeenhoping in die wêreld en spesifiek in Suid-Afrika. Primêre data is gebruik om die huidige hawe-opeenhoping binne die haweterminaal te ontleed, vooruitskattings vir toekomstige opeenhoping te maak, en risikoprofiele van hawe-opeenhoping binne spesifiek die Kaapstad-houerterminaal te ontwikkel.
Die bevindinge van die studie dui daarop dat skeepverwante opeenhoping, meer spesifiek vasmeerplekopeenhoping, die vernaamste risiko in Kaapstad-houerterminaal is, terwyl landopeenhoping oor tyd ‘n mindere risiko sal word.
v Hierdie sal egter moontlik deur voertuigtoustaantyd en die 2015-trokverbod beïnvloed word wat nie in hierdie studie in berekening gebring is nie. Die bevindinge van hierdie studie dui daarop dat maritieme risikoverligtingstrategieë huidiglik en vir die toekoms oorweeg moet word.
Ten slotte word daar aanbeveel dat verdere navorsing oor die koste-implikasie van hawe-opeenhoping gedoen moet word om die behoefte aan langtermyn finansiële beleggings te bepaal, en om die impak van voertuie wat toustaan en die voorgestelde trokverbod te bepaal. Daar word ook voorgestel dat ‘n soortgelyke studie op hawe-opeenhoping binne die Durban-hawehouerterminaal gedoen word, aangesien navorsing daarop dui dat hierdie terminaal neig na hawe-opeenhopingsprobleme.
Sleutelwoorde:
Kaapstad-houerterminaal; Houervragmotors; Skeepsrederye; Operasionele risiko’s; Hawe-opeenhoping; Risiko profiel; Weer- en stelsel- verwante hawe-opeenhoping.
vi
Acknowledgements
First and foremost, I would like to express my sincere gratitude to Dr Leila Goedhals-Gerber, and on occasion Prof Jan Havenga, for their supervision, support and guidance throughout my Master’s degree. Dr Goedhals-Gerber’s quiet patience and immense knowledge was instrumental in securing research contacts and during the writing phases of my thesis.
In addition to my supervisor (and co-supervisor), I would like to thank the funders of my Master’s thesis, namely, the Department of Logistics at Stellenbosch and my father, for assisting me in accomplishing this esteemed academic achievement.
My sincere thanks also go to Prof Daan Nel who was kind enough to assist me with the statistical analysis and forecasting aspects of my study. Without his patience and assistance this study would not have been possible.
I thank the study participants who were both willing and able to assist in the completion of my Master’s thesis. The assistance of representatives from Transnet National Ports Authority, Transnet Port Terminals, Berry & Donaldson Shipping, Safmarine, Maersk Line and Mediterranean Shipping Company was vital to the successful completion of this study.
Last but not the least; I would like to thank my parents, my close friends and my devoted partner for their continuous support and motivation throughout the writing of this thesis and every other aspect of my life.
vii
Table of Contents
Declaration of Originality ... i Abstract ... ii Opsomming ... iv Acknowledgements ... viList of Figures ... xii
List of Tables ... xvi
List of Addendums ... xviii
List of Acronyms ... xix
Chapter 1: Introduction ... 1
1.1. Background Rationale for Study ... 1
1.2. Research Statement and Research Goals ... 3
1.3. Objectives of the Study ... 3
1.4. Significance of the Case study ... 4
1.5. Scope and Limitations of the Study ... 5
1.6. Assumptions in the Research ... 7
1.7. Reading Guide ... 8
Chapter 2: Research Design and Methodology ... 10
2.1. Secondary Research ... 10
2.2. Primary Research ... 11
2.2.1. Sampling ... 12
2.2.2. Research Instruments ... 13
2.2.3. Descriptive Analysis Methodology ... 16
viii
2.2.5. Risk Profile Methodology ... 26
2.2.6. Assumptions and Limitations of the Methodology ... 31
2.3. Closing Remarks ... 32
Chapter 3: Initial Literature Review ... 34
3.1. The Risk Concept ... 34
3.1.1. Risk Assessment and Profiling ... 35
3.1.2. Types of Risk ... 39
3.1.3. Risk in the Supply Chain ... 40
3.2. International and Containerised Trade ... 42
3.2.1. International Shipping Industry ... 43
3.2.2. Maritime Ports and Port related Risks ... 46
3.2.3. South African Context ... 50
3.3. Closing Remarks ... 55
Chapter 4: Port Congestion and Risk ... 56
4.1. Introduction to Port Congestion ... 56
4.2. Sources of Congestion ... 59
4.2.1. Maritime-side Congestion ... 60
4.2.2. Landside Congestion... 64
4.3. Risks and Consequences of Congestion ... 66
4.4. South African Context - Durban versus Cape Town ... 69
4.5. Closing Remarks ... 70
Chapter 5: Case Study Context – Port of Cape Town ... 71
ix
5.2. Current Port Facilities and Operations ... 78
5.3. The Cape Town Container Terminal (CTCT) ... 82
5.3.1. Terminal Facilities and Operations ... 86
5.3.2. Types of Cargo and Containers ... 94
5.4. Port Congestion in the CTCT ... 95
5.4.1. CTCT Maritime-side Congestion ... 96
5.4.2. CTCT Landside Congestion ... 100
5.5. Future Plans for the Port of Cape Town ... 105
5.6. Closing Remarks ... 108
Chapter 6: Descriptive Data Analysis ... 110
6.1. Descriptive Statistics Results ... 110
6.1.1. Ship Turnaround Time Data ... 111
6.1.2. Truck Turnaround Time Data ... 120
6.1.3. Weather Delays Data ... 123
6.1.4. System Delays Data ... 127
6.2. Discussion of Results ... 129
6.2.1. Frequency of Port Congestion ... 129
6.2.2. Scheduling Impact of Port Congestion ... 137
6.3. Closing Remarks ... 143
Chapter 7: Forecasting Results and Discussion ... 147
7.1. Forecasts and Analysis ... 147
7.1.1. Forecasted Ship Turnaround Time ... 148
x
7.1.3. Forecasted Weather Delays ... 160
7.1.4. Forecasted System Delays ... 163
7.2. Discussion of Forecast Results ... 165
7.2.1. Forecasted Frequency of Port Congestion ... 165
7.2.2. Forecasted Scheduling Impact of Port Congestion ... 170
7.3. Closing Remarks ... 175
Chapter 8: Risk Profile and Discussion ... 179
8.1. Risk Assessment ... 179
8.1.1. Risk Quantification and Prioritisation ... 179
8.1.2. Risk Evaluation ... 188
8.2. Risk Profile and Discussion ... 192
8.3. Closing Remarks ... 195
Chapter 9: Conclusions, Implications and Recommendations ... 197
9.1. Summary of Findings ... 197
9.1.1. Current Port Congestion ... 197
9.1.2. Forecasted Port Congestion ... 198
9.1.3. Port Congestion Risk Profiles ... 200
9.2. Conclusions ... 200
9.2.1. Ship Turnaround Time Conclusions (VAT, VBT and VWT) ... 200
9.2.2. Truck Turnaround Time Conclusions ... 201
9.2.3. Weather Delays and System Delays Conclusions ... 202
9.2.4. Port Congestion Risk Profile Conclusions ... 203
xi 9.4. Final Closing Remarks ... 213 Chapter 10: Bibliography ... 214 Chapter 11: Addendums ... 224
xii
List of Figures
Figure 2-1: The bow-tie risk assessment method ... 26
Figure 2-2: Risk “heat-map” ranking system for port congestion ... 30
Figure 3-1: The bow-tie risk assessment method ... 36
Figure 3-2: Risk “frontier” map method ... 37
Figure 3-3: Risk “heat-map” method ... 38
Figure 3-4: Risk Categories ... 40
Figure 3-5: Supply Chain Risk Categories ... 41
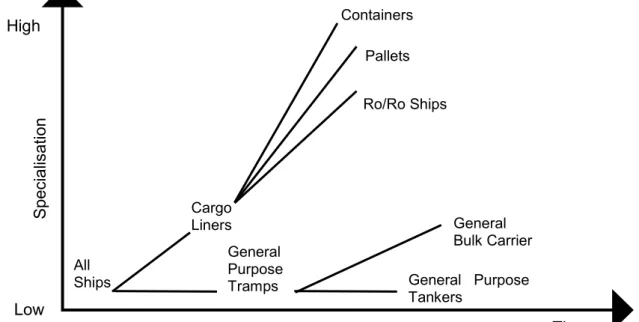
Figure 3-6: Specialisation of vessels over time ... 44
Figure 3-7: Container Vessel Growth, past 50 years. ... 45
Figure 3-8: Ports at the heart of the logistics supply chain ... 47
Figure 3-9: Container terminal layout showing different functions ... 48
Figure 3-10: Cargo flows around Africa – A World perspective ... 51
Figure 3-11: Percentage of tons per cargo category handled by the Port of Durban ... 54
Figure 3-12: Percentage of tons per cargo category handled by the Port of Cape Town ... 54
Figure 4-1: Select container ports with recently reported port congestion ... 57
Figure 4-2: Illustration of vessel time in port ... 62
Figure 4-3: Countries with congestion surcharges imposed by selected carriers ... 68
Figure 5-1: Original Port of the Cape trading station in the 1650’s ... 72
Figure 5-2: Upgrades to the Port of the Cape in the 1870’s ... 73
Figure 5-3: Reclamation of the foreshore and construction of the Victoria Basin in 1920 ... 74
Figure 5-4: Historical photograph of the Waterfront dock, early 1900s ... 74
Figure 5-5: Further upgrades to the Port of the Cape in 1935 ... 75
Figure 5-6: Construction of the Duncan Dock and other basins in 1945 ... 75
Figure 5-7: Cape Town foreshore in the late 1940’s ... 76
Figure 5-8: Construction of the Ben Schoeman Container Terminal in 1975 ... 76
Figure 5-9: Map illustrating upgrades done to the Port of Cape Town over time ... 77
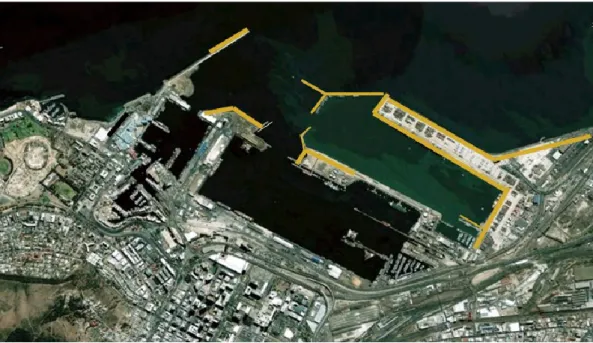
Figure 5-10: Aerial Photograph of the Port of Cape Town ... 78
Figure 5-11: Current facilities of the Port of Cape Town, 2015 ... 80
Figure 5-12: Port of Cape Town container volumes, 2011 - 2014 ... 82
Figure 5-13: Seasonal container volumes for the Port of Cape Town ... 83
Figure 5-14: Simple container flow through a port or terminal ... 83
Figure 5-15: Container flow through the four main terminal operation processes... 84
Figure 5-16: Container terminal processes ... 85
xiii
Figure 5-18: Aerial photograph of the Cape Town Container Terminal ... 87
Figure 5-19: Basic diagram of an anemometer ... 88
Figure 5-20: Super-post-Panamax cranes similar to those in the CTCT ... 89
Figure 5-21: Rubber Tyred Gantry Cranes, CTCT ... 90
Figure 5-22: Typical straddle carrier ... 91
Figure 5-23: Example of rail mounted gantry crane (RMG crane) at Coega Port ... 91
Figure 5-24: Typical reach stackers used in container terminals ... 92
Figure 5-25: Internal hauler and bathtub trailer at the CTCT ... 93
Figure 5-26: South-South Easterly wind direction ... 99
Figure 5-27: South, South Westerly wind direction diagram ... 99
Figure 5-28: Map of the Port of Cape Town, with entrances indicated ... 101
Figure 5-29: Northern CTCT entrance ... 102
Figure 5-30: Southern Christiaan Barnard entrance ... 102
Figure 5-31: Current layout of the Port of Cape Town, 2012-2015 ... 106
Figure 5-32: Long-term Expansion Plans for the CTCT, 2042+ ... 106
Figure 5-33: Artist’s impression of future Port of Cape Town ... 107
Figure 6-1: VAT outside the CTCT (2011 – 2015) ... 111
Figure 6-2: Histogram for VAT outside the CTCT (2011-2014) ... 114
Figure 6-3: VBT within the CTCT (2011 – 2015) ... 115
Figure 6-4: Histogram for VAT outside the CTCT (2011-2015) ... 117
Figure 6-5: VWT within the CTCT (2011 – 2015) ... 118
Figure 6-6: Histogram for VWT within the CTCT (2011-2015) ... 120
Figure 6-7: TTAT within the CTCT (2011-2015) ... 121
Figure 6-8: Histogram for TTAT within the CTCT (2011-2015) ... 123
Figure 6-9: Weather delays recorded within the CTCT (2011-2014) ... 124
Figure 6-10: Weather delays recorded in summer and winter months (2011-2014) ... 125
Figure 6-11: Histogram for weather delays recorded within the CTCT (2011-2014) ... 126
Figure 6-12: System delays recorded within the CTCT (2011-2014) ... 127
Figure 6-13: Histogram for system delays recorded within the CTCT (2011-2014) ... 128
Figure 6-14: Vessel anchorage incident percentage (2011 to 2015) ... 130
Figure 6-15: Vessel berthing incident percentage (2011 – 2015) ... 131
Figure 6-16: Vessel offloading and/or loading incident percentage (2011 – 2015) ... 132
Figure 6-17: Incident percentage for container trucks (2011 – 2015) ... 133
Figure 6-18: Percentage of weather-related incidences (2011 – 2014) ... 134
Figure 6-19: Percentage of weather delays in summer (2011-2014)... 135
Figure 6-20: Percentage of weather delays winter (2011-2014) ... 135
xiv
Figure 6-22: Average additional hours spent anchored outside the CTCT (2011-2015) ... 137
Figure 6-23: Average additional hours spent berthing within the CTCT (2011-2015) ... 138
Figure 6-24: Average additional hours spent offloading/loading within the CTCT (2011-2015) ... 139
Figure 6-25: Average additional minutes spent in the CTCT by container trucks (2011-2015) ... 140
Figure 6-26: Weather delays experienced within the CTCT (2011-2014) ... 141
Figure 6-27: Weather delays experienced in summer (2011-2014) ... 141
Figure 6-28: Weather delays experienced in winter months (2011-2014) ... 142
Figure 6-29: System delays experienced within the CTCT (2011-2014) ... 143
Figure 7-1: Forecast of VAT outside the CTCT (2016-2020) ... 148
Figure 7-2: Histogram of Forecasted VAT outside the CTCT (2016-2020)... 150
Figure 7-3: Forecast of VBT within the CTCT (2016-2020) ... 151
Figure 7-4: Histogram of Forecasted VBT within the CTCT (2016-2020) ... 153
Figure 7-5: Forecast of VWT within the CTCT (2016-2020) ... 154
Figure 7-6: Histogram of Forecasted VWT within the CTCT (2016-2020) ... 156
Figure 7-7: Forecasted TTAT within the CTCT (2016-2020) ... 157
Figure 7-8: Histogram of forecasted TTAT within the CTCT (2016-2020) ... 159
Figure 7-9: Forecasted average weather delays within the CTCT (2015-2019) ... 160
Figure 7-10: Forecasted weather delays in summer and winter months (2015-2019) ... 161
Figure 7-11: Histogram of forecasted weather delays within the CTCT (2015-2019) ... 162
Figure 7-12: Forecasted system delays in the CTCT (2015-2019) ... 163
Figure 7-13: Histogram of forecasted system delays within the CTCT (2015-2019) ... 165
Figure 7-14: Forecasted incident percentage for vessel anchorage (2016 – 2020) ... 166
Figure 7-15: Forecasted incident percentage for vessel berthing (2016 – 2020) ... 167
Figure 7-16: Forecasted incident percentage for vessel working time (2016 – 2020) ... 167
Figure 7-17: Forecasted incident percentage for container trucks (2016 – 2020)... 168
Figure 7-18: Forecasted percentage of weather delays (2015 – 2019) ... 169
Figure 7-19: Forecasted percentage of system delays (2015 – 2019) ... 170
Figure 7-20: Forecasted additional hours spent at anchorage (2016-2020) ... 171
Figure 7-21: Forecasted additional hours spent berthing within the CTCT (2016-2020)... 172
Figure 7-22: Forecasted additional hours spent working within the CTCT (2016-2020) ... 172
Figure 7-23: Forecasted additional minutes spent in the CTCT by container trucks (2016-2020) ... 173
Figure 7-24: Forecasted weather delays experienced in the CTCT (2015-2019) ... 174
Figure 7-25: Forecasted system delays experienced by ocean carriers and container trucks in the CTCT (2015-2019) ... 175
xv
Figure 8-1: Bow-tie model of maritime-side port congestion within the CTCT ... 180
Figure 8-2: Bow-tie model of landside port congestion within the CTCT ... 181
Figure 8-3: Risk “heat-map” of congestion experienced during vessel anchorage ... 189
Figure 8-4: Risk “heat-map” of congestion experienced during vessel berthing ... 190
Figure 8-5: Risk “heat-map” of congestion experienced during vessel offloading/loading ... 190
Figure 8-6: Risk “heat-map” of congestion experienced by container trucks ... 191
Figure 8-7: Risk “heat-map” of weather-related port congestion experienced by ocean carriers and container trucks ... 191
Figure 8-8: Risk “heat-map” of system-related port congestion experienced by ocean carriers and container trucks ... 192
xvi
List of Tables
Table 2-1: Study participant information ... 14
Table 2-2: Output of “descriptive statistics” Excel tool... 17
Table 2-3: Description of Statistical Notations ... 17
Table 2-4: Interpretation with regards to the frequency of port congestion ... 21
Table 2-5: Interpretation with regards to the scheduling impact of port congestion ... 22
Table 2-6: Description of Statistical Notations ... 25
Table 2-7: Template of risk severity calculations ... 27
Table 2-8: Coding system used for frequency (all data sets) ... 28
Table 2-9: Coding system used for time impact (additional time) in each data set ... 29
Table 2-10: Template for results of “heat-map” ranking system ... 30
Table 3-1: Top ten major Africa ports according to TEU’s handled annually (2013) ... 50
Table 3-2: Top ten export markets for the Western Cape based on total TEU’s (2013) ... 52
Table 3-3: Top ten import markets for the Western Cape based on total TEU’s ... 53
Table 4-1: Examples of port congestion (maritime-side versus landside) ... 59
Table 4-2: Summary of maritime-side port congestion literature ... 63
Table 4-3: Summary of landside port congestion literature ... 66
Table 5-1: Layout of the Port of Cape Town according to cargo type... 81
Table 5-2: Types of containers and percentage distribution ... 95
Table 5-3: Beaufort Wind Scale ... 97
Table 6-1: Descriptive statistics of VAT outside the CTCT (2011-2015) ... 112
Table 6-2: Frequency table for VAT outside the CTCT (2011-2015) ... 113
Table 6-3: Descriptive statistics of VBT within the CTCT (2011-2015) ... 116
Table 6-4: Frequency table for VBT within the CTCT (2011-2015) ... 116
Table 6-5: Descriptive statistics of VWT within the CTCT (2011-2015) ... 118
Table 6-6: Frequency table for VWT within the CTCT (2011-2015) ... 119
Table 6-7: Descriptive statistics of TTAT within the CTCT ... 122
Table 6-8: Frequency table for TTAT within the CTCT (2011-2015) ... 122
Table 6-9: Descriptive statistics of weather delays within the CTCT (2011-2014) ... 125
Table 6-10: Frequency table for weather delays within the CTCT (2011-2014) ... 126
Table 6-11: Descriptive statistics of system delays within the CTCT (2011-2014) ... 128
Table 6-12: Frequency tables for system delays within the CTCT (2011-2014) ... 129
Table 7-1: Descriptive statistics of forecasted VAT outside the CTCT (2016-2020) ... 149
Table 7-2: Frequency table for forecasted VAT outside the CTCT (2016-2020) ... 150
xvii
Table 7-4: Frequency table for forecasted VBT within the CTCT (2016-2020) ... 153
Table 7-5: Descriptive statistics of forecasted VWT within the CTCT (2016-2020) ... 154
Table 7-6: Frequency table for forecasted VWT within the CTCT (2016-2020) ... 155
Table 7-7: Descriptive statistics of forecasted TTAT within the CTCT ... 158
Table 7-8: Frequency table for forecasted TTAT within the CTCT (2016-2020) ... 159
Table 7-9: Descriptive statistics of forecasted weather delays (2015-2019) ... 161
Table 7-10: Frequency table for forecasted weather delays within the CTCT (2015-2019) . 162 Table 7-11: Descriptive statistics of forecasted system delays (2015-2019) ... 164
Table 7-12: Frequency tables for forecasted system delays within the CTCT (2015-2019) . 164 Table 8-1: Risk severity calculations for vessel anchorage outside the CTCT ... 182
Table 8-2: Risk severity calculations for vessel berthing within the CTCT... 183
Table 8-3: Risk severity calculations for vessel offloading/loading within the CTCT ... 183
Table 8-4: Risk severity calculations for container trucks within the CTCT ... 184
Table 8-5: Risk severity calculations of weather delays within the CTCT ... 185
Table 8-6: Risk severity calculations of system delays within the CTCT ... 186
Table 8-7: Risk prioritisation tables for VAT, VBT, VWT and TTAT ... 187
Table 8-8: Risk prioritisation for weather and system delays ... 188
Table 8-9: “Heat-map” ranking for current port congestion (2011 – 2014/15) ... 194
Table 8-10: “Heat-map” ranking of future port congestion (2015/16 – 2019/20) ... 194
xviii
List of Addendums
Addendum A: Interview template for port perspective of study ... 224
Addendum B: Interview template for shipping perspective of study ... 225
Addendum C: Ship turnaround time statistics (2011 – 2015) ... 226
Addendum D: Truck turnaround time statistics (2011 – 2015) ... 226
Addendum E: Weather delays statistics (2006 – 2014)... 227
Addendum F: System delays statistics (2009 – 2014) ... 227
Addendum G: A comparison of the Holt-Winters Forecast to the observed time series with details about the goodness of the fit for VAT ... 228
Addendum H: A comparison of the Holt-Winters Forecast to the observed time series with details about the goodness of the fit for the VWT ... 229
Addendum I: A comparison of the Holt-Winters Forecast to the observed time series with details about the goodness of the fit for the VBT ... 232
Addendum J: A comparison of the Holt-Winters method to the observed time series with details about the goodness of the fit for TTAT ... 233
Addendum K: Stellenbosch University Ethical Approval Form ... 235
Addendum L: Non-disclosure Agreement between Stellenbosch University and Transnet Port Terminals ... 242
xix
List of Acronyms
3PL’s Third Party Logistics Providers CTCT Cape Town Container Terminal
DHCA Durban Harbour Carriers’ Association
FPT Fresh Produce Terminal
GUI Graphical User Interface
GVM Gross Vehicle Mass
JIT Just In Time
MAD Mean Absolute Deviation
MPT Multi-Purpose Terminal
MSC Mediterranean Shipping Company
PSCD Port-related Supply Chain Disruptions
RMG Rail Mounted Gantry
RTG Rubber Tyred Gantry
SADC South African Development Community
SPARCS Synchronous Planning And Real-time Control System
SSE Sum of Squares for Forecast Error
TEU Twenty-foot Equivalent Unit
TFR Transnet Freight Rail
TNPA Transnet National Ports Authority
TOS Terminal Operating System
TPT Transnet Port Terminals
TTAT Truck Turnaround Time
VAT Vessel Anchorage Time
VBT Vessel Berthing Time
1
Chapter 1: Introduction
Maritime ports as a source of risk has long been an area of interest to both academics and those entities reliant on ports for trade purposes either internationally or coastally. The most prominent sources of risk specific to South Africa result from a lack of capacity, lack of productivity, severe weather conditions and port congestion (Richer, 2010:12).
This study centres on developing basic risk profiles of port congestion in South African ports and focuses on congestion within the Cape Town Container Terminal (CTCT) as a case study. The risk profiles focus on current port congestion, based on analysis of historical data, and future port congestion, based on five year forecasts. The purpose of the profiles is to highlight the importance of managing port congestion for the benefit of South African ports and international shipping companies.
This chapter briefly discusses background literature explaining the rationale behind the study and outlines the research problem statement and research objectives. Also discussed, is the significance of the study to the academic community, Transnet National Ports Authority (TNPA) and international shipping companies. Lastly, this chapter defines the scope and limitations of the research, including assumptions made and gives a brief outline of the chapters to follow.
1.1.
Background Rationale for Study
Risks stem from various sources in the supply chain and all organisations, be it sole proprietors or large international companies, require a certain level of risk management to mitigate and control these risks. The risk management techniques used can contribute to the overall success of organisations as major supply chain disruptions are avoided (Young, 2014:12).
Risks stemming from internal supply chain activities and the external environment can be either controllable or uncontrollable. These risks can also be domestic or foreign depending on the type of organisation. One such risk that international companies, such as shippers, dealing in imports and exports should consider relates to maritime ports. Maritime ports are a vital link in the international supply chain as they perform two important functions, namely their function as a gateway for global trade, and their position as logistics nodes linking maritime trade to inland transport modes.
2 South African maritime ports, such as the Port of Cape Town and the Port of Durban face a number of risks relating to capacity, productivity, port security, weather conditions and port congestion. All these risks place pressure on port management and can cause inefficiencies in both port operations and the operations of international shipping companies.
One of the most prominent risks experienced by South African ports is port congestion (Birkenstock, 2015; Davids, 2015 & Schultz, 2015:3). Unlike capacity, productivity and port security; port congestion is not taken as seriously during the risk management process. It is considered more a common daily occurrence than as a risk that could possibly be reduced. Port congestion is subsequently often not addressed in detail when port improvement and expansion plans are discussed as it is considered a “normal” daily occurrence.
In South Africa, the two most important ports are the Port of Durban and the Port of Cape Town, both of which experience port congestion at various times and due to various reasons. The Port of Cape Town is one of the most important maritime ports in South Africa as it facilitates the majority of trade within the Western Cape and acts as a multi-cargo port, servicing West Africa (De Wet, 2014:49). The majority of vessels serviced by the Port of Cape Town are container vessels, and these vessels must be serviced by a specialised container terminal (Transnet National Port Authority, 2013/14).
The container terminal at the Port of Cape Town faces two prominent risks, namely, severe weather conditions and port congestion. These two risks are, however, interlinked with port congestion resulting from the maritime-side (vessel related congestion) and the landside (container truck related congestion), which can cause major delays to both incoming and outgoing shipments. On the maritime-side, port congestion generally stems from severe weather conditions. These severe weather conditions include strong wind speeds, dense fog and large swells and are usually dominant over summer (December – February) and winter (June – August) months. However, as weather patterns are relatively unpredictable, one cannot plan based on this presumption, thus making maritime-side congestion relatively difficult to manage. With regards to the landside of the terminal, congestion is generally related to the movement of container trucks inside and outside the terminal as well as system-related challenges within the terminal. Container trucks are often subject to system delays and may face additional delays if the 2015 proposed truck ban1 is implemented in the future. Therefore, port congestion experienced on the maritime-side and the landside of the terminal should be considered in more depth during the risk management process.
3
1.2.
Research Statement and Research Goals
The primary problem statement of this study is defined as follows:
To investigate the scheduling impact and frequency of maritime-side and landside port congestion experienced within the Cape Town Container Terminal in order to develop basic risk profiles of current and future port congestion.
This research problem statement serves as a guide for the study and indicates the variables analysed, namely, maritime-side (vessel) congestion, landside (container truck) congestion, and congestion scheduling impact and frequency. The context of the study is also mentioned, with the case study taking place within the Cape Town Container Terminal (CTCT).
1.3.
Objectives of the Study
To satisfactorily answer the problem statement, the study has been subdivided into objectives. The primary objective of the study is to solve the research problem statement, but in addition, more detailed secondary objectives are required to assist in achieving this goal. These secondary objectives are as follows:
I. To investigate the current frequency of weather- and system-related congestion experienced by ocean carriers and container trucks.
II. To investigate the current scheduling impact of weather- and system-related congestion experienced by ocean carriers and container trucks.
III. To investigate the future frequency of weather- and system-related congestion likely to be experienced by ocean carriers and container trucks.
IV. To investigate the future scheduling impact of weather- and system-related congestion likely to be experienced by ocean carriers and container trucks.
V. To develop basic risk profiles of current and future port congestion. VI. To briefly investigate the implications of the 2015 proposed truck ban.
All these secondary objectives are conducted within the context of the CTCT. The profiles are based on present and forecasted data, which should increase the accuracy of the profiles and allow for the basic template of port congestion risk to be used for other South African ports.
4
1.4.
Significance of the Case study
Increasing volumes passing through the container terminals of many ports around the world continue to place pressure on both the capacity and operations of ports (Richer, 2010:12). In the case of the Port of Cape Town, current throughput volumes are ever increasing due to the expanding economy of the Western Cape (Transnet National Port Authority, 2013/14). This increasing demand for containerised goods places further strain on the terminal and its overall efficiency.
In addition to increased volume through the container terminal, the Port of Cape Town experiences severe weather conditions and system-related challenges, which impact the operational efficiency of the container terminal. These challenges relate to safety within the port, terminal operational efficiency, vessel congestion and vehicle congestion. These weather and system-related challenges have, according to David Davids2 from Transnet Port Terminals (TPT), become inherent working conditions of the terminal and are deemed an increasing risk to port efficiency by TPT (Davids, 2015).
Solutions to these challenges include terminal expansion, diversion of vessels, and terminal equipment adjustment amongst others. However, it is important to note that these solutions come with certain limitations and drawbacks. Terminal expansion, for example, is not currently a viable option due to the infrastructure of the port and surrounding city, although plans have been developed (Birkenstock, 2015).
Current infrastructure limits access to ports such as the Port of Cape Town and, along with weather- and systems related challenges can result in traffic bottlenecks and congestion. The potential implementation of the 2015 truck ban will likely exacerbate congestion further with queuing bottlenecks outside the port (Freight and Trading Weekly, 2015:12). These bottlenecks can negatively influence the efficiency of both port operations and the operations of international shipping companies reliant on the container terminal. Future expansion plans have been suggested to alleviate the current capacity constraints. These plans are currently underway at the Port of Durban; however, plans for the Port of Cape Town are set for the distant future. In the meantime, weather- and system-related port congestion remains an ever present risk to operational efficiency in Cape Town’s container terminal (Transnet National Port Authority, 2013/14).
5
1.5.
Scope and Limitations of the Study
For this research to be fully understood the scope and limitations of the study are discussed so as to avoid any misunderstandings regarding the size and context of the research.
This study was conducted within the container terminal of the Port of Cape Town for a number of reasons. Firstly, time and financial constraints on the researcher made the Port of Cape Town a more appropriate selection. The port is both accessible physically and has several individuals representing TNPA and TPT, willing to provide quantitative data and participate in qualitative interviews.
In addition to time and financial constraints, the Port of Cape Town was selected as future expansion plans for the container terminal are not set to begin until 2040. Durban port, however, is currently under expansion. The lack of expansion in the Port of Cape Town, in addition to increasing volumes of containers, places increased pressure on terminal facilities. This subsequently increases the likelihood of container truck bottlenecks and ocean carrier bunching.
The definition of port congestion used in this study focuses on weather- and system-related challenges which impact certain port operations and thus the turnaround of ocean carriers and container trucks. Port operations, in the case of this study, refer to those operations within the terminal such as berthing, loading, unloading and stacking of containers. These operations are divided between TNPA and TPT, and are discussed in further detail in section 5.2 of Chapter 5. Furthermore, this study emphasises the link between weather- and system-related issues and vessel/vehicle congestion, disregarding other factors which may influence congestion, such as human error or incompetence.
This study is further limited by the data collected during the course of the study. These limitations, along with methodology-related limitations are discussed in section 2.2.6 of Chapter 2.
The last consideration with regards to the scope and limitations of the research is timing. As discussed in section 1.1, the Port of Cape Town most commonly experiences severe weather conditions, and thus congestion, during specific times of the year. However, to develop a reliable and accurate risk profile, weather-related congestion experienced within a full one year period must be forecasted, thereby illustrating trends within weather-related port congestion forecasted for the future. System-related congestion challenges are similarly
6 experienced sporadically. Thus this study was conducted to not only include peak periods of congestion, but also congestion experienced throughout the course of a full business year.
7
1.6.
Assumptions in the Research
Along with the scope and limitations of the research it is important to clarify the assumptions made during the course of the research. This section highlights certain assumptions made with regards to key terminology and literature. Assumptions relating to the methodology of this study are discussed in section 2.2.6 of Chapter 2.
For the purpose of this study certain assumptions were made regarding specific definitions in literature. This included the two core concepts of the research - risk and port congestion. Risk and port congestion have a number of definitions derived by various academics and researchers, which can be seen in sections 3.1 and 4.1 of the literature review chapters. However, for ease of understanding, specific definitions were selected for this study and are described below.
Risk, for the purpose of this study, can be defined as the consequences and benefits organisations encounter when making business decisions within an environment of uncertainty (adapted from Purdy, 2010:882). These risks can be classified as either controllable or uncontrollable, with their degree of controllability determining the level of risk management required. Controllable risks can be managed through strategies designed for risk avoidance or elimination, while uncontrollable risks can only be managed if and when they occur with mitigation strategies.
The risks assessed and profiled in this case study are weather- and system-related port congestion. Port congestion in this case is deemed a manageable uncontrollable risk, as the occurrence of weather- and system-related issues are relatively unpredictable, whilst their impact is relatively constant and thus manageable. Chapter 3 discusses the theory of risk assessment, with specific reference to two measures, namely, risk frequency and risk impact. For the purpose of this study, the frequency of port congestion refers to the number of occurrences of weather- and system-related port congestion within the CTCT, whilst risk impact, or scheduling impact, refers to additional time spent in the CTCT due to weather delays or system delays. This is defined further to include the scheduling delays experienced by ocean carriers and container trucks.
With regards to this case study, port congestion can be defined as bottlenecks, delays and other supply chain disruptions caused by several different factors. These factors include insufficient capacity and productivity; bunching of vessels; vessel and vehicle scheduling clashes; severe weather conditions; and labour strikes (adapted from Schwitzer, Martens, Beckman & Sun Yoo. 2014).
8 This definition of port congestion is adapted further to disregard those factors not relating to weather- and system-related challenges and the movement of ocean carriers and container trucks. Therefore, other port congestion factors such as insufficient capacity and productivity, and human error and incompetence, are ignored. The CTCT currently operates at 70-80% capacity to ensure adequate space for the movement of containers into and out of the terminal, which minimises capacity-related congestion (Birkenstock, 2015).
This study was subsequently conducted under the assumption that port congestion within the CTCT is caused by weather- and system issues and results in delays in the turnaround time of ocean carriers and container trucks.
1.7.
Reading Guide
The presentation of this thesis is given chapter by chapter below and briefly describes the contents of each individual chapter.
Chapter 2: Research Design and Methodology
Chapter 2 outlines the proposed research design used and the specific research techniques and methods utilised to answer the research objectives discussed in section 1.3 with the intention of answering the problem statement. In addition, this chapter includes the sampling techniques, research instruments, and data analysis techniques used to analyse current and future port congestion. This assisted in the development of the general risk profiles of current and future port congestion within the CTCT.
Chapter 3: Initial Literature Review
Chapter 3 introduces literature on general concepts discussed in the study for the purpose of background and further understanding. These concepts include risk, international trade, shipping and containerised trade in both an international and a South African context.
Chapter 4: Port Congestion and Risk
Chapter 4 follows on from Chapter 3 with literature defining port congestion in general, and the potential sources of port congestion. The chapter also discusses how port congestion is a risk to efficient operations and closes with an introduction to port congestion in South African ports.
9
Chapter 5: Case study context - Port of Cape Town
Chapter 5 follows on from chapters 3 and 4 with literature pertaining to the context of the case study, namely, the history and current affairs of the Port of Cape Town. The chapter also takes a closer look at weather- and system-related port congestion experienced in the CTCT.
Chapter 6: Descriptive Data Analysis
Chapter 6 begins the data analysis portion of the thesis study with the analysis of current port congestion. The chapter includes a detailed descriptive analysis of the data collected, focusing specifically on the frequency of congestion and the scheduling impact of congestion. The chapter leads into the five year forecast of the future frequency and impact of port congestion.
Chapter 7: Forecasting Results and Discussion
Chapter 7 begins with a short introduction to the forecast analysis of future port congestion. The chapter goes on to introduce the five year forecasts of congestion in the context of the study. The chapter closes with a discussion of forecasted frequency and scheduling impact of port congestion expected to be experienced within the CTCT.
Chapter 8: Risk Profile and Discussion
Chapter 8 builds on Chapter 7 with a brief introduction to risk profiling and its significance to risk management. The chapter goes on to develop the risk profiles of port congestion based on current and forecasted data. The chapter briefly describes how the profile was developed and discusses the risk ranking which should be associated with current and future port congestion in the context of the study.
Chapter 9: Conclusions, Implications and Recommendations
Chapter 9 includes a brief summary of the findings of the research and discusses general conclusions regarding the main findings of the study. The chapter also details any implications the research may have and discusses recommendations for Transnet and shipping companies. The chapter closes with final remarks regarding the research and the study as a whole.
10
Chapter 2: Research Design and Methodology
The research of this study was done in two phases, namely exploratory secondary research followed by self-conducted primary research. This chapter is subdivided into two sections representing these two research phases. The first section briefly identifies the key concepts and academic literature used to outline the scope of the study and the rationale behind the problem statement. The second section focuses on the primary research required to answer the research problem presented in section 1.2 of Chapter 1.
2.1.
Secondary Research
The secondary research of this study includes the introduction and discussion of various concepts central to the understanding of the research. These concepts assist in highlighting the significance of the study and in the understanding of the results. For the purpose of this study, the secondary research, or literature review, is subdivided into three chapters for ease of reading and understanding.
The first literature chapter, Chapter 3, includes the initial literature review which introduces and defines concepts such as risk, supply chain risk, operational risk, international and containerised trade, and the shipping industry. The primary purpose of the chapter is to explain the importance of risk assessment and management, as well as discuss the significance of maritime ports with regards to international trade and shipping. The main argument of the chapter emphasises maritime ports as a source of risk and introduces the South African context, which leads into the next literature chapter on port congestion.
The second literature chapter, Chapter 4, continues the literature review with a discussion on port congestion, in the world and South Africa specifically. The chapter includes a discussion surrounding the definition of port congestion and identifies sources and consequences of congestion in maritime ports. The main argument of the chapter emphasises the significance of port congestion to the maritime-side and the landside of the port. The chapter concludes that port congestion can cause major time delays and thus negatively impact vessel and vehicle scheduling.
The final literature chapter, Chapter 5, focuses on the context of the case study, namely, the Port of Cape Town and the CTCT. The chapter includes a discussion on the significance of the Port of Cape Town to both global trade and the Western Cape economy.
11 This section is followed by a discussion focusing on the CTCT and its facilities and operations. Lastly, the chapter discusses port congestion on the maritime-side and landside of the container terminal.
The arguments developed in the literature review chapters emphasise the merit of primary research to develop risk profiles of current and future port congestion within the CTCT. The aim of the case study is to identify areas of improvement for the efficient operations of the CTCT and suggest a means to profile port congestion in other South African ports.
2.2.
Primary Research
Primary research was required for this study due to the lack of prior research conducted on risk and port congestion. Thus, there was not sufficient literature available to answer the research problem of this study. In addition to the lack of literature, this study required raw data pertaining to the impact and frequency of port congestion, which could only be acquired from those entities directly influenced by congestion, namely, TNPA, TPT and various shipping companies.
“Methodological triangulation3” was used to conduct the primary research portion of this study. Quantitative data was used to determine the scheduling impact and frequency of port congestion and was subsequently used to forecast the scheduling impact and frequency over a period of five years.
Qualitative data derived from interviews was used, along with the forecasted results, to develop basic risk profiles of current and future port congestion within the context of the container terminal. The primary research methodology of the study was divided into three stages.
The first stage involved descriptive data illustrating the current scheduling impact and frequency of weather- and system-related congestion within the CTCT. The second stage included the development of a five year forecast and the descriptive analysis of the forecast, whilst the final stage investigated the development of risk profiles of current and future port congestion.
The following sections of this chapter outline the research methodology used to conduct the primary research element of the study.
3 Involves the use of multiple research methods, both quantitative and qualitative, to improve the
12 Sections 2.2.1 to 2.2.3 discuss the sampling methods used to identify study participants; the research instruments implemented to collect the relevant data; and the different descriptive data analysis techniques used to derive meaning from the data collected. Sections 2.2.4 and 2.2.5 discuss the theory behind the five year forecast and the basic risk profiles of current and future port congestion within the CTCT; while section 2.2.6 outlines the assumptions and limitations encountered in the research methodology due to the nature of the study.
2.2.1. Sampling
Prior to the development and implementation of the appropriate research instruments required for data collection, the method of identifying willing study participants was determined. The sampling methods used for this study were chosen specifically with the scope and limitations of the study in mind.
Due to the limited availability of study participants and the narrow scope of the study, a non-probability sampling design was selected. As this study examines both the port perspective, and the shipping perspective (ocean carriers and container trucks), of port congestion, both viewpoints required adequate representation in the sample. Therefore, a combination of different non-probability sampling techniques was used. The combination of techniques used include judgement sampling, convenience sampling and snowball sampling. These techniques were used simultaneously to identify study participates who met the appropriate criterion and were willing and able to assist.
Judgement sampling, according to Blumberg et al. (2011:194), involves the identification of sample individuals based on certain appropriate criteria. For the purpose of this study, the criteria used for identification included the following:
1. Individuals or entities directly influenced by weather- and system-related congestion within the CTCT.
2. Individuals or entities representing either the port or shipping perspective of port congestion.
3. Individuals or entities both willing and able to contribute to either the qualitative or quantitative aspects of the study.
Convenience sampling, according to Blumberg, et al. (2011:194), is considered the least reliable form of non-probability sampling. However, for the purposes of this study, convenience sampling allowed the researcher the freedom to identify those individuals both willing and able to assist in the research as previously mentioned in the third criterion of judgement sampling.
13 Lastly, the snowball sampling technique allowed for easier identification of study participants as the technique allows the originally identified participants to identify and locate others adhering to the judgement sampling criterion mentioned previously (Blumberg, et al.
2011:196). The combination of judgement, convenience and snowball sampling techniques resulted in the identification of several individuals and entities.
For the port perspective of weather- and system-related port congestion, Transnet was approached as Transnet owns and manages all the ports in South Africa. However, for the purpose of this study, individuals from both TNPA and TPT division were required in order to obtain a more holistic view of port congestion within the CTCT. Interviews with TNPA individuals were required to obtain an overall view of congestion within the entire port, whilst interviews with TPT individuals were required to provide a more specific view of congestion within the CTCT.
For the shipping perspective of port congestion, various ocean carrier and trucking companies were approached to assist with the study. However, due to time constraints and a lack of willingness to participate, only a small sample was obtainable. Maersk Line, in association with Safmarine; Berry & Donaldson Shipping/Trucking; and Mediterranean Shipping Company (MSC) were among the few companies that responded to the request for assistance.
Data collection, in the form of research instruments, resulted in both qualitative and quantitative data from the previously mentioned study participants. This is discussed in the following section.
2.2.2. Research Instruments
The research instruments used for this study were chosen with the scope and limitations of the study in mind. Access to the willing study participants identified during sampling was also considered when developing the means of data collection. Due to the research design selected for this study, namely, “methodological triangulation”, more than one data collection instrument was required to maximise the accuracy and validity of the data collected.
The research instruments used for the qualitative portion of the primary research included personal interviews and email correspondences, whilst the quantitative research element was fulfilled through the collection of Excel data sheets from study participants pertaining to the movement of ocean carriers and container trucks, weather delays and system delays.
14 The data collection was conducted using two different interview templates (Addendum A and Addendum B) with general questions designed specifically for the different entities. The templates were aimed at addressing the two perspectives of port congestion, namely, the port perspective and the shipping perspective. These interview templates included questions designed to determine to what extent the Port of Cape Town and various shipping/trucking companies found port congestion a risk to efficiency. These interviews, either personal or via email, were used to supplement the literature and assist in developing the risk profiles of current and future port congestion. The interviews were also intended to broaden understanding of the importance placed on the scheduling impact and frequency of port congestion, thus assisting in the coding system of impact and frequency as discussed later in section 2.2.5.
The quantitative data collected came in the form of Excel data sheets. These data sheets were acquired from most study participants; however, certain of them could only provide qualitative data (refer to Table 2-1). Table 2-1 briefly outlines the study participants, the perspective of port congestion represented by each, and the data obtained.
Table 2-1: Study participant information
Study Participant Perspective of Port
Congestion Data Obtained
Entities Representative
TNPA
Coen Birkenstock Port of Cape Town: weather- and system-related congestion
Qualitative: Interview
Lorraine Tabo Quantitative: port/ terminal data
Qualitative: Emails TPT David Davids CTCT: weather- and system-related congestion
Quantitative: frequency and scheduling data
Qualitative: Interview
Pamela Yoyo Qualitative: Telephonic Interview
Shaun Julius
Quantitative: frequency and scheduling data
Qualitative: Telephonic Interview Safmarine Kerry Melville Shipping Company:
ocean carriers Qualitative: Interview Maersk
Line Genio Marais
Shipping Company:
ocean carriers Qualitative: Interview MSC Rob Mcewan Shipping Company: ocean carriers Qualitative: Interview Berry &
Donaldson Chris Lane
Shipping Company:
15 Representatives from TNPA and TPT provided Excel data sheets containing frequency and scheduling data for the container terminal pertaining to vessel and truck movement. These data sets included truck turnaround time (TTAT), vessel anchorage time (VAT), vessel berthing time (VBT) and vessel working time (VWT). The TTAT data set pertained to the movement of container trucks inside the terminal and referred to the time taken from entry at the gate, to exit from the gate. The VAT, VBT and VWT data sets pertained to vessel movement from arrival outside the port, to rope-on/rope-off4, and exit from the port.
This data was confirmed to be interval, time series data with the TTAT data spanning approximately five years (January 2011 – November 2015), and the vessel related data (VAT, VBT and VWT) dating from March 2011 to November 2015. This data collected was used to determine the current frequency and scheduling impact of port congestion. Examples of this data are illustrated in Addendums C and D.
In addition to these data sheets, TPT representatives were able to provide Excel data sheets containing the time impact (in hours) of weather- and system-related congestion within the CTCT specifically. This data was similarly identified as interval, time series data, with the weather delays data spanning a period of nine years (January 2006 – December 2014), and the system delays data spanning approximately six years (September 2009 – December 2014). Examples of these data sets are illustrated in Addendums E and F.
For the shipping perspective of port congestion, Maersk Line and MSC provided background knowledge with regards to the scheduling impact of port congestion on ocean carriers. This was linked to the data sets obtained from TNPA and TPT. In addition to the ocean carrier element of the shipping perspective, Berry & Donaldson provided background information with regards to the scheduling impact of port congestion on container trucks. This expert knowledge, similar to the ocean carrier information, was used in collaboration with the data sets obtained from TNPA and TPT.
The following section of this chapter discusses the descriptive methods used to analyse the above mentioned quantitative data to investigate current port congestion within the CTCT.
4 Also known as vessel berthing time (VBT), and refers to the time from when the port pilot secures the
16 2.2.3. Descriptive Analysis Methodology
The descriptive analysis of the quantitative data focused on two elements of port congestion, namely, the frequency of occurrences and the scheduling impact. Frequency and scheduling impact were analysed separately using both graphical and numerical descriptive statistics. The following sections discuss the statistics, measures and techniques used, and how each element was analysed individually. The results of the analysis are presented and discussed in Chapter 6.
Graphical and Numerical Descriptive Statistics
The frequency and scheduling impact of port congestion were analysed using both numerical and graphical descriptive statistics. However, before frequency and scheduling impact could be analysed the individual data sets collected were analysed. All graphical and numerical statistics computed for the different data sets were done using Microsoft Excel. The VAT, VBT, VWT, TTAT, weather delays and system delays data sets were analysed as follows:
Firstly, the observations of the different data sets were plotted on time series line charts to illustrate any trends5 or patterns in the data.
Secondly, the numerical descriptive statistics were used to compute a number of measures. These measures were required to describe the central tendency of the data, the variation of the data and develop further graphical statistics.
Lastly, further graphical statistics were developed, such as frequency tables and histograms.
The first graphical statistics used to analyse the individual data sets were line charts. These were computed by selecting all the observations of the data set and inserting a line chart. Each line chart was then adjusted to have the time period (date) of the observations shown on the x-axis. In addition, trend lines were inserted into each chart to indicate the presence of any upward or downward trends in the data sets. Secondly, each data set was analysed using numerical descriptive statistics.
The Excel output of descriptive statistics was obtained by selecting Tools - Data Analysis - and then the “descriptive statistics” option. The measures calculated by the analysis tool are shown in Table 2-2.
5 The trends displayed are, however, only a guideline. The risk severity calculations done for each data
17
Table 2-2: Output of “descriptive statistics” Excel tool Descriptive Statistical Measures
Mean Sample variance Maximum value
Standard error Kurtosis Sum
Median Skewness Count/Number of Observations
Mode Range Confidence Level (95.0%)
Standard deviation Minimum value
Of the statistical measures shown in Table 2-2, only certain measures were used to analyse the individual data sets. Before these measures can be discussed, however, certain statistical notation used must be explained. Table 2-3 presents the statistical notations used and what they represent.
Table 2-3: Description of Statistical Notations Statistical Notation Representation
𝑥̅ Sample mean ∑ 𝑛 𝑖=1 Sum of variables 𝑥𝑖 Variable 𝑛 Sample size 𝑠2 Sample variance
𝑠 Sample standard deviation
𝑘 Standard deviation in Chebysheff’s Theorem
𝐶𝑉 Coefficient of variation
𝑦𝑡 Actual variable
𝐹𝑡 Forecasted variable
The central tendency of the data was determined through the use of two statistical measures shown in Table 2-2; namely, the mean and the median. The mean, or average, is calculated by summing all the data observations and dividing by the total number of observations (Keller & Warrack, 2003:93).
18 Generally, the sample mean is denoted as
𝑥̅
with the number of observations denoted as n. The manual formula for the sample mean is known as (Keller & Warrack, 2003:94):𝑥̅ =
∑
𝑛𝑖=1𝑥
𝑖𝑛
The mean does, however, have one flaw. The mean can be influenced by extremely high or extremely low observations, known as outliers. To overcome this shortfall and improve the quality of the statistics another measure of central tendency, the median, was used.
The median refers to the data observation which falls in the middle of the data set after being placed in ascending or descending order. As this value is an actual observation found in the data set, it is not influenced by outliers and therefore may be a more accurate measure than the mean (Keller & Warrack, 2013:95, 98).
The measure of central tendency is an important measure in this study as it, in conjunction with other graphical statistics, is used to determine the shape of the data sets and the spread of the observations (Keller & Warrack, 2013:93, 98). Generally, the following applies (Nel, 2015):
𝑤ℎ𝑒𝑟𝑒: 𝑥̅ > 𝑚𝑒𝑑𝑖𝑎𝑛 𝑡ℎ𝑒 𝑑𝑎𝑡𝑎 𝑠𝑒𝑡 𝑖𝑠 𝑐𝑜𝑛𝑠𝑖𝑑𝑒𝑟𝑒𝑑 𝑝𝑜𝑠𝑖𝑡𝑖𝑣𝑒𝑙𝑦 𝑠𝑘𝑒𝑤𝑒𝑑
𝑥
̅< 𝑚𝑒𝑑𝑖𝑎𝑛 𝑡ℎ𝑒 𝑑𝑎𝑡𝑎 𝑠𝑒𝑡 𝑖𝑠 𝑐𝑜𝑛𝑠𝑖𝑑𝑒𝑟𝑒𝑑 𝑛𝑒𝑔𝑎𝑡𝑖𝑣𝑒𝑙𝑦 𝑠𝑘𝑒𝑤𝑒𝑑
When a data set is said to be skewed, this implies that the majority of observations fall to either the left or the right of the histogram (Keller & Warrack, 2013:37). Positively skewed data sets fall to the right and often result due to unusually high values, while negatively skewed data sets fall to the left and result from unusually low values. In addition, where the mean does not equal the median, this can suggest that outliers exist. This can only be confirmed graphically using a histogram (Nel, 2015). The graphical statistics used to determine the shape and spread of a data set are discussed later in this section.
In addition to central tendency, it is important to determine the variation of the data collected (Keller, 2012:108). This can be determined through the use of a number of statistical measures, however, for the purpose of this study only two measures were used, namely, the standard deviation and the coefficient of variation (Keller, 2012:108). The standard deviation
is the square root of the variance. The formula for variance, denoted by 𝑠2, is: