WestminsterResearch
http://www.westminster.ac.uk/westminsterresearch
Regional collaborations and indigenous innovation capabilities in
China: A multivariate method for the analysis of regional
innovation systems
Zhao, S., Cacciolatti, Lee, Soo H. and Song, W.
NOTICE: this is the authors’ version of a work that was accepted for publication in Technological Forecasting and Social Change. Changes resulting from the publishing process, such as peer review, editing, corrections, structural formatting, and other quality control mechanisms may not be reflected in this document. Changes may have been made to this work since it was submitted for publication. A definitive version was subsequently published in Technological Forecasting and Social Change, 94, 202-220 0040-1625.
Technological Forecasting and Social Change is available online at:
https://dx.doi.org/10.1016/j.techfore.2014.09.014
© 2015. This manuscript version is made available under the CC-BY-NC-ND 4.0 license http://creativecommons.org/licenses/by-nc-nd/4.0/
The WestminsterResearch online digital archive at the University of Westminster aims to make the research output of the University available to a wider audience. Copyright and Moral Rights remain with the authors and/or copyright owners.
Whilst further distribution of specific materials from within this archive is forbidden, you may freely distribute the URL of WestminsterResearch: ((http://westminsterresearch.wmin.ac.uk/).
Regional collaborations and indigenous innovation capabilities in China: a multivariate method for the analysis of regional innovation systems
In this study we analyse official Governmental statistics on regional collaborations on innovation in 30 Chinese regions to understand the dynamics of regional collaboration on innovation projects. We propose the use of Ordinal Multidimensional Scaling and Cluster analysis as a novel application to the study of regional innovation systems. Our results show that regional collaborations among organisations can be categorised by means of eight dimensions: public versus private organisational mindset; public versus private resources; innovation capacity versus available infrastructures; innovation input (allocated resources) versus innovation output; knowledge production versus knowledge dissemination; collaborative capacity versus collaboration output. Collaborations which are aimed to generate innovation fell into 4 categories, those related to highly specialised public research institutions, public universities, private firms and governmental intervention. By comparing the representative cases of regions in terms of these four innovation actors, we propose policy measures for improving regional innovation collaboration within China.
Keywords: multivariate statistics, collaborations, innovation, innovation orientation,
innovation capacity, regional innovation system.
While many studies on regional innovation systems have addressed how to measure innovation capability, most of studies have examined the interactions between innovation actors theoretically rather than empirically [1], focusing on internal capability of the region itself [2-5]. Furthermore, the research into regional innovation actors has been largely qualitative and only a few quantitative studies have analyzed the behaviour of innovation actors. In this paper we analyse four types of protagonists that are to be found in Chinese regional innovation systems (the government, research institutions, universities and private firms) to understand how different institutional environments at the regional level might affect the success of regional innovation collaborations.
This paper contributes to the regional innovation literature by improving our understanding of innovation actors and regional collaborations in the context of China. First of all, we offer a methodological contribution by proposing a novel application of a technique of data analysis for the study of innovation capabilities and regional collaborations. Second, we offer theoretical contributions in understanding the complex dynamics of collaboration among innovation actors (government, research institutions, universities and private firms) in a large transition economy like China by analysing how collaborations are affected by regional institutional environments that differ from the traditional triple helix model in Western countries,
e.g. Norway [6]. We also develop implications for policies that could enable Chinese firms’ competitiveness on the basis of the differences in regional institutional environments and the enhancement of indigenous innovation capabilities.
This paper adopts a novel, quantitative approach to study regional innovation capabilities by comparing groups of regions in light of empirically-derived dimensions of regional innovation collaborations. We employ a methodology widely used in marketing to position brands and products, yet applicable to our purpose of regional segmentation in terms of innovation systems. This technique allows a multi dimensional analysis of regional innovation capabilities and collaborations, with particular reference to the transition economy context. We use some of the measures proposed in the existing literature to derive useful dimensions of regional innovation capabilities, to group regions according to their institutional context, and to perform an evaluation of regional innovation collaborations, using official governmental data from China.
The paper is organised as follows: the next section discusses the rationale for examining regional innovation collaborations within the Chinese context, proposing an institutional perspective on innovation capabilities. Section 3 discusses key regional collaboration actors and their interactions. Section 4 describes the method, data collection and measures used in this study. Section 5 and 6 analyse the data
and present the results. In section 7 we propose some policy implications for regional development. Section 8 concludes the study.
2. A rationale for the understanding of collaborations in RIS in China
2.1. RIS in the Chinese geo-economic context
Thirty years of rapid globalisation process [7-8] created markets that react faster to demand and strengthened the cost-leadership of the China in manufacturing. Building innovation capabilities is important not only for mere economic survival [8], but also to foster national and regional growth and welfare for future generations [9]. However, in a Western perspective, China seems to pose a serious threat to Western countries because of the ability of Chinese enterprises to quickly shift from a position of cost-leadership to differentiation leadership [10], should they be able to leverage on their regional innovation capabilities.
These starting considerations raise some questions: in what ways is innovation capability shaped by regional institutional conditions; what are the characteristics of the regions with higher potential for innovation collaborations; and how can we better assess how does their institutional setup affect their innovation capabilities?
China offers an unique context for the analysis of regional innovation systems (RIS) and innovation capabilities [11], because China is the only transitional
economy that has both the scope for simultaneous low-cost sourcing and the capacity for high-differentiation within the same country thanks to the development of indigenous innovation capabilities [12].
In South-eastern areas of China businessmen currently tend to relocate production facilities to those parts of the country where labour costs and raw materials are much cheaper. In the meanwhile South-eastern Chinese organisations have been developing innovation capacity for high-tech in wealthier regions where production costs are rising, but where there is scope for research, design and technology development [13]. In addition, the level of education, which is of key importance for successful innovation [14], is improving rapidly.
In February 2006, the Chinese Communist Party proposed that to improve the capability of independent innovation and build an innovation-oriented Country, it is necessary to implement a strategy aimed to revitalise the nation through science and education, and dealing with the fierce international competition through the adoption of modern industrial practices [15].
In China there are 34 administrative regions, including 23 provinces, 5 autonomous regions, 4 municipalities and 2 special administrative regions, i.e. Hong Kong and Macao. Each region has different available resources and different socio-economic conditions. The development of science and technology among different
regions is imbalanced revealing mainly three aspects of the innovation process: the academic level and disciplinary areas of Chinese scientists, the size and intensity of the R&D input, and the quantity and quality of scientific achievements, i.e. innovation outputs.
The inequality of distribution of specialised scientific labour and resources naturally created some attractive centres where good practice concentrates, while other centres under-perform in terms of good practice. This intensifies the activity of the actors involved in the innovation process and stimulates them to seek collaborators [16]. Like in other Countries, also research collaborations in China frequently occur among actors across different regions. So, we can see the importance that regional collaborations play in a Country with 1.4bn people spread on 34 big administrative regions. Furthermore, under the fierce international competition innovation collaboration among different regions and actors has an important influence on the Country’s ability to advance science and technology. Hence, regional collaboration capabilities become critical if a Country wants to promote innovation through regional innovation systems [17]. In fact, the inequality of resources among regions, i.e. the number and quality of scientists, R&D input capital, scientific equipment availability and technical know-how (available scientific knowledge), affects research collaborations [18-19].
Furthermore, knowledge acquisition relies on groups’ interactions through networks [20], given the increasing complexity of technology. In most OECD’s Countries, this tendency has been supported and reinforced by public authorities, which become stakeholders in knowledge acquisition [21]. Networks and alliances are the main vehicles of innovation [22]. Thus, collaboration is an efficient tactic for improving research capability and capacity, especially for academic research units in developing Countries that usually have limited resources. Thought collaboration, the research units and their industrial partners could reduce development [23] costs and cycle times, increase research potential and the overall quality of their work [24].
2.2. Innovation capabilities and the institutional environment in China
Building regional innovation capacity is an important part of national innovation programmes, and establishing high efficiency regional innovation systems is important to improve a Country’s innovation capabilities [23]. In order to improve innovation capabilities at regional level it is necessary to: stimulate the initiative of innovation actors (private and public), coordinate the relationship among innovation actors and promote regional collaborations fostering innovation [25].
Efficient regional innovation systems are important to build innovation capacity In a Country [26-28], however the combination of resources (innovation input) and know-how within collaboration frames that allow innovation actors benefit
from innovation outputs is a complex process. At present, China was unable to establish long-term, stable cooperation relationship among China’s innovation actors (i.e. government, research institutions, enterprises, universities and intermediaries). This is partly due to the fact that various regions have different institutional environments that affect their efficiency and cause differences in their competitiveness [29].
The setup of the institutional environment at regional level can either be an enabler or a barrier to the enhancement of independent innovation capabilities, depending on how the regulative system influences economic transformations (maybe pursuing growth) through policies aimed at greatly improving the collaboration ability of innovative enterprises [30], through strong links with the government, the markets and the other actors collaborating on innovations [31]. The setup of the institutional environment, with its regulative, normative and cultural-cognitive aspects can affect the establishment of such collaborations, which enhance innovation capabilities and knowledge diffusion [32].
3. Actors in regional innovation systems
In knowledge-based economies the interactions among different actors within the innovation system are crucial to (i) produce, (ii) accumulate and (iii) diffuse knowledge, to promote competitiveness through technological improvements and
innovations [33]. The collaborative modes of innovation can be ‘private with private’ or ‘private with public’ and these involve interactions among customers, suppliers, regulators and knowledge providers [34]. Currently, the focus of most of innovation activities is on technological innovation. Although we do not imply any other type of innovation cannot be pursued, R&D collaborations are a mean to increase the impact of R&D on economic growth (through enhanced R&D productivity and technological diffusion)[35]. More specifically, R&D collaborations among innovating firms and public R&D institutions, i.e. universities and/or public research institutes, are a channel through which potentially academic or technological spillovers can be adopted and internalised by innovating firms [36].
To witness the importance of collaboration, in the last decade or so Academic research on innovation experienced a dramatic increase of interest in the concept of ‘networks’ [37-39]. Despite a discussion on innovation networks is out of the scope of this paper on innovation collaborations, the systemic interactions among actors of innovation and the knowledge exchange among actors in a region constitutes a key element of the regional innovation system approach [40-41].
Innovation collaborations (labelled by the authors as ‘research partnerships’) are defined as ‘cooperative arrangements engaging companies, universities, and government agencies and laboratories in various combinations to pool resources in
pursuit of a share R&D objective’ [42]. The actors in a Chinese RIS follow a similar structure to the triple helix [43] as we can identify the almost the same elements, however Chinese RIS have their own characteristics in the role played by the Government and National Research Institutes (see Figure 1). Chinese RIS are peculiar, in that the Government is the leading actor, and no collaboration can take place without the support and the involvement of the government. All universities and research institutes are state-owned and the government implemented a double governance system in all those bodies: in all Chinese institutions there is a (Communist) party system coupled to the normal organisation’s governance system. The directors in the party system, that are also members of the communist party, do play a consultative role with respect to the organisations’ directors and advice them on whether projects should be supported by the organisation. In that sense, the Chinese RIS is slightly different from the typical triple helix known in Western RIS and the lead on innovation is not taken by firms [44-45] or universities [43], but by the Government [46]. At a broader level, the actors in a research collaborations can come from either the public sector or the private sector, so when a partner is a governmental agency, e.g. a nationally funded research laboratory, the public sector is represented; when a partner is a private firm, the private sector is represented [47]. In many partnerships also universities are involved and from the perspective of
ownership authority a university can be either public or private [48].However, universities’ research is often, at least in part, publicly funded. Hence, for the purpose of this paper universities are considered as being part of the public sector. Given these characteristics that define the taxonomies of collaboration actors, research partnerships can therefore be fully public, fully private or mixed, i.e. public-private [49].
From a technology policy perspective, and by an institutional point of view, public private partnerships have been attracting the greatest attention so far, because they represent a relationship that directly embodies government intervention into the regional and national innovation process and thus, they are object of more careful observation [50], because of the regulative implications for policy makers (e.g. intellectual property rights laws, funding allocation). Regional innovation collaborations are not an isolated event, but the rational allocation of manpower and other input resources to innovation require mutual cooperation and active coordination among all innovation actors [51].
For instance, enterprises are the first important actor of technical innovation, as any technical achievement improving firms’ products generally results in some sort of benefit for society, be it in terms of product development (and therefore availability on the market) or in terms of employment creation. Enterprises are the
‘engines of innovation’ [52] contribute to regional innovation systems with the injection of capital and technological demand. Firms generate the stimulus for technological need and contribute to the creation of wealth through their commercial activity (design, production, sale of technology) and through the exploitation of intellectual property rights [53].
On the other hand, Universities and research institutes are mainly responsible for the cultivation of talents, the production of knowledge, the advancement of scientific and technological research, as well as knowledge transfer. Universities, for instance, provide a qualified workforce, locally adapted research services and technologies [54-55]. Universities can also enhance the regional innovation systems absorptive capacity and can stimulate industry by supporting technological development [56]. Along with universities research institutions also play an important role, despite the fact that the benefits derived from investment in education may differ from country to country [57], especially when their economies are very different from each other [58]. They often act as a bridge between Academia and industrial research, facilitating knowledge transfer [5, 59]. Universities and research institutes are important sources of knowledge creation and dissemination. They can contribute to enterprises’ activities, and without them innovation would be less achievable due to the lack of technical expertise.
Another important actor is the government, who is often the initiator of regional innovation collaborations, with the creation of collaboration frames based on policies for technological development and exploitation. Governments deploy resources (often capital) to regional collaboration projects [60]. Furthermore, Governmental bodies can, with their regulative power, directly and effectively control innovation activity. For those collaborations to be successful, they need to provide stakeholders with the right conditions to develop innovation projects and with a good institutional environment that limits the risks associated with engaging with an enterprise whose results are uncertain.
Lastly, the other actor taking part to innovation collaborations are intermediaries. Science and technology service intermediaries are organisations that play a ‘support’ role in the collaboration. These are not directly involved in the regional innovation collaboration, although they might be part of the regional innovation system, creating value by acting as a bridge of technological innovation between the supply and demand sides. These intermediaries act as important instruments to realise interaction amongst innovation actors [61]. Intermediary organisation can provide an effective service platform through the provision of ‘support resources’ for regional innovation collaborations. In the case of banks, they provide funding, risk evaluation and financial goals identification. In the case of
banks, they provide financing, risk evaluation, financial goals identification. In the case of recruitment agencies, they provide talents to the market and so on. Intermediaries such as internet/telecom providers provide technology platforms for the exchange of information. If there is no intermediary organisation, scientific and technological success is greatly reduced. Therefore, for complete and effective regional innovation collaborations every actor is indispensable and the way they interact among themselves and with respect to the institutional environment can either promote or hamper regional innovation and development. These concepts are summarised in graphical format in figure 1.
Figure 1: conceptual model of regional innovation collaborations 3.1. Regional innovation collaborations: the enterprise perspective
Research collaborations between private firms and research institutes, along with governmental policies that support such collaborations are primarily based on the principle that technology transfer will occur sometime in the future [62]. When one of the partners in a research collaboration is a research institute or a university
the possibility of organisational-culture clashes increases due to the different nature of research institutes and universities, with respect to private ventures. These differences complicate the management of project as they become more difficult [63]. In such cases, building trust among partners becomes critical. Also, the expectations of the collaborating partners differ a lot from one another, and therefore good communication channels between the partners are important.
Commitment to a relationship essentially implies that mutual respect and trust exists, as one definition of commitment, for example, is ‘the act of process of entrusting’ [64]. However, collaborations between firms and other actors can provide an efficient way to access additional or complementary resources that can speed up the innovation process. Prior research has shown that discoverers of technological opportunities can access resources for exploitation more effectively through collaborations [65].
Collaborations between firms and other actors face significant challenges. While universities or research institutions are primarily driven by the creation of new knowledge and education, private firms are focused on capturing valuable knowledge that can be leveraged for competitive advantage [66]. In addition, universities are becoming increasingly proactive managers of their collaborations with the industry, seeking to create valuable Intellectual Property (IP) to foster
technology transfer. Accordingly, more and more interactions between industry and other actors are becoming subject to measurement and management, leading to more formal, contractual exchanges based on codified rules and regulations [67]. However, rapid changes in technology often force firms to depend on external technological knowledge and skills in addition to internal technological resources [68]. Also, current competitive pressures are driving firms to introduce higher-quality products faster and cheaper than competitors. The challenge is becoming increasingly important in today’s rapidly changing world. The innovative capability of firms is largely dependent on cumulative knowledge built over many years of experience. So research projects of science and technology is an important element for the generation, diffusion, and assimilation of innovation. Innovation in firms is the result of investments in R&D and science and technology and interaction with centres producing new knowledge, mainly research centres and universities, but also consultancies, scientific brokers and foundations for the diffusion of scientific research. All these generate the codified and explicit knowledge which can be used by the firm to produce new innovations [49].
Recently, research showed that official, closed channels of communication play a limited role in the flow of knowledge between universities and firms, although they contribute to the generation of patents and licences. On the other hand, open
channels of communication such as academic papers publication and consulting, which take place informally amongst academic and corporate researchers, play a critical role in knowledge transfer[62]. Informal collaboration relationships are important to shape the innovative performance of universities and firms, becoming critical determinants of innovation[69]. In contrast, although the impact of public research on innovation might be big, firms have knowledge of users’ needs, which can be fed into their R&D activities to improve R&D outputs [29]. What said so far leads us to argue that firms with experience of collaboration acquired through long-standing relationships are likely to enjoy better alliances because their commitment is higher. These alliances in turn could have positive implications for innovation outputs.
3.2. Regional innovation collaborations: the perspective of governmental
organisations and intermediaries
When looking at the government or to intermediaries, the State should be able to provide regional innovation actors with a good institutional environment that supports innovation collaborations though policy making. The government could legislate in favour of innovation collaborations by supporting regions with infrastructures, financial capital, manpower, material resources as well as education and high-tech availability [70]. All Government programmes encouraging
collaboration between businesses and universities are very important to foster the development of innovation capabilities, however seldom they can produce a real breakthrough in the innovation-based competitiveness of an economy [71].
Collaborative research programmes have a significant impact on the structure of national innovation systems by creating and strengthening networks which are essential for breeding innovation groups [72-73]. These collaboration networks involve both technology and market stakeholders and are extended to include industry, research and technology producers. Network activities have resulted in setting priority in research [74] and linking research fields that have high potential to aggregate into distinct technological groups [75].
National research systems around the world are undergoing profound changes [76-77] because of their shift towards multidisciplinary approaches to research and their contribution to building the linkages between industry and other organisations [78]. Changes in the institutional environment are a concern not only for national policy makers but also for industrialists and technology producers. Collaborative research centres are established to direct and develop innovation in areas of national economic importance [79]. Governmental policy interventions to stimulate technology innovations can be promoted through the creation of strong linkages between technology users and providers.
4. Data collection and description of variables
The dataset for this study consists of innovation related measures provided by the National Statistics Bureau of China. The data is available online1 and the
database was accessed on the 6th of May 2012. Overall, information about 30
Chinese provinces was collected and no variables showed duplications or incomplete information. Hence, these 30 regions were appropriate for the purpose of our analysis.
Current literature has identified the following actors as being important to regional innovation systems regarding making innovation happen [80]: universities, scientific research institutions, companies, government agencies and intermediary institutions [14, 81-83]. These actors keep learning from their operations and operate on some major innovation activities that involve the use of infrastructures, financial-, social- and human capital [2, 80, 84-85]. Thus, the actors we refer to throughout the paper are labelled as follows: public research institutions (res_), enterprises (firm_), universities (uni_) and governmental offices (gov_). All data collected was numerical (scale measures) and continuous, hence no encoding was required, given the lack of nominal and ordinal data. All variables were left in their original format, as established by the statisticians of the National Statistics Bureau of China.
Furthermore, all variables collected referred to four main actors collaborating in regional innovation.
Despite some attempts to create aggregate indicators of technological capabilities at country level [86], many organisations2 tried to identify appropriate
measurements of innovation capability [87-90]. Three major groups for measurement were identified: (i) resource input, e.g. governmental R&D expenditure, (ii) innovation output, e.g. number of inventions or patents [91] and (iii) internal and external factors affecting innovation systems [92-94]. However, for ease of reading, in this paper we have categorised the variables into lists related to the characteristics (e.g., number of institutions) or activities (e.g., investment type) of the actors involved in regional innovation collaborations rather than grouping them by actor (e.g., universities versus firms), and we have summarised them into tables. Each table reports the variable’s mean, standard deviation, median, minimum and maximum values. The tables which resulted from this are as follows:
Valid Mis s ing
res _no 30 0 122.10 114.00 66.600 22 353 firm _no 30 0 414.40 234.50 547.157 12 2159 uni_no 30 0 27.13 27.00 12.670 4 57
N
Mean Median Std. Deviation Minim um Maxim um
Table 1: variables related to the actors’ capacity
2 Examples are the World Economic Forum, the International Institute for Management Development, the United Nations Industrial Development Organisation, the World Bank and the Ministry of Science and Technology of People’s Republic of China.
The first three variables are the number of research institutions (res_no), enterprises (firm_no) and universities (uni_no) taking part in innovation collaboration projects. We can see from table 1 that despite an average of 234 (i.e., median) firms per Chinese region, some provinces have a very small number of firms (min=12) taking part in collaborative projects compared to other provinces which show a high number of participating firms (max=2,159). Furthermore the contribution of research institutes (median=114) and universities (median=27) varies enormously from one province to another, with a low level of participation in regions with 22 research institutes and 4 universities and a high level of participation in regions with 353 research institutes and 57 universities.
However, this initial description of the number of organisations taking part in collaborative projects may be followed by a description of the variables that describe the type of resources allocated to regional innovation collaboration projects, as shown in table 2.
Valid Mis s ing res _RDs taff 30 0 10750.40 6364.50 15306.136 386 83215 res _RDs pend 30 0 332134.67 147176.00 607667.589 4854 3216954 firm _RDs taff 30 0 50621.50 34125.00 59869.039 822 258171 firm _RDs pend 30 0 1070012.00 659693.00 1299220.803 14366 4996797 firm _foreigntech 30 0 131531.70 61991.50 169699.740 302 676216 uni_RDpers on 30 0 10075.50 8399.50 7099.757 342 28033 uni_ICOpers on 30 0 1027.30 822.00 920.525 51 4469 uni_ICpers on 30 0 3912.70 2295.50 4186.494 105 17410 gov_RDs pend 30 0 1931593.67 1351132.50 2054240.230 14385 7019529 gov_RDs taff 30 0 76330.57 55334.00 74479.654 4210 283650 gov_fins upport 30 0 43.594667 23.085000 51.0489760 4.4000 215.1300 gov_EDCs pend 30 0 4294107.33 3641195.50 2560762.749 608034 11661554 gov_inds upport 30 0 2014.17 639.00 3832.033 19 17162 gov_railprov_ratio 30 0 8088.47 8102.64 4541.229 833 18525 gov_bus prov_ratio 30 0 197.762333 161.410000 163.6314624 22.1300 696.1300 Minim um Maxim um N
Mean Median Std. Deviation
Table 2: variables related to the actors’ resource input
Research institutions across all 30 Chinese regions invest in R&D with an average of approximately 332,000 RMB and they employ over 6,300 people (i.e., res_RDstaff median). This is a fairly low figure compared to some provinces that see an investment exceeding 3 million RBM (res_RDspend maximum) and employ over 83,000 people (res_RDstaff maximum). This can also be deduced from the wide standard deviations shown in table 2.
On the other hand, expenditure on regional innovation projects is fairly high for private firms, sometimes exceeding the research institutions’ investments. Private firms also acquire foreign technology, as shown in table 2. In the same table, we can also see there is a wide regional variation between regional innovation expenditure among universities and governmental bodies. An example related to the university situation is the average number of people working on international cooperation
projects (uni_ICOperson, median=822) and the under representativeness of some regions (with only 51 people working on international cooperation projects) and regions with many more researchers involved in regional innovation projects (uni_ICOperson, maximum=4,469). An example of the resources allocated by the government can be seen in the huge regional differences in public investment in terms of infrastructures (gov_railprov_ratio and gov_busprov_ratio) expressed as a ratio between the km of available road or railway and the surface of the province under examination.
Valid Mis s ing
res _projects 30 0 2035.57 1347.00 3430.393 168 19204 firm _RDproject 30 0 4461.43 3497.00 4724.990 123 19031 uni_RDprojects 30 0 8602.80 6359.00 6669.164 249 29712 uni_contracts 30 0 101739.27 54830.00 177941.423 153 922669
N
Mean Median Std. Deviation Minim um Maxim um
Table 3: variables related to the actors’ collaboration output
Given the situation shown in tables 1 and 2, it is not surprising that table 3 also shows that the participation in regional innovation collaboration is affected by the region which is involved in the project. We would assume that under-resourced regions may focus less on regional innovation given they might have other priorities from more developed regions. Under-resourced regions might seek a way to survive economically while more developed regions might aim for economic growth, therefore impacting on the number of collaboration outputs. Table 3 clearly shows
that many provinces in China do not get involved in innovation collaborations, therefore missing the opportunity to benefit from regional innovation projects.
Valid Mis s ing
res _papers 30 0 4595.97 2984.00 7696.119 420 43959 res _patent 30 0 524.27 276.00 941.243 19 5149 res _s tandards 30 0 82.53 26.00 200.251 1 1097 firm _s ales 30 0 19324870.13 13984627.50 22128135.713 101895 78547987 firm _patent 30 0 2100.00 838.00 4396.306 23 24068 uni_awards 30 0 160.67 147.00 115.352 4 441 uni_patent 30 0 580.60 316.00 682.521 2 2222 Minim um Maxim um N
Mean Median Std. Deviation
Table 4: variables related to the actors’ innovation output
While the previous tables have described for us a situation of wide regional differences in the actual amount of regional innovation collaborations, table 4 shows that the same situation is to be identified when we consider respect of innovation output. All of the variables show a high variability in the data, hence indicating that not all regions that collaborate on innovation projects are good at generating innovation outputs. In fact, the worst performances can be found in the generation of research standards from the research institutions (res_standards: mean=82, S.D.=200) and in the generation of exploitable patents from universities (uni_patent: mean=581, S.D.=682) indicating that some regions are unable to generate relevant innovation outputs.
This section has reported on descriptive results. One can expect that the key variable groups, i.e. actors’ capacity, resource input, collaboration output and
innovation output, are related to the regions taken into examination. In the next section we will model the links between the key variables and the regions using multivariate data analysis.
5. Data analysis
The data collection and the descriptive analysis of the variables that has just been described has resulted in a matrix of 30 regions or Chinese provinces (rows) and 29 continuous innovation and collaboration aspects (columns). The collected data was fed into the statistical package SPSS and the data collected were analysed with multivariate statistical tools, specifically OMDS and HCA. The objective of the analysis is to establish in what way collaboration input, output and stakeholders’ characteristics are related.
OMDS is a data modelling tool based on proximities [95]. In order to understand how OMDS works, we could think about a geographical map. Maps represent towns as points on a plane if the map is two dimensional, or in space if the map has three dimensions. Once coordinates are added to the map it is possible to locate the position of a town. In geographical maps longitude, latitude, and height over the sea level are used as coordinates. However, by adding information onto the map we would easily add other dimensions. For example, a fourth dimension such as average annual rainfall could be added by colouring the map. In our specific case,
we were interested in representing proximities between variables; i.e., visualising how often two specific variables appear together in the same region, identifying the different dimensions that are related to innovation collaboration behaviours, and interpreting such dimensions.
The first step in the application of the algorithm is to define a measure of proximity (similarity) between any two objects, in this case collaboration related variables. It is possible to calculate several measurements of proximity for continuous data [96]. Following this reasoning, the measure of proximity between two variables was obtained by correlating the variables with each other for as many regions as we needed to analyse.
Because of the 29 variables we have in the table, we end up with a 29x29 matrix that measures proximity. This matrix is used as an input dataset to the PROXSCAL routine in the SPSS software. Afterwards, it is important to assess the dimensionality of a given data set. Following established practice in this area, we represented the data in one, two, three, four, five, six, seven, and eight dimensions and took note of the measurement of goodness of fit Stress1 [95]. Stress1 is
equivalent to a residual sum of squares in regression, and declines as the number of dimensions increases
Table 5 shows the values of Stress1 for the different dimensional
representations, and Figure 1 shows this information in a graphical format.
Dimensions Stress I 1 0.454 2 0.126 3 0.079 4 0.056 5 0.044 6 0.038 7 0.035 8 0.032
Table 5: Dimensionalities and Stress I Figure 2: Stress I–Dimensionalities plot
The Stress-I dimensionality plot indicates with its elbow the best number of dimensions for a good interpretation of the configuration. Although there is a clear elbow at dimension 2 in the figure, six is generally a reasonable value for the dimensionality of the data set and we are treating dimensions seven and eight as a “residual variation”.
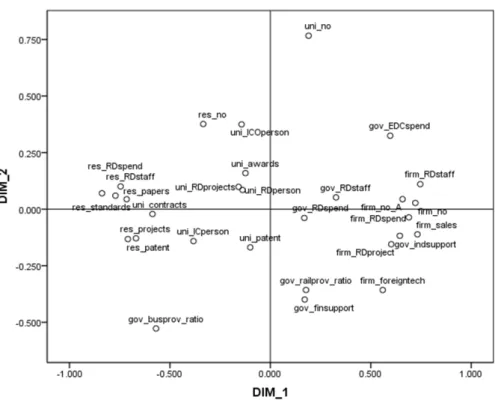
Interpretation is based on visual inspection and we must work with the projections of the solution on bi-dimensional sub-spaces. The projection of the variables on Dimension 1 and Dimension 2 can be seen Appendix A2. The projection on dimensions three and four is reported in Figure 3, Appendix B3. On this occasion dimensions five and six were also interpreted and these were plotted in Appendix A4.
We shall interpret the meaning of the dimensions further below. However, before conferring a meaning onto the dimensions, it should be noted that two-dimensional maps are not always easy to interpret as the points are positioned on the map by means of a projection therefore two points that appear to be physically close to each other in the two-dimensional representation may not necessarily be close to each other in space. Hence, classification techniques can give an indication of the real distance between points in the six-dimensional space. To assess the real proximity between two points in the space we have used Hierarchical Classification Analysis (HCA).
The measure of proximity between any two points has been derived from the coordinates of the points in the six-dimensional space using Ward´s measure of distance [97]. Ward´s measure maximises the homogeneity within groups (so that points that are contained inside a cluster are as similar to each other as possible) and the heterogeneity between groups (so that the different groups are as different from each other as possible).
6. Results and discussion
The dendrogram obtained with HCA can be seen in Appendix A5. The dendrogram forms when points merge together. It should be noted that there is no standard way of deciding how many groups should be identified; hence good
common sense should be used in judging the number of groups we are interested in. As a general rule of thumb, we could say we do not want too many groups because we would get lost in the detail; however we do not want too few groups either, as groups may gather very different entities.
6.1. Sets of regional innovation collaborations capabilities
Six groups of variables related to regional innovation collaboration were identified from the dendrogram. We will now discuss cluster membership. Full details about cluster membership can be found in Appendix A1. Set 1 groups variables related to the innovative capacity in universities. This can be deduced from variables related to the input in R&D or innovation, such as the number of staff working in innovation, as well as the outputs generated, such as patents and scientific awards. Universities provide lots of resources for collaboration, including staff and infrastructure. Set 2 groups variables related to the number of universities. This cluster fundamentally indicated the research infrastructure and is therefore a measure of innovation capacity as opposed to innovation capability, which we found in the previous cluster. Many labs in China are owned by universities or tend to be located within the premises of universities. Set 3 groups variables related to innovation capability in research institutes. Again, we can see variables related to research input and variables related to research output in research institutes. It
should be noted that research institutes in a Chinese context are generally centres of excellence in research, with top world researchers collaborating in economically important projects. Research institutes appear to supply the ‘brain’ in technological innovation, whereas would appear that universities supply administrative support, infrastructure and less specialised R&D personnel.
Set 4 groups variables related to the innovation capacity of firms. It would seem that firms benefit from collaboration with universities and research institutes because of the benefits they gain from partnering with organisations who can design and direct innovation through innovation capability (research institutes) and organisations with infrastructures and innovation capacity (universities). Firms seem to contribute economically with funds and access to data.
Set 5 groups variables related to the firm-state collaboration. This cluster includes variables that give an insight into the type of relationship between government and private firms. It is interesting to see that governmental bodies and private firms benefit from collaboration in the sense that firms contribute to local economic growth, when they are successful, and that the government invests in them and contributes financially to subsidise innovation projects. Set 6 groups variables related to public infrastructures. This cluster includes two variables that show the proportion of railway and road available in the province. This can be a
proxy of the importance the government places in specific regions by providing logistical support for economic development.
As the descriptive analysis of the variables suggests that there are strong regional differences in the approach to innovation and to regional collaboration, we decided to cluster the regions according to their characteristics in terms of innovation capacity and capability, the resources made available (both private and public) as well as the regional collaboration output and the regional innovation output.
6.2. Regional classifications
The dendrogram obtained with HCA can be seen in Appendix A6. Five regional groups which related to regional characteristics were originally identified from the dendrogram. Further detail on the variables can be found in Appendix A1. In order to distinguish between the attributes classification and regional classification, we decided to number the regional groups while adding an ‘R’ prefix that stands for the word ‘region’. Group R1 groups variables related to regions in the process of development. We can call these regions ‘work in progress’ regions, because they are not developed, but they are improving very fast and they are on their way to achieving the status of developed regions. Group R2 groups variables related to regions that did not achieve development. We can call them ‘underdeveloped’
regions. These regions present major socio-economic problems. Poverty is widespread and the contribution to national GDP is very low.
On the other hand, Group R3 groups a single variable related to a particularly developed region: Guangdong. This region can be called ‘star’ region. It is fully developed and modern. It is totally different from the other regions of China. Group R4 groups variables related to regions that are ‘on the way up’. These regions are not as we developed as the star region, but they are way ahead with respect to the ‘work in progress’ regions. Finally, group R5 groups variables related to well developed regions that are performing better than the ‘on the way up’ ones, but not as well as the star regions.
To sum up, if we decided to rank the regions by their level of development, we could group, for ease of analysis, regions in groups 3, 4 and 5 and we call them ‘successful regions’, regions in group 1 ‘developing regions’ and regions in group 2 ‘underdeveloped regions’.
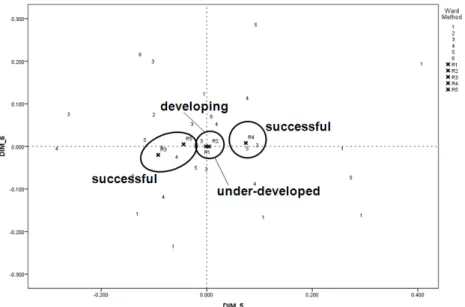
After determining the composition of the groups for the variables and the regions, we represented the groups in the configuration by substituting the name of the variable with its cluster membership and projecting the points onto the dimension’s couplets. Figure 3 shows the projection of the points onto the subspace
formed by Dimension 1 and Dimension 2. Figure 4 and 5 show the projections of the points onto the subspace formed by dimensions 3 and 4, and 5 and 6 respectively.
Figure 3: projections of the multidimensional configuration on dimensions 1 and 2 labelled by cluster membership.
Figure 4: projections of the multidimensional configuration on dimensions 3 and 4 labelled by cluster membership.
Figure 5: projections of the multidimensional configuration on dimensions 5 and 6 labelled by cluster membership.
6.3. Interpretation and discussion
After discussing the groups, we can now try to interpret the meaning of the dimensions shown in Appendices A2, A3 and A4. In order to label the dimensions we shall concentrate on the variables that are plotted at the extremes of the axes, and we will take into account their set’s membership. The logic of this procedure can be illustrated by means of a geographical example. When looking at a map of the world we can label the vertical axis as north-south, and the horizontal axis as west-east. We will apply this same logic in order to label the dimensions in the OMDS maps.
By observing Appendix A2, we can see that most variables on the right-left axis relate to private organisations' capabilities versus public organisations' capabilities. We would suggest that Dimension 1 captures the public organisational mindset versus the private organisational mindset. Given the nature of the variables
in this dimension, the public versus private organisational mindset could also be interpreted as a proxy for competitiveness or efficiency. By observing the same figure, we can see that most variables on the top-bottom axis relate to innovation input. Specifically we see that some innovation input is with respect to public organisations and some is with respect to private organisations. These are to be found on the left-right axis. We suggest that Dimension 2 captures public resources versus private resources orientation.
By observing figure 3, we can see that most variables on the right-left axis relate to innovation capacity, due to the heavy presence of variables quantifying collaborations, projects, contracts and so forth. We would suggest that Dimension 3 captures innovation capacity (or efforts) versus private public infrastructures. Likewise, by observing the same figure, we can see that most variables on the top-bottom axis relate to innovation output that has been generated (top) and the allocated or available resources used as an innovation input (bottom). We therefore suggest that Dimension 4 captures allocated resources versus generated output.
Finally, in figure 4 we can see that most variables on the right-left axis relate to a dimension of knowledge. When looking in more detail, we can see that on the left we have variables related to the generation of knowledge and on the right hand side we have variables relating to publicise knowledge. We suggest that Dimension
5 captures knowledge production versus knowledge dissemination. In the same figure, we can observe that most variables on the top-bottom axis relate to collaboration. Specifically we see there are some variables quantifying collaborations (top) and some variables quantifying the outputs coming from collaborations (bottom). We would suggest that Dimension 6 captures collaboration capacity versus collaboration output.
We can summarize the above discussion by saying that the official data of the National Statistics Bureau of China regarding regional innovation collaborations may be described in terms of six independent dimensions or orientations. In the same way, we can also analyse the position of the regional sets on the bi-dimensional space for all dimensions’ couplets. Within this framework, we observe that Set 1 situated in Figure 3, can be described as being mainly related to ‘developing’ regions with a balance between a private and public organisational mindset. These regions tend to use more public resources than others in order to foster innovative collaborations. In the same way, by looking at its projection onto other pairs of dimensions, we found that ‘developing’ regions do not differentiate from ‘underdeveloped’ and on the way up regions in terms of available infrastructures, allocated resources, innovation capacity and output generated (figure 4). Furthermore, ‘developing’ regions are not particularly good at either generating or
disseminating knowledge (figure 5). Hence, ‘developing’ regions for the time being appear not to have a particular competitive advantage in terms of regional innovation capabilities. All this suggests that the regions belonging to Set 1 are not very competitive and do not contribute greatly to the development of regional innovation collaborations.
Set 2 in figure 3 is positioned on the left hand side of the map, indicating that ‘underdeveloped’ regions have in fact a very strong public organisational mindset. Organisations in these regions might present particularly innovation-averse or bureaucratic behaviours. It is interesting to note that these regions are also relying more on private funds when taking part in innovation collaborations, because the government seems not to spend much on innovation in those regions. Hence, innovation-wise these regions are under-capitalised. Just as for set 1, we see that set 2 does not present a competitive advantage (figures 4 and 5). These regions are not only not competitive, but also under-capitalised. This does not appear to be a favourable mix of characteristics regarding the fostering of potential collaborations that should lead to innovation.
Having said that ‘developing’ and ‘underdeveloped’ regions show a more public organisational mindset and are not particularly competitive in terms of innovation, we can now see what other types of regions look like.
Sets 3 and 4, the ‘star’ region Guangdong and the ‘on the way up’ Shandong and Jiangsu provinces present (figure 3) a very strong private organisational mindset and most of the innovation collaborations are fuelled by private capital. Guangdong was the object of the first entrepreneurship experiment derived from Den Xiaoping’s open door policy. Guangdong has a thirty-year-long tradition of entrepreneurship. On the other hand Shandong benefited from strong connections with Western countries and Shandong province attracts quite a bit of FDI. This might explain why the capital used in innovation is mostly private. However, there are differences between set 3 and set 4. Set 3 benefits from better infrastructures (figure 4) and can benefit from a logistical leverage. Also the innovation output generated is fairly high. Set 4 positions itself with groups 1 and 2 in terms of the availability of infrastructure, resources, innovation efforts and outputs generated. Set 4 is composed of ‘successful’ regions, but they still share common characteristics with the regions that are developing and the underdeveloped ones. However, if we look at figure 5, set 4 is good at disseminating knowledge and has a higher collaborative capacity. This might give these regions a competitive advantage for developing regional innovation compared to groups 1 and 2.
Finally, there is a final and very interesting set to analyse in context of the dimensions we have derived from the data. Set 5, i.e. Shanghai and Zhejiang,
represents regions with a strong commercial tradition. Shanghai is well known for its weight in business and Zhejiang is well known for the strong entrepreneurial mindset of its population. As a matter of fact, figure 6 shows set 5 has a strong private organisational mindset, but they also make wide use of public resources in order to fuel innovation collaborations. They have made a big effort to innovate (figure 4) by making good use of their high innovation capacity and they have proactively allocated resources in order to make it happen. This set, along with set 3 produces (figure 5) lots of knowledge and has good collaboration capacity and as a consequence, they generate a high level of collaboration outputs. Set 5 might represent regions with a strong entrepreneurial orientation that act opportunistically in order to enhance their regional innovation capability.
We may conclude this section by saying that all these groups can be grouped into two main categories: competitive regions with high regional innovation capabilities and non-competitive regions with low regional innovation capabilities. Those regions that are competitive present private and public organisations with strong private organisational mindsets, a good allocation of resources to innovative collaborations and are proactive in the creation and dissemination of knowledge. On the other hand, non-competitive regions with low regional innovation capabilities do not allocate resources to innovation, do not appear to be collaborative and present a
‘public and bureaucratic’ organisational mindset. These regions are not particularly good at generating innovation outputs and do not give rise to knowledge creation and dissemination.
We also conclude this analysis with a recommendation for policy makers. Public policy should be aimed at the enhancement of regional innovation through the development of regional innovation capabilities. However, in order to do so, policy makers should keep into consideration the different regional institutional environment and should generate a mindset shift from a bureaucratic approach toward a more customer-orientated approach. This observation is particularly important in economies that are organised around a centralised control system, with little delegation at peripheral level. This would encourage entrepreneurship in both private and public organisations, as entrepreneurship should be seen to be an attitude that can lead to successful innovation collaborations.
7. Policy implications for regional development
When looking at the cases of these four innovation actors (government, research institutions, universities and firms) in both competitive and non-competitive regions, a number of important policy implications for regional development emerge. Collaborations can bring wealth to the regions that are engaged, yet all collaborations have to compromise the motivations of the different stakeholders that
pursue innovation and balance the allocation of resources. Regional policy implications of our study based on innovation input, output and regional characteristics can be summaried as follows:
1. This analysis shows that the allocation of resources to innovation collaborations on the part of the different stakeholders is important for collaboration success. Those regions where collaborations imply an allocation of appropriate resources generate a greater amount of innovation outputs. Also support from the government is important to the fuelling of regional innovation systems, as R&D and technological innovation is often capital intensive. Regions might benefit from development policies that involve the allocation of subsidies for the development of innovation capabilities. This might enable collaborations’ stakeholders to commit to better supported and stronger relationships. On another note, it should also be observed that the analysis has shown the main stakeholders’ differences, indicating that there might be hidden resources such as expertise (innovation capability), infrastructures (innovation capacity), data access and funds (financial and intellectual capital) as well as subsidies (governmental input) stakeholders can capitalise on, in order to enhance competitiveness.
2. Research outputs need expertise. As we have seen from the analysis, the stakeholders that generate the highest research output are research institutes. These institutes are the ‘brain’ in the collaboration. The implication for RIS development lies in the importance of enhancing local expertise. The existing knowledge base is the core for the development of innovation capabilities [98]. Expertise can be enhanced by creating (where they do not exist) and supporting (where they already exist) centres for excellence in research. Also, from the analysis we can see that those regions with a higher number of research institutions tend to generate better innovation outputs. Research institutions, other than contributing to the registration of patents (often collaboratively with private firms), have the important roles of (i) creating and (ii) disseminating knowledge, as we have seen from the analysis.
3. The last implication for regional development builds on the interesting finding that different regions present different organisational mindsets. It would appear that the competitive regions are also the ones presenting more entrepreneurial behaviour. These are the regions that present a business orientated mindset. In these regions the institutional environment is different and these are also the more developed and modernised areas in China. On the other hand, the under-developed regions or the regions ‘in development’
show poor levels of innovation performance and low competitiveness overall. These regions are also the regions with a more public-office-like mindset, possibly entrenched in static ‘bureaucratic approaches’ rather than invigorated with a dynamic ‘business approach’.
8. Conclusion
We have shown in this paper that multi dimensional scaling is a useful technique for multivariate data analysis in evaluating regional collaborations and capabilities in China, across four main actors of regional innovation systems and three regional groups. The limitations of this study lie mainly in its use of governmental data. Although we would assume governmental data to be ‘accurate’, we had no control over the data collection process operated by the statisticians of the National Statistics Bureau of China, and data is available for only thirty regions since we had no access to data on Tibet, Xingjian and Taiwan.
The implications for regional innovation and collaborations are based on a better use of available resources (input), a better focus on the generation of innovation and research outputs (output) and the role of an organisational mindset (culture) on the way innovation capabilities are developed and exploited for innovation collaborations.
Furthermore, this paper has relevance for industrial practitioners, policy makers and academics with a specific interest in China as a fast growing transition economy. First of all, fast growing economies face the (often unthought-of) risk of seeing their cost leadership fade away, due to the increase of labour costs as a consequence of regional wealth enhancement. In the case of China, the east and the south-eastern coastal areas – following thirty years of ‘experimentation’ in entrepreneurial activity started by Den Xiaoping’s ‘open door policy’ – are becoming poor in natural resources to exploit and labour costs have risen quickly. Central China is the next natural market for primary production due to its currently low salaries, making the regions we analysed very appealing to eastern China’s investors that are seeking not to lose their cost leadership. Sourcing industrial materials westwards can enhance eastern and south-eastern China’s competitiveness.
But what advantage can east and south-eastern regions develop? This final point provides an answer: they could develop strong regional collaborations. This way they could capitalise on regional (indigenous) innovation capabilities as a competitive leverage in technological innovation collaborations. This last point could also be a topic for potential future research: an investigation into how regional
innovation collaborations can be developed effectively within a transition economy context.
References
1. Chung, S., Building a national innovation system through regional innovation systems.
Technovation, 2002. 22: p. 485-491.
2. Hull, C. and J.G. Covin, Learning Capability, Technological Parity, and Innovation Mode Use. Product Development & Management Association, 2010. 27: p. 97-114. 3. Martínez-Román, J.A., J. Gamero, and J.A. Tamayo, Analysis of innovation in SMEs
using an innovative capability-based non-linear model: A study in the province of Seville (Spain). Technovation, 2011. 31(9): p. 459-475.
4. Tura, T., V. Harmaakorpi, and S. Pekkola, Breaking inside the black box: towards a dynamic evaluation framework for regional innovative capability. Science and Public Policy, 2008. 35(10): p. 733-744.
5. Zeng, X. and Y. Bao, On the Subject and Capability of Regional Innovation.
International Economics and Trade Research, 2008. 24(6): p. 12-16.
6. Strand, Ø. and L. Leydesdorff, Where is synergy indicated in the Norwegian innovation system? Triple-Helix relations among technology, organization, and geography. Technological Forecasting and Social Change, 2013. 80(3): p. 471-484. 7. Cooke, Regional Innovation Systems:competitive regulations in the new europe.
Geoforum, 1992. 23(3): p. 365-382.
8. Wonglimpiyarat, J., Innovation index and the innovative capacity of nations. Futures, 2010. 42(3): p. 247-253.
9. Archibugi, D. and A. Coco, A New Indicator of Technological Capabilities for Developed and Developing Countries World Development, 2004. 32(4): p. 629-654. 10. Porter, M.E., Competitive advantage: Creating and sustaining superior performance.
2008: Free press.
11. Sun, Y. and F. Liu, A regional perspective on the structural transformation of China's national innovation system since 1999. Technological Forecasting and Social Change, 2010. 77(8): p. 1311-1321.
12. Williams, R., et al., China and Global ICT standardisation and innovation. Technology Analysis & Strategic Management, 2011. 23(7): p. 715-724.