IMPACT_TEXT-APRIL15-03.DOC
Impact of Government Support Programs on Innovation
by Canadian manufacturing firms
Petr Hanel
Université de Sherbrooke and Centre interuniversitaire de recherche sur la science et la technologie (CIRST)
Paper for the International Conference: Evaluation of Government
funded R&D Activities,
Vienna, Austria, 15 – 16 May 2003.
Acknowledgements: My thanks for kind cooperation to F. Anderson, S. Schaan, B. Nemes, G. Sabourin, B. Plaus, N. Traore and F.Gault from Statistics Canada. I also benefited from discussions with P. Therrien from Industry Canada and D. Czarnitzki from ZEW (Germany). A. Bourezak provided competent computer work. The usual disclaimer applies.
Executive summary
The report presents results of the Statistics Canada Innovation Survey, 1999 regarding the use of government programs supporting R&D and innovation by Canadian manufacturing firms and the relationship between the support received and the R&D and innovation performance. The percentage of firms using the two principal instruments supporting R&D activities (R&D tax credits and R&D subsidies) and the other four more general programs, is increasing from the low to high technology sectors and from small to large firms. With minor exceptions, the same is also true for the collaboration with federal and provincial laboratories and universities.
Significant regional differences in the use of government programs persist even when the sector, the size of firm and their R&D activities are controlled for. Firms conducting R&D activities are more likely to use most of the government programs. These firms are also more likely to innovate. There is a positive association between the use of public support and the originality of the most profitable innovation. However, some of the positive association between the use of public support and the originality of innovation and its commercial impact observed in contingency tables disappears in regression analysis.
The probability of introduction of a more rather than less original innovation is analyzed under two alternative set of assumptions.
(1) First it is assumed that receiving public support and introducing innovation of certain originality are two independent exogenous decisions. Under this assumption the probability of introducing a more rather than a less original innovation is estimated by single equation logit regression models. The probability of introducing a more original innovation is increased when the innovating firm uses tax credits and technology assistance & support program.
Firms that received R&D subsidies are more likely to have a larger share of product innovations in firm's total 1999 sales than other firms are. The use of other government
programs is not correlated in any systematic way with the probability of an innovation, let alone a more original one.
(2) When it is assumed that the use (and/or selection) and the effect of government policies on innovation performance may be interdependent, results of a series of simultaneous two-stage logit models are less robust and less reassuring than single equation estimates. The positive effect of the use of tax credits on the originality of innovation appears less statistically significant in the simultaneous dummy variable ordered logit model but remains as strong as before in the simultaneous logit model predicting the probability of a world-first innovation versus a Canada-first one. However, none of the policy variables appears as a statistically significant determinant of the probability of introducing a “Canada-first” versus a “firm-first” or a “firm-first” versus “not involved in innovation” estimated in the other two simultaneous models.
Collaboration with federal R&D laboratories appears to increase the probability of
introducing the most original world innovation. Firms collaborating with colleges and universities are more likely to contribute to transfer of technology to Canada through a Canada-first
innovation.
The results of the simultaneous equation approach are at this stage experimental and should be interpreted as such. The presented results are in agreement with the most recent studies
evaluating the effect of government support to R&D and innovation abroad. They show that obtaining (or using) government support and the effect of the support on R&D or innovation should be treated as interdependent relations.
I. Introduction
It is widely recognized that innovation represents one of the most important
determinants of economic growth and increased productivity. It is also well known that the formal, organized R&D activity of business firms is only one of the components of innovation, and the extent of its contribution is the subject of extensive theoretical and empirical literature (see e.g. Griliches, 1988). At the level of a firm, a recent Canadian survey of small and growing firms attempted to identify the reasons why some firms are “innovative” and others are “non-innovative”. There are statistically significant
differences between innovative and non-innovative firms in many different dimensions of innovation. The largest gap between the two groups of firms is observed with respect to importance attributed to R&D as a factor of growth, spending on R&D relative to
competitors, and the percent of investment devoted to R&D by the firm (Baldwin and Johnson, 1995, p. 13).1
R&D spending by a profit-maximizing firm can be treated as a decision to acquire an asset. The optimal amount of such spending should proceed to the point at which the expected marginal return to R&D equals the marginal cost of funds. Estimates of the net private rate of return to R&D vary from 20 to 30 percent, while estimates of the social rate of return to R&D range from 20 to 100 percent, averaging approximately 50 percent (OTA, 1995, p. 4). The range of estimates for Canada is similar (Hanel, 2000).
If the social return on R&D is very high, government support of R&D may be justified even if one dollar of government spending (or tax expenditure) induces less than one dollar of new R&D spending. However, if the excess of social over private return to R&D is small, such policies may encourage sub-optimally high levels of private R&D
spending. The extent of this excess spending is impossible to evaluate, given the difficulties in determining the true opportunity cost of government spending (or tax expenditure).
The source of information used in the present study is Statistics Canada Survey of Innovation conducted in 1999.2 It provides information for a representative sample of
1 “Growing” firms were defined as those whose sales, assets, and employment increased over the last
half of the 1980s, and “small” firms were defined as having less than 500 employees and less than $ 100 mill. in assets in 1984. Among the factors determining competitive advantage, the most important
differences between successful and unsuccessful firms were in their R&D spending, production costs, frequency of new product introduction, and product range.
2 The sampling unit was provincial enterprise defined as being the accumulation of all
establishments having the same industry and province codes. Thus if a business operated in the same industry in three provinces, it received three questionnaires. Only enterprises with at least 20 employees and with a gross business income over $250,000 were selected. The questionnaire was sent to and responded by the CEO or a person designated by the CEO as the respondent. The rate of response was 90%. The usable sample includes 5220
manufacturing firms. Tabulations of the survey results by industry are available on a CD disk from the Science, Innovation and Electronic Division Statistics Canada. For further information on the survey see: Schaan and Nemes (2002).
5220 Canadian manufacturing firms.The quantitative information indispensable for an econometric estimation of social returns and effectiveness of R&D tax credits, grants and other public support programs was not available. The mostly qualitative information available from the survey is however rich in other respects. Chief operating officers or their delegated representatives were asked a series of questions regarding the
competitive environment in which their firms operate their winning business strategies and details on the introduction of new or improved products and production processes (innovation). Firms were asked to report their sources of innovation and also the use of a series of government support programs directly and indirectly supporting innovation and introduction of modern technology. The respondents were also asked to assess the originality of their principal innovation as well as the impact of their innovations on the sales of new or improved products.
The present study describes and analyzes:
1. The use of government programs in support of innovation and technological change by Canadian manufacturing firms.
2. The impact of these programs on the originality of innovation and the performance of manufacturing firms that use them.
The report is organized in the following way. A brief survey of the literature
presents in the next section major studies assessing the effect of government support to R&D in OECD countries and in Canada. It is followed by a descriptive statistical analysis of survey results on the use of government programs by innovating firms and their effect on innovation. An econometric analysis presented in the fourth section explores first the characteristics of firms using government programs. Then it analyzes the relationship between the use of government support programs and innovation, its originality and its effect on firm’s sales.
II. Review of the literature on the effect of government support on the performance of innovating firms
The published evaluations of the effectiveness of government support for R&D follow three different methodological approaches (OTA, 1995, pp. 22-25, and Dagenais et al., 1996, pp. 3-6).
- First, econometric estimation of the level of R&D spending as a function of
government grants and/or marginal cost (tax price) of R&D, as well as a set of other determinants of R&D, such as sales, demand trends, firm size, cash flow, etc. - Second, an event study, comparing behavior before and after a change in policy
(e.g. the market value of R&D-oriented firms before and after a change in R&D tax credit legislation).
- Third, questionnaire surveys and interviews attempting to determine how individual firms respond to a policy change.
In a summary assessment based on interviews and other US evidence, OTA (1995) concludes that R&D tax credits affect firms at the level of general budget considerations, but not at the level of strategic R&D choices. The latter derive largely from fundamental business and technological objectives of the firm, and the R&D tax credits play a
relatively minor role. They may, however, play an important role in specific
circumstances of specific firms, such as those facing liquidity problems, those on rapid R&D growth trajectories (e.g. telecommunications and information technology firms), and firms with market valuation strongly affected by R&D spending (e.g. biotechnology firms).
Evidence from French manufacturing firms suggests that government funding for R&D does not have much effect on firm productivity until it raises over 20% of firm R&D budget. At this point the overall productivity effect is positive (Hall and Mairesse, 1995).3
David et al (2000) show that R&D tax credits, subsidies and government
contracts have different effects on private expenditures of R&D by recipient firms. Tax credits are more likely to favor short-term projects with lesser spillover benefits.
Government grants and contracts and government spending on basic research should not displace private R&D funding except via its impacts on R&D inputs in inelastic supply. The outcome depends on market demand and supply conditions. Public funding may in some cases displace private funding, especially when political pressure for high success rate may lead to use public funding for projects that would otherwise be
financed by private funds. According to this article, about two thirds of all surveyed studies conclude that public funding is complementary to private financing, one third points out to a substitution between the two sources. The authors question, however, the validity of the evidence in favor of a complementary relation. The relationship depends on the level of aggregation of reported studies and on the country studied. Studies based on a lower level of aggregation (line of business and firm data) tend to report substitution almost as often as 'complementarity' [respectively 47% of all studies, and 58% of US studies (the US studies representing 2 /3 of all surveyed studies)]. The authors note that the tendency of aggregate studies showing a complementary
relationship could be result of:
(1) a positive covariation of public and private components and inter-industry differences in technological opportunity and/or
(2) The effect of government funding of R&D rising the cost of R&D inputs to private R&D activity. This would also lead to overestimating the effect of public R&D on private investment in R&D because the latter would include positive price effects. The econometric study by Guellec and van Pottelsberghe de la Potterie (OECD, 1998), analyzes the impact of publicly financed R&D and fiscal incentives on private R&D investment in seventeen OECD countries over the period 1981-1996. The study found that:
(1) On average, government R&D and tax incentives stimulate private R&D investments.
(2) Fiscal incentives have a short run effect on private R&D, whereas government R&D is stimulating in both the short and long term.
(3) The size of the impact of R&D subsidies varies with respect to the subsidization rate and has an inverted-U shape, denoting increasing effectiveness associated
3 For further evidence on effects of innovation and new technology on firm performance in several large and smaller industrialized countries see the survey in Economics, Innovation and New Technology 1998, vol.6 and 7.
to government R&D up to a threshold of about 15% and decreasing effectiveness beyond.
(4) The more stable the two policy instruments, the more efficient they are in stimulating private R&D.
(5) The two policy tools appear to be substitutes, raising one of them reduces the stimulating effect of the other.
(6) The government support linked to defense objectives seems to have a negative impact on private R&D investments.
The effect of government support to R&D in Canada was first examined by the pioneering study by Howe and McFetridge (1976). Government grants were found to induce the recipient firms to increase their own R&D expenditures in only one of the three industries studied. Bernstein’s (1986) results show that if output remains constant, each dollar of foregone government revenues generates approximately $ 0.80 of
additional R&D expenditures; when the effect of output expansion is included, the additional R&D expenditures are more than one dollar for each dollar of foregone government revenues. Dagenais et al. (1996) used a time-series of publicly available Compustat data (Canadian File) and published data from Statistics Canada to estimate the determinants of R&D expenditures for a cross-section of Canadian firms. They found that a one- percent increase in the federal tax credit to R&D yields about one dollar of additional R&D expenditure per dollar of tax revenues forgone. An evaluation of the performance of the Canadian federal R&D tax incentives conducted in 1995 and 1996 jointly by the Department of Finance and Revenue Canada found that the reported R&D expenditures were 32 percent higher as a result of the tax incentives. Each dollar of tax revenues forgone as a result of Canadian federal R&D tax incentives was
estimated to generate $ 1.38 in additional R&D spending. The survey of growing small and medium-size Canadian enterprises concludes that the score given by respondents to R&D tax incentives was second only to export incentives in distinguishing successful, as compared with unsuccessful firms. The successful firms also had a higher intensity of R&D investment and placed a significantly greater importance on innovations originating from internal sources (Baldwin, 1995, pp. 18-20). Grégoire (1995) attributed to generous fiscal incentives the two-fold increase of the number of small and medium size firms performing R&D in Quebec between 1986 and 1992.
An interview study carried out in Finland found that 85% subsidized projects would have been carried out in one form or another even if no public funding had been available Kauko (1996). The author concludes that contrary to econometric
assumptions, the public policy makers’ decision is rarely exogenous (in fact it depends on firm’s R&D intensity) and considering it as independent of R&D intensity of the firm introduces a serious simultaneity bias. The few studies that avoided this problem found that public subsidies are a rather inefficient stimulus for private R&D. Studies that found different results are potentially biased because of the endogeneity of subsidies. In a recent article Busom (2000) modeled the process of applying for and granting of R&D subsidies to Spanish firms. It rejected, however, the hypothesis of a statistically significant selection bias in the relationship explaining the use of public subsidies for R&D. The study found that in case of about 30% of firms the crowding out effect (public funds replacing private funding) can not be excluded. In accordance with theoretical
precepts, small firms are more likely to be subsidized than the large ones and the locally owned companies more than the foreign- owned ones. Favre, Syoum and Pfister
(2001) found that the domestic (French) R&D subsidies exert a positive influence on French firm own funding of R&D and international cooperation. In contrast, European subsidies, presumably because of administrative burden and specific inefficiency exert a negative effect on R&D intensity.
Aside from the direct support to R&D and innovation Governments support the private sector also indirectly through research conducted in public laboratories and universities.The influence of “public” (i.e., university and government R&D lab) research on industrial R&D in the US appears to have increased and spread over a larger
proportion of manufacturing industries than in the eighties. Public research both suggests new R&D projects and contributes to the completion of existing projects in roughly equal measure. University research impacts industrial R&D with published papers and reports, public conferences and meetings, informal information exchange and consulting relationships. These communication channels are much more important than the hiring of recent graduates, cooperative R&D ventures with universities, patents or licensing. Larger firms and firms that invest more in absorptive capacity and start-up firms are more likely to make use of public research than existing small and medium size firms (Cohen et al., 2002).
Collaboration with public and especially university labs is most intensive in science based industries (Leiponen, 2001). As much as it is possible to compare results of the 1993 and 1999 Innovation Surveys by Statistics Canada it appears that in Canada the proportion of firms that conduct R&D and collaborate with Universities has not increased over the last decade. Innovators cooperate more often than
non-innovators and firms that cooperate are more likely to introduce the more original innovations). Collaboration typically appears as a complement rather than as a
substitute for own R&D. As in the US, collaborating firms are more likely to be large than small and to belong to innovation and R&D-intensive industry sectors (Hanel and ST-Pierre, 2002).
The situation seems to be different in France. According to Mangematin and Mandran (2001), collaboration with academic and public labs in industries with low R&D intensity (in agro and foodstuff industry) increases the propensity to innovate of small and medium size French firms, that do not have internal research facilities.
Thus the evidence is mixed and there is little direct evidence regarding the effect of government programs on the originality of innovations. The studies surveyed above suggest that government support probably has some effect on private investment in R&D and innovation related activities, which, in turn, may encourage firms to innovate more intensively and come up with more rather than less original innovations. Firms that introduce more original innovations are more likely to report a positive impact of
innovation on company’s performance indicators (Cozzarin, 2001). It remains, however, an empirical question to determine:
(1) Which firms are more likely to solicit and obtain government support for innovation activities and (2) the effect of these support programs on innovation and its originality?
III. Use of government programs and their effects on innovation
The federal and provincial governments programs support innovation activity in Canada directly and indirectly in several ways. Tax credits have become the most important form of government funding of R&D and innovation in the mid-eighties. In addition to the Federal program of Tax Incentives for Scientific Research and Experimental
Development (Finance Canada, 1998), several provinces have introduced tax credit programs of their own. In addition to tax credits, both the federal and provincial
governments support R&D and innovation projects through R&D and innovation grant programs. Several other forms of government support are available and used by
manufacturing firms and the innovation survey asked firms to identify the most important of them. The survey included questions on the use of R&D tax credits, R&D subsidies and the use of programs supporting adoption of new technology, government
information programs and internet services, government support for manpower training and government venture capital support.
Both levels of government conduct research in federal research institutes and laboratories. Even though some activities of these government laboratories and institutes pursue activities responding to government own needs, many federal and provincial research programs are aimed at supporting innovation and technical change in private firms. Another increasingly important indirect support to innovation comes from the collaboration between industry and universities. Since both levels of
government are major sources of university funding, the collaboration between university and industry is included among indirect forms of government support to innovation. In response to questionnaire firms have indicated whether they collaborated with federal and provincial research laboratories and with universities and colleges.
Respondents of the survey were asked to classify their most important, i.e. most profitable innovation into one of the three categories.4 Only about 15% of innovating firms introduced the most original ‘world-first’ innovations. One out of four introduced an innovation for the first time in Canada and the remaining 60% of firms introduced a new or improved product or process already used by other Canadian firms.
Innovators use government programs more than unsuccessful innovators and those still more than firms that are not involved in innovation. Assuming that the
technologically more advanced innovations are more “worthy” of public support because of positive spillovers to the rest of economy and uninsurable risk they involve, the
findings that the percentage of innovating firms using most government programs is increasing from the low to the high technology sector is reassuring (Table 1).
Firms introducing more original innovations are more likely than their counterparts that introduce less original ones to use R&D and innovation support programs. There is a clear correlation between the ordering of firms by originality of their innovation (World-1st > Canada-1st >Firm-1st) and the proportion of firms using R&D tax credits, R&D
subsidies, government technology support & assistance and venture capital support. A similar relationship exists is also between originality and collaboration with federal, provincial laboratories and universities & colleges. The positive association between
4 About 88% of innovating firms did so.
originality of innovations and the use of government support programs remains, even though it becomes sometimes less close, within each technology sector (Table 2).
Other tabulations (not presented here) show that direct and indirect government support for R&D and innovation be used more frequently by larger innovating firms operating in technologically more advanced industry sectors. The simple tabulations do not, however, take into considerations other possible relationships between government support and the innovation performance, particularly the originality of innovations. This is the objective of a series of multivariate probability models presented in the next section of the study.
Tables 1 and 2 about here
IV. Use of government programs, their effects on innovation and the performance of innovating firms - multinomial and ordered logit regression models
This section presents first a theoretical model of the use of government support
programs by innovating firms and their effect on innovation. The empirical specifications are then estimated by multivariate logit regressions.
The first series of models estimates the probability of receiving (or using) a particular support program. The second set of models estimates the effect of government support on the probability (1) that a firm introduces a more rather than less original innovation and (2) of reaching a higher share of product innovations in firm's total sales.
Given the information on the use of government programs, its effect on the originality of innovation is explored in a series of binary yes-no responses. The probability that a firm responds in affirmative (yes=1) or in negative (no=0) to the question whether it
introduced an innovation of given originality is structured in an increasing order of originality in the following manner:
1. Introducing a firm-first innovation versus not being involved in innovation 2. Introducing a more original Canada-first innovation versus a firm-first and 3. Introducing a world-first versus a Canada-first innovation.
We first present briefly the theoretical formulation. This is followed by the specification of dependent and explanatory variables.
The theoretical models
(i) Probability of receiving government support
The questionnaire classifies information on the use of a wide range of government support of manufacturing firms in six thematic categories and according to federal and provincial funding. Except for the non-discretionary tax credit program automatically available for claimed eligible R&D expenses, a firm has to apply for a grant to public
agencies administering the numerous other support programs. Then the public agency has to decide whether to award the grant or not.
The firm has to decide to apply for a grant – or to claim a tax credit - and the granting agency to take a decision based on the eligibility criteria, objectives and resources of the program. It can be formalized for each firm as supply - demand relationship (Busom, 2000),
(1) D=Fd (Z, ε)
Where D is the expected profitability of applying for a R&D, dependent on a vector of firm and industry specific observable variables Z and ε, the error term including also unobservable variables.
(2) G=Fg (W, ω)
The value of the project to the granting agency G is a function of agency’s admissibility criteria, objectives and resources W and an error term including unobservable variables ω.
Conditional on expected profitability of innovation and on obtaining the public funding, the firm then decides to go ahead with the innovation or not. If it decides to go ahead it has to decide whether and how much R&D effort to make, how to organize it and what complementary activities to undertake in the process of creating the new product or process and using it on a commercial scale. The first part- the creation and realization of a new concept and its feasibility concerns more or less directly R&D.
(ii) Firm’s innovative response to government support
Presuming that the R&D effort decision is conditional on receiving or not the requested R&D support, it is possible to write two equations. The first (3), gives the firms R&D effort R1 in case of receiving the requested grant (participating in the program), the second (4) the R&D effort R0 in case of not receiving it (not participating in the program).
(3) R1= r1 (X1, µ1)
(4) R0= r0 (X0, µ0)
Where X1 and X0 are vectors of explanatory variables and µ1, µ0 error terms that may
include the effects of unobservable variables.
Estimations of the relationship (3) and (4) or other formulations, are used in the
literature to determine the impact of government support programs on a firm’s decision to increase or decrease its R&D effort, (i.e. the variation of firm’s R&D funded from own funds in reaction to obtaining government support). Unfortunately, the 1999 Innovation survey provides only information on whether a firm performs R&D (RDACT) or not, and if so, whether it is conducted in a separate R&D unit (RDSEP) or contracted out
(RDCONTR). Information on R&D expenditures or employment is not available. Thus with the data at hand it is not possible to explore the effect of government support on firm’s decision to allocate more or less resources to R&D.
The survey data provide, however, information on the originality of innovations. Introduction of a more original innovation (world or Canada –first) requires usually a more important R&D effort, larger resources and is riskier than imitation of products or production processes already in use by other firms in Canada (firm-first innovation). Previous analytical studies of the 1999 Innovation survey data (Pierre Therrien, 2000, Cozzarin, 2001 and Hanel, 2001) demonstrate a positive correlation between the originality of innovations and commitment to R&D. It is then possible to formulate a variant of equations (3) and (4) expressed in terms of originality of innovations, using an index IN of innovation originality rank order: IN=3- world first, IN=2- Canada first, IN=1- firm-first and IN=0, not involved in innovation.
(5) IN1= h1 (X1, µ1)
(6) IN0= h0 (X0, µ0)
Firms that benefited from support for R&D are expected to introduce more frequently original innovations than firms that did not. If this hypothesis is supported by the data, it is expected that firms that receive-or claim R&D subsidies or tax credits, or participate in other government support programs are more likely to attain a higher originality rank (o) than non-participating firms: IN(o)1 > IN(o)0.
Empirical application
The expected values D and G are not observed, IN1 is observed only for firms that used government programs, IN0 for those that did not. The latter two equations (5) and (6) can be estimated and will show whether there is difference in originality of innovations introduced by users and non users of government programs.
The demand for and the supply of government programs remain, however,
non-observable. The innovation survey did not ask firms to indicate whether they applied for government support programs and information from funding agencies is not available either. Therefore only the outcome of the interaction between the applicants and the funding agencies is observed. A binary variable Sd equals 1 if the firm applies for a grant. When the agency grants the subsidy, Sg equals 1. The structural relationships involving an observable binary variable S can be written:
(7) Sd =1 if D>0 and Sd =0 otherwise
(8) Sg= 1 if G>0 and Sg = 0 otherwise
Since we only observe who applied for and received a government support, the (7) and (8) are reduced to:
(9) S= Sd . Sg = g( Z,W, ε, ω)
A firm that applied and received the government support has S=1, otherwise S=0. The estimable equation (9) is a discrete choice model of participation in government programs and a logit or probit regression can estimate it.
The problem with this formulation is that the information on the use of government programs does not tell us what would have happened without the subsidies. Neither does it inform us whether a firm that decided not to apply would have performed differently it applied for and received the support. In the absence of counter-factual information neither the firms receiving support, or those not applying can be considered random draws (Klette at al. 2000). As observed and formulated, the equations (9) , (5) and (6) may not be mutually independent. The system may contain selection
mechanisms both at the side of firms and funding agencies, which may introduce biased results if not properly taken into account.
The problem of a selection bias has been only very recently recognized and dealt with in the literature on evaluation of government programs to bolster R&D. The methodologies used to estimate the counter factual outcomes from non-experimental data,5 are
borrowed mainly from empirical labor economics. The main three approaches are: - Parametric selection-correction method (Heckman, 1974a; Heckman et al., 1979;
Isabel Busom 2000).
- Instrumental variable simultaneous model approach ( Angrist et al. 1996), Imbens and Rubin, 1996; Wallsten 2000).
- Non-parametric matching approach (Heckman 1974b at al., 1999; Almus and Czarnitzki, 2001).
In the present study I use a two-stage simultaneous equation model with instrumental variables.6 In the first stage the instrumental and other exogenous variables predict the probability that a firm uses a particular governmental program. In the second stage the originality of innovation is regressed on the predicted probability of program use and other explanatory variables.
Dependent Variables
Use of government support programs (i) Government support programs
Public programs supporting R&D subsidize its cost either directly by grants or indirectly by tax credits. Other government assistance programs such as technology support and,
5The first reference is the major methodological source, the second a recent application of the methodology to evaluation of government support programs for R&D or innovation.
venture capital support, information and internet services and, very important and frequently used manpower training programs may also enhance private innovation activities and their originality. We create a series of binary variables GVTm which
identify the cases when a firm uses a particular government assistance program m by a value of one, otherwise the variable GVTm takes value zero. See Table 3 for the list and summary description of dependent and explanatory variables.
(ii) Introduction of innovation and its originality
The variable NOVEL represents the originality index IN(o) of innovation. It assumes three integer values, 0 for the non-innovating firms, 1 for firm that introduced a firm –1st, 2 for a Canada-1st and 3 for a world-1st innovation. The multinomial ordered logit model is estimated for the sample including all innovators and firms that were not involved in innovation.
In a series of alternative models the dependent variable takes the value 1 when a firm introduced an innovation of a given higher degree of originality and zero otherwise. To estimate the probability of introduction of an innovation of a given degree of originality, the sample of firms is selected so as to correspond to the hypothesis that is tested. For example, when estimating the probability of introducing a Firm-first innovation, the sample includes non-innovators and firms that introduced a Firm-first innovation. In a similar way, the probability of introducing a Canadian-first innovation rather than a Firm-first innovation, the sample of firms includes only firms that introduced one of the two innovations in question.
Explanatory Variables
Even though the primary interest of this study is to study the impact of government policies on the originality of innovation, the government policies are only one of the potentially significant determinants of innovation and its originality. Innovation is a highly firm specific activity, determined by firm’s characteristics, perceptions, strategies and activities. Some of the observed differences in innovative performance of firms are related to industry environment. These are related to technological opportunity and industry life cycle. Therefore, innovation is assumed to be a function of both firm-specific and industry-specific variables. Firm-specific variables include characteristics of the firm—such as firm size, and the country of ownership (unfortunately no information on ownership of firms is available in the 1999 Survey). Firm perceptions with regard to competitive environment and success factors (strategies) and firm activity variables— such as R&D, collaboration with other firms or public institutions and the use of intellectual property rights (IPR). Industry-specific variables include proxies for technological opportunity and industry and /or industry sector dummy variables.
Firm Characteristics Size
A measure of firm size is included in the innovation equations to test whether there are inherent advantages associated with the size of firm either with respect to innovation and its originality or with respect to impact of innovation on firm’s performance. The large size will matter if the Schumpetarian hypothesis that large firms have inherent
scale advantages is true. Earlier studies suggest that in Canada larger firms are more likely to innovate. They are also more likely than smaller firms to introduce the more original innovations ((J. Baldwin et al.2001).
Large firms are also more likely to benefit from innovations because the profit from an innovation depends on a firm’s market share. However, since the information available from the survey is limited to a simple yes-no answer regarding the positive impact of innovation on firm’s various performance indicators the quantitative measure of the impact is not available and the effect of size may not appear in the regressions. Due to easier access to financing, large firms can spread the fixed costs of innovation over a larger volume of sales and may benefit from economies of scope and complementary relations between R&D and other manufacturing activities. They could therefore be in a better position than small firms to take risks in introducing innovations in new fields such as environmental technologies. On the other hand, as firms grow large, their R&D activities become less efficient. Levin and Reiss (1989) reviewed the empirical evidence on the relationship between innovation and firm size and found it inconclusive.7 Economies of scale and scope may exist, but may be exhausted at only medium-size firms. 8
Size is measured by the total number of employees in a firm TOTEMP or shipments TSHIP in 1997 and their respective squares TOTEMP2 and TSHIP2. These variables are also used as instrumental variables to predict the use of R&D tax credits and R&D subsidies by innovating firms. Alternatively firms are classified as belonging to one of three size categories—20 to 49 employees =SIZEA, 50 to 249 employees = SIZEB and firms employing more than 250 employees, SIZEC.Based on this, three binary variables have been constructed to capture size effects.
Hourly wages WA and value added per employee VA and the price-cost margin in the initial period are also experimented with. Firms with low wages and/or low VA, are likely to be found in labor intensive firms. These firm specific variables may prove useful in transcending the industry or sector characteristics.
Firm’s perceptions Competitive Conditions
The degree of competition faced by a firm may be one of the incentives to introduce an innovation. In contrast to earlier studies which considered market structure of an industry as one of the major exogenous determinants of innovation, the theoretical ((Dasgupta and Stiglitz, 1980), and empirical work by Levin and Reiss (1984, 1988) and (Cohen and Levinthal 1989) suggests that it is more likely to be an endogenous outcome of dynamic
7The research reviewed by (Cohen and Levinthal 1989) tends to regard the failure of the empirical literature to obtain robust results on how innovation is related to size of firm and to market structure as an indication that these relationships are more complex than previously believed. More complex modelling of technological change ((Levin and Reiss 1984, 1988, suggests that innovation, the size of firm and market structure are mutually dependent variables.
8Keep in mind however, that what is considered here a large firm (a firm employing 250 persons or more ) is barely a medium size firm in the U.S. context.
growth of innovating firms.
The impact of innovation on the performance of the firm depends also on competition faced by the firm. An innovation introduced in a highly competitive market may not contribute to firm’s profit as much as if it were introduced in a market dominated by the innovating firm.
The concept we want to measure is the degree of competition faced by a firm. The firm’s representatives were asked to score their agreement with several statements that describe the degree of competition faced by the firm. The competition variables take the value of one when the responded agrees or strongly agrees with the statements that the high degree of competition (variable HCOMP) 9 is important or very important.10 Another proxy variable for competitive challenge is the threat of rapidly changing production or office technology, TECHCH. Otherwise the variables take value of zero. Firms in rapidly moving fields often face difficulties hiring and retaining qualified staff and workers. The variable STAFF takes value one when a firm indicates that this problem is important or very important and zero otherwise.
Competitive strategies-success factors
In response to questions on success factors firm representatives revealed what they considered to be successful competitive strategies. Responses to questions related to firm’s success were used to construct three variables. The first NEWMT captures responses that give a high score to the importance of new markets and new products for the success of the firm.11 The next, EXPMT identifies firms that draw their success from export markets. A more general strategy is associated with promotion of the firm or the product reputation. This variable REPUT identifies firms adopting a strategy that may be associated with the use of Trademarks.
Firm Activities
Research and Development
Even though firms not involved in R&D activities introduced 32 percentof innovations, R&D remains the principal input for innovative activity (Baldwin, Hanel, Sabourin, 2001). Firms that have established an effective R&D program are more likely to innovate for several reasons. First, R&D are aimed at creating and developing new and improved products and processes. Second, firms that perform R&D are also more receptive to the
9 Agree or strongly agree with the statement:
Q1b= My clients can easily substitute my products (goods and services) for the products of my competitors.
Q1d= The arrival of new competitors is a constant threat.
Q1e=The arrival of competing products (goods and services) is a constant threat. Q1i= My products (goods and services) quickly become obsolete
10 We first tried to reduce the scores on eleven competitive environment related questions to a smaller number of factors by a principal component analysis. Since the results of this more complex approach are less transparent and statistically not better than the ones reported above, we abandoned the principal component approach.
11 Respondents rated the importance of the Q2a = “Seeking new markets” and Q2c Developing niche or specialized markets”.
technological advances made by others and able to absorb and adapt spillovers to their advantage (Cohen and Levinthal, 1989). A binary variable RDACT takes the value one when the firm carries out R&D and zero otherwise.
The way firms organize their R&D activities - establishing a separate R&D unit and/or contracting R&D is likely to influence their innovation performance and its impact on the bottom line. The presence or absence of a particular organization form is again
identified by a set of binary variables. When a firm conducts R&D in a separate division, the variable RDSEP=1, otherwise, RDSEP=0. Some firms contract out all or specific parts of R&D task; the variable RDCONTR equals one in this case and zero otherwise. Successful profitable firms are more likely to generate the flow of internal financing to support R&D and innovative activities. Profitable firms may also have developed skills and experience that facilitate not only their innovation activity but also their success in obtaining government financing through government R&D grants and support to venture capital and other programs. The price-cost margin ( the Lerner index, cf. Cozarrin, 2001) PRCO computed for the period 1997 is used as a measure of firm’s profitability in the initial period.12
Collaboration
One of the distinctive features of innovative firms is their tendency to collaborate with other firms (suppliers, clients, consultants and competitors) with their parent and sister companies and with universities & colleges and public R&D laboratories. Collaboration with public institutions FED_lab, PRO_lab and UNICOL denote the case of
collaboration with federal laboratories, provincial laboratories and university & colleges respectively. Collaboration with other firms is identified by variable COLLPRI. The collaboration with any of these partners is identified by the dummy variable COLLAB.
Activities linked to innovation
In addition to information gathering and R&D activities, bringing a new product or process to the market involves complementary activities such as acquisition of new machinery and equipment, engineering and design, tooling and production start-up and training. The dummy variables EQPT, ENGN, TOOL and TRAIN indicate the use of these complementary activities, taking the value 1 if used and zero otherwise.
Industry Sector Effects
Technological opportunities differ across industries when the scientific environment provides more fertile ground for advances in some industries than others.13 Progress in science reduces the cost of technological advance generated per unit of R&D
expenditures. There are also important inter-sectoral differences in profitability, knowledge intensive sectors and industries showing a superior performance on most indicators (Lee and Haas, 1995). The classification of a firm in one of the three
12 Unfortunately, the manufacturing census data for the firms that participated in the Innovation survey
are available for the beginning period, 1997 only. Thus it is not possible to compute the change in the price-cost ratio over the 1997-1999 period, which would be a good proxy for the variation of firm’s profitability.
technology sectors (High, medium and low technology provides an approximate proxy for technological opportunity.14
Industry specific effects
Industries vary widely not only with respect to technological opportunity and their position in technology life cycle but also with respect to the degree of exposure to external competition, availability and cost of factors such as specialized manpower, natural resources etc. Thus relying on a simple three technology typology (high, medium, low or alternatively core, secondary and ‘other’) may not capture those other industry specific conditions that may have a bearing on innovation and use of
intellectual property protection. A set of industry dummy variables identifies the 23 major manufacturing industry groups at the two-digit NAICS level.
The intensity of R&D expenditures (R&D/ revenue) of the 2-digit industry to which each firm belongs RD is used as one of instrumental variables in the first stage equation predicting the use of R&D tax credits and R&D subsidies in the simultaneous model.
Province-specific effects
In addition to federal policies in support of R&D, innovation and new technology and manpower training, depending on their location firms have access to provincial
programs. Owing to provincial R&D tax credit programs the real cost of conducting R&D varies from one province to another (Warda, 1997). Innovation also depends on the institutional environment in which enterprises operate. The recognition of the importance of the complex relationships between the private sector and its institutional environment led to the concepts of national and regional system of innovation.15 Many aspects of education and science, technology, industrial and fiscal policies are provincial
responsibility and are likely to affect innovation and its impact on firm’s performance. Provinces also differ with respect to environmental and regulatory requirements and policies. To explore whether the province of residence of a firm affects the orientation of innovation and its economic impact a set of dummy variables identifies the province of residence of the firm. In some logit regressions the provinces are regrouped in regions. The list of variables and their characteristics is presented in Table 3.
Table 3 about here
Results of estimations
In the first two parts of this section are presented results of simple and ordered logit regressions estimating:
(1) The probability that a firm uses a particular government program and
(2) The probability that a firm introduces a more rather than less original innovation.
14 This particular taxonomy is used since it was a requirement specified in the contract. An alternate
taxonomy based on Robson at al.(1988) three innovation sectors (Core, Secondary and ‘Other’) would have been the authors preferred choice. It is based on a clearer theoretical framework than the requested OECD taxonomy. It has the additional advantage to result in a less skewed distribution of the number of innovating firms (See Table 2.2).
In the last part are presented results of estimations of the simultaneous model.
1. Discrete choice logit regressions predicting the probability of obtaining a government support
The descriptive analysis presented in the first part of the paper shows that the use of different support programs is related to the size of firm, the sector and industry of its activity. Obviously, the list of variables that might be associated with a firm’s decision to apply for and succeed in receiving a particular grant is longer. Here we present the results of a series of logit regressions that estimate the reduced form of the equation (9) for the individual government support programs.
The first two of the six categories of government programs GVT_m provide support to R&D activities :
- research and development tax credits (GVT_TXC) and - government research and development grants (GVT_S)
The other four categories are more general in nature and do not concern exclusively the R&D- innovation nexus, even though they are likely related to it and may contribute to its impact on the innovating firm’s performance:
- technology support and assistance programs (GVT_AT), - information or internet programs (GVT_INT),
- government venture capital support (GVT_RIS) and government support for training (GT_FO).
The granting decisions of provincial and federal agencies are not necessarily independent.16 Since our analysis is concerned with the impact of all government programs on the originality of innovation, the use of federal and provincial programs is regrouped. A more in-depth analysis at provincial level would be required to isolate the impact of federal and provincial programs.
Each dependent variable GVT_m takes value GVT_m =1 when the firm indicated to have used (received) a government support m (federal and/ or provincial ) of the given type during the 1997-1999 period, otherwise GVT_m = 0.
Estimation procedure
The initial vector of all explanatory variables is identical for all six equations. The
stepwise logit regression procedure proceeds to select those explanatory variables that have regression coefficients significant at 15% level or higher. The results of bivariate logit regressions estimating the probability of a firm using the particular program GVT_ m are presented in Tables 4 and 4a.
The results show that obtaining a government support is to a significant degree related to economic characteristics of firms, their activities and industry sectors in which they
16 Experimental regressions treating federal and provincial support programs separately often
operate. As formulated and estimated it is assumed that the right hand variables are truly exogenous.
Use of R&D tax credits
The R&D tax credit program (GVT_TXC) is sector-neutral in the sense that any firm, which incurred eligible expenditures, may claim the tax credits. Since a firm has to perform R&D to be eligible, the dummy variable that identifies firms that perform R&D activity was not included in the regression.17 Even though the program is designed to encourage small firms,18 the descriptive analysis shows that small firms use R&D tax credits less frequently than the large ones. The logit regression confirms that the
probability of using the tax credit program increases with the size of firm measured here by the total employment, TOTEMP. As indicated by the extremely low negative
coefficient of the square of total employment ( TOTEMP2), the relationship is almost linearly proportional. The R&D intensive sectors use the program more often than others do. Firms conducting R&D in a separate R&D unit and those that contract R&D out and collaborate with federal laboratories, are more likely to use the tax credit program than firms less committed to R&D. Firms operating in the predominantly consumer good oriented low technology sector are less likely to use R&D tax credits than those in the medium and high technology sector. The significant positive correlation between the use of tax credits and the use of intellectual property, notably patents, confirms the
commitment of tax credit claimants to R&D and by implication to innovation. Firms that are developing new markets and exporting are more likely to use R&D tax credits than firms competing only on the domestic market. Firms using tax credits are also more likely to adopt new technology or equipment and use engineering services in their innovation process. The provincial dummy variables show that all things being equal, firms from Quebec have the highest chance of obtaining a tax credit. This is in line with the relative generosity of provincial R&D programs (Warda, 1997). The logit equation classifies correctly (as users or non-users of tax credits) 80% of all firms and explains more than one third of total variance.
Use of R&D grants
The support of R&D via direct grants is again positively related to the size of firm, this time measured by the value of total shipments. The hourly wage appears with a negative sign, suggesting that the program may be tilted towards labor intensive firms paying low wages. Firms more committed to R&D and using intellectual property
protection are more likely to apply for and receive R&D grants than other firms. Training linked to introduction of new or improved products and processes increases the
probability of receiving an R&D subsidy. In contrast, firms negatively affected by high competition are less likely to receive R&D grants. The logit equation classifies correctly more than three-quarters of all observations.
17 However, this seems not to be always the case. A combination of inconsistent responses i.e. design
error in addition to imputation error and keying error results in about 8% of firms reporting to use R&D tax credits (Q29a) and at the same time reporting not undertaking R&D activity.
Use of technology support and assistance programs
As is the case for all other programs with the sole exception of the support to venture capital, large firms are more likely to use the technology support and assistance (GVT_AT). The use of the program is not related to R&D intensity of the industry but exporters use it more than non-exporters and the users are well connected as
evidenced by the positive sign of the collaboration variable. Firms in Ontario and Western Canada are less likely to use technology support and assistance grants than firms in Quebec and Maritimes.
Government information programs and Internet services
Larger firms and firms paying higher hourly wages and conducting R&D in separate departments are more likely to use of government information programs and internet services (GVT_INT) than other firms.
Government support for training
The second most frequently used program after R&D tax credits is the government support for training. The most likely users of this program are large employers facing high unit labor costs (high hourly wages and low hourly value added) operating in R&D intensive industries. Otherwise firms that received public support for training share most of other characteristics with users of programs described above, including the regional pattern favoring Quebec and Atlantic Canada. In contrast to logit regressions explaining the use of R&D support programs, this one performs rather poorly in classifying
correctly only about 44% of all observations, suggesting that some important
determinants of the use of manpower training programs may be missing in the equation.
Venture capital support
There are very few systematic characteristics of firms that received venture capital support (GVT_RIS).
Table 4 and Table 4a about here
Results of estimation of the system of endogenous equations by the two stage logit procedure with instrumental variables
The ordinary logit regressions presented above suggest that the two government programs linked to R&D (GVT-TXC, GVT-S) and to innovation through introduction of new technology and equipment (GVT_AT) are increasing the probability that users introduce a more original innovation than non-users. The observed ‘use’ of these programs may, however, be affected by a selection bias. The first program is subject to auto-selection,19 the second and third to agency selection bias. To deal with the
problem, the policy variables GVT_TXC, GVT_S and GVT_AT, were regressed on a set of instrumental variables TOT EMP, TOT EMP2, RD (the R&D intensity of the 2 digit
19Some firms may decide that the transaction cost of applying for R&D tax credits (conforming to strict
accounting rules regarding eligible expenditures etc) may not be worth the expected value of the tax credit.
industry to which the firm belongs) and other explanatory variables.20 Unfortunately, the fit of these regressions is not very good, especially for the GVT_AT, which, for this reason, was not instrumented. The originality of innovation dependent variables were then regressed in the second stage on the predicted values of policy and other
explanatory variables.
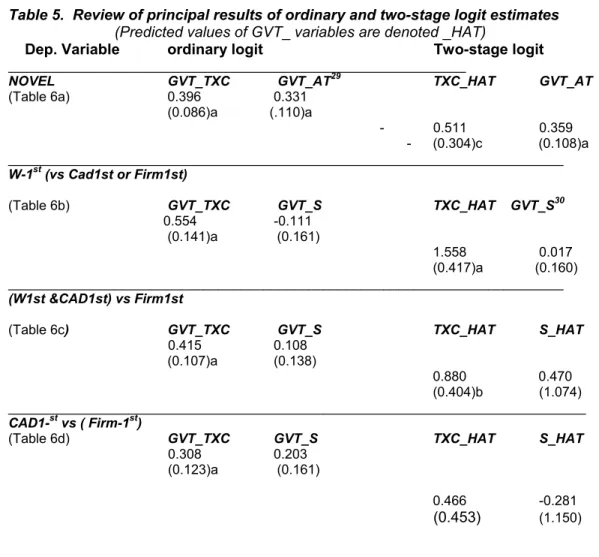
The estimated regression coefficients, their standard errors and other statistics are presented for each model separately in Tables 5a to Table 5d. Each table presents in the left section the coefficients estimated for the single equation model and in the right section the 2 stage simultaneous model.
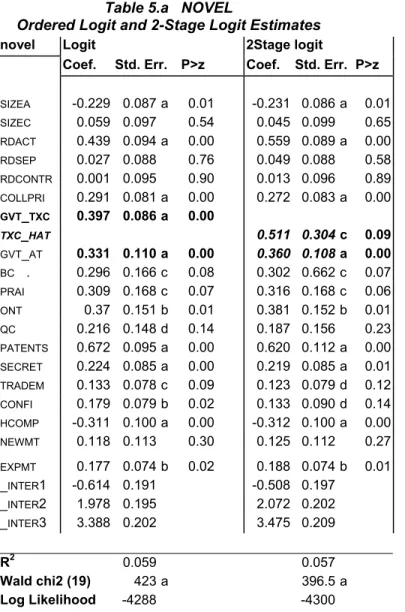
The first model is an ordered logit regression of the dependent variable NOVEL that stands for the index of innovation originality (_inter1 is the intercept associated with the probability of introducing the world first innovation, _inter2 for the Canada 1st and _inter3 for the firm 1st innovation). Since the data reject the proportional odds
hypothesis for the ordered logit models, the underlying relationships between adjacent levels of originality are next estimated in a series of models which specify the probability that a firm introduces a more rather than a less original innovation. Thus the first model estimates the probability of introducing a world-1st versus a Canada 1st, then a Canada 1st versus a firm –1st and finally a firm 1st innovation versus not being involved in
innovation.
A summary of estimated regression coefficients and standard errors associated with government support variables is presented in the Table 5 below. In the left section of the table are presented estimates of the single logit equation, in the right one those of the 2nd stage of the simultaneous model. The regression coefficients of the R&D tax credit and R&D subsidy programs variables ‘predicted’ in the first stage are denoted TXC_HAT and S_HAT respectively.
Interpretation
Only the tax credit variable shows a consistently positive effect on the originality of innovation. When the endogeneity is taken into account in the two-stage logit regression (2SLR) the regression coefficient of the instrumented TXC-HAT variable increases and remains statistically significant for the ordered probit NOVEL (Table 5a). It is also statistically significant in the specifications estimating separately the probability of the most original World -1st versus Canada-1st and (World-1st or Canada-1st) versus Firm-1st innovations (Table 5 b and c). It is, however not statistically significant for the Canada-1st versus Firm-1st model.(Table 5d).
The results taking into account the endogeneity involved in the use of tax credits: - Confirm the existence of a positive association between the use of R&D tax credits
and the probability of introducing a World-1st innovation (and to a lesser degree
20 See a similar approach used by Wallsten (2000) to estimate the effect of R&D grants on R&D investment of small firms in the US.
also a World or Canada 1st innovation versus an imitative firm-1st one) found in the ordinary logit regressions.
- Suggest that the true effect of R&D tax credits on the originality of innovation may even be larger than indicated by the regression coefficient of the ordinary logit estimates. The estimates using instrumental variable taking into account (admittedly imperfectly) the self-selection bias suggest that the observed effect of GVT-TXC is marginally smaller than would be the case if all eligible firms had used tax credits. - In contrast, the R&D subsidies do not appear to be a significant factor determining
the originality of innovations.
- The subsidies for equipment and technology support, GVT_AT, appears as a
significant explanatory variable in the NOVEL ordered logit equation only. A detailed exploration of the relationship by a series of logit regressions for the adjacent levels of originality shows, however, that the regression coefficient of the GVT_AT variable is never statistically significant. The attempt to predict the use of this form of
government support gave particularly poor results since only about 5% of the total variance of the GVT_AT variable is explained by the instrumental and other
explanatory variables. Inclusion of the predicted values of AT-HAT in the logit regression results in a poor estimates not presented here.
The differences between the estimated coefficients of the single and the 2-nd stage equations suggest that the endogenous variables are indeed interrelated and should be modeled as such. The robust standard errors of the regression coefficients of predicted policy variables in the 2nd stage stage equation are generally higher than those
estimated in the single logit regression. 21
Given the mediocre fit of the instrumental variable estimates I also attempted to use Heckman’s approach to identify and deal with the selection bias. The attempts were so far not successful and are not reported here. One of the reasons being the dichotomic nature of our dependent variables which does not agree with Heckman’s formulation.22
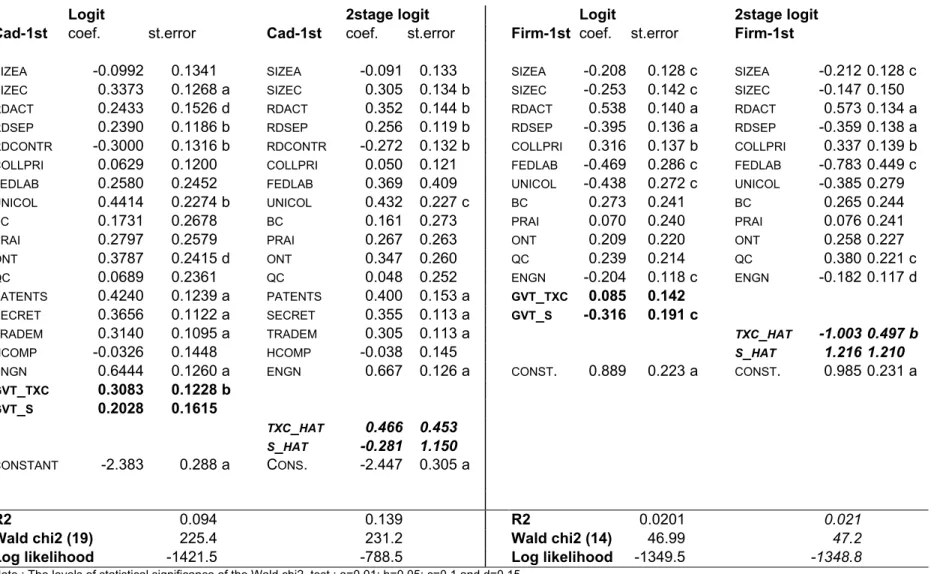
Collaboration with government laboratories and university and colleges
Results not presented here23 show that firms that collaborate with other firms and or federal, provincial and university & college laboratories are more likely to use more frequently than non-collaborators the R&D tax credits, R&D grants and technology
21 Even thought the robust standard errors are generally larger than the ordinary standard errors, they
may still underestimate the assymptotically consistent variance. Unfortunately neither the SAS nor the STATA software available at Statistics Canada include the two stage logit or probit estimation procedures and therefore the assymptotic standard errors could not be obtained at this stage of the project.
In contrast to SAS results reported in all other tables that are weighed by frequency weights, the STATA software for predicted values of variables accepts only probabilistic weights which, for this reason had to be used for regressions reported in Tables 5a to 5d.
22 Authors that used Heckman’s model for evaluation of a R&D support program, the first stage selection equation estimated with a Probit determines whether there is a selection bias and how important it is. The corrected, selection bias free program variable is then plugged into an OLSQ which evaluates the effect of a selection bias free program variable on firm’s R&D expenditures.
23 The regression coefficients of the variable COLLAB are mostly positive and highly significant in all
assistance program. They are also more likely to succeed in innovation24 and to introduce the more original innovations.
Attempts to estimate the contribution to originality of innovation of each type of collaboration partner separately were mixed. First, firms that collaborate with federal labs are also likely to collaborate with provincial laboratories and the correlation
between the two (r=0.58) results in multicollinearity when both variables are included in a logit regression at the same time. Since the meaningful way to estimate the effect of provincial programs on innovation and its originality is to work on the provincial level, the collaboration with provincial laboratories was excluded from regressions.
Without presenting in detail all estimated regressions25 the probability that a firm uses R&D tax credits is significantly increased in case of firms that collaborate with federal laboratories. This interdependence between GVT_TXC and FED_LAB introduces an additional potential source of endogeneity in the relation between the originality of innovation and the use of direct government programs. The estimated effect of
collaboration with federal laboratories on the world-first versus Canada first innovation is positive and statistically significant in the single equation logit estimation. It looses the statistical significance in the 2 stage simultaneous model. The collaboration with universities and colleges increase the probability of introducing a Canada-first
innovation versus a firm-first innovation but the effect is statistically less significant in the 2stage estimation.
In contrast, collaboration with private firms is increasing the probability of a world-first rather than Canada first innovation but does not influence the probability of introducing a Canada first rather than a firm-first innovation. Collaboration with private firms is also statistically significant in the ordered regression model. In conclusion, the evidence of the effect of collaboration with federal laboratories and universities & colleges on the originality of innovation varies from model to model and is less robust than the effect of direct forms of government support such as R&D tax credits.
Tables 5, 5a to 5d and 6 about here
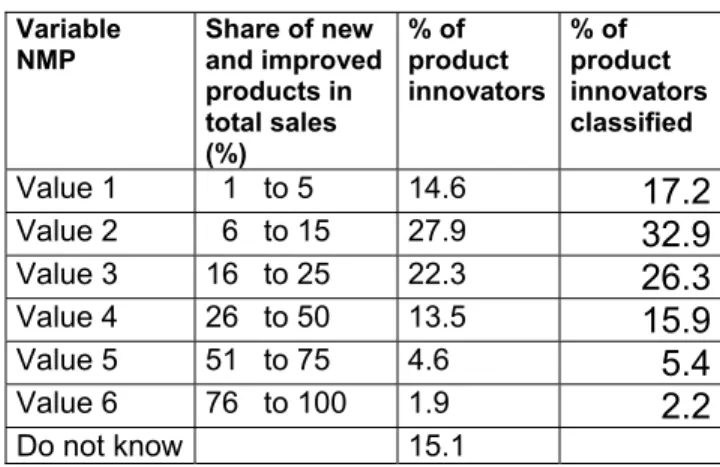
Impact of government programs on the share of product innovations in total sales
In order to assess the impact of innovation on the performance of innovating firms, the survey solicited information on the share of new and significantly improved products introduced in the course of the 1997-1999 total sales in 1999. This indicator of innovation performance is available for the subset of firms that introduced product innovations or both product and process innovations. The higher the share, the more successful the commercial application of the innovation, the higher the index of
24 The probability of being an unsuccessful innovator rather than a successful one is significantly higher
when a firm does not collaborate with other firms and/or institutions (results available on demand). 25 Details are available on demand.
commercial success of innovation. The share of sales accounted for by product innovations is converted in an interval value dependent variable, NMP presented in Table 7.
Since the index values (one to six) are not a linear function of the underlying sales’ share intervals, the relationship is modeled as an ordered logit function rather than as a linear regression.
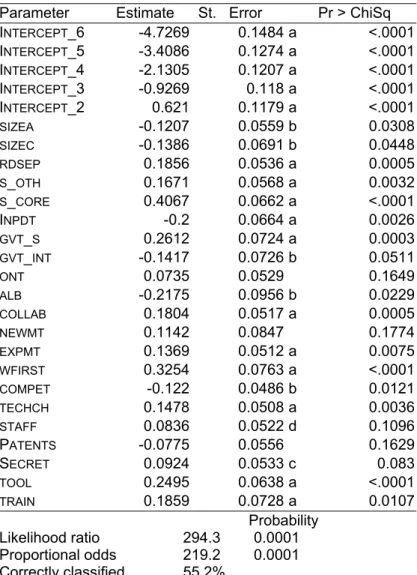
The results of the ordered logit regression with six intervals are presented in Table 8. For example, the probability of a firm’s share of new products accounting for between 76 to 100% of total sales is given by the equation including the intercept 6. In a similar manner, the equation with the intercept 4 estimates the probability that the firm’s share of new products is between 26% and 50% etc.
Even though some of the estimated coefficients presented in Table 8 may be biased,26 a series of experiments with alternative specifications show that variables whose
regression coefficients are statistically significant here are statistically significant in other specifications27 as well.
Medium size firms that introduce the world-1st innovations, conduct R&D in separate unit and accompany their innovations by tooling, start-up and training activities have a better chance to obtain a high share of product innovations in total sales. Both the smallest and the largest firms are less likely than the medium size firms (the left-out default firm size category) to have a high share of product innovations in total sales. Collaboration with other firms and institutions and exporting increases the product innovation’s share of total sales. On the other hand, firms exposed to competitive
threats from new products and competitors and firms located in Alberta are less likely to increase the product innovations’ share of total sales.
Receiving R&D subsidy increases the probability of a firm’s reporting a larger innovation share in total sales, the use of government information services reduces it. In contrast, tax credits do not have a direct influence. However, as the logit regressions of originality of innovation show, firms receiving tax credits are more likely to introduce world-1st innovations. These have a better chance to obtain a higher share of product innovation sales than the less original innovations. Thus it can be argued that even thought the use of tax credits does not affect directly the share of product innovations in total sales, it increases the probability of attaining a higher share category indirectly by increasing the probability of a world 1st innovation.
Table 7 and 8 about here
26 The proportional odds assumption is rejected by the data.
27 A three share interval ordered logit model and a bivariate logit model splitting the share intervals into
two, less and more than 15% share of total sales accounted for product innovations show qualitatively very similar results to those presented here.