Comparison of Adaptive Neuro-Fuzzy Inference Systems
and Echo State Networks for PV Power Prediction
I. Jayawardene and G. K. Venayagamoorthy
Real-Time Power and Intelligent Systems (RTPIS) Laboratory, The Holcombe Department of Electrical and Computer Engineering,Clemson University, SC 29634, USA
rjayawa@clemson.edu and gkumar@ieee.org
Abstract
Use of photo-voltaic (PV) power as a source of electricity has been rapidly growing. Integration of large PV power into the grid operation introduces several challenges. Uncertainty of PV power generation causes frequency fluctuations and power system instabilities. Due to this, short term PV power prediction has become an important area of study. Short term PV power prediction supports proper decision-making in control centers. Power generation output of a PV plant is highly dependent on different weather conditions such as solar irradiance, temperature and cloud covers. Weather data analysis and prediction can be considered as big data due to its complexity and dynamically changing characteristics. In this paper, an adaptive neuro-fuzzy inference system (ANFIS) is developed and compared with an echo state network (ESN) for short term PV power prediction. The ANFIS approach consists of three ANFIS modules for predicting solar irradiance and temperature, and then estimating the PV power, respectively. The ESN on the other hand predicts the PV power based on current weather parameters. A weather database containing data sampled every second is used in developing the ANFIS and ESN based PV power prediction systems. Results are compared under different Clemson, SC weather conditions with the two approaches.
Keywords: adaptive neuro-fuzzy system, big data, echo state network, photo-voltaic system, power system, short term prediction, weather data.
1
Introduction
Photo-voltaic (PV) power is produced by converting solar energy into direct current electricity using semi-conducting materials with photo-voltaic effect. High availability of solar irradiance, no production cost and minimal maintenance cost make the generation of PV power econom-ically beneficial. Moreover PV power usage is environmental friendly and sustainable [16]. Increasing requirements and government policies on cleaner sources for electric power genera-tion with reduced generagenera-tion cost accelerates the producgenera-tion of PV power and its integragenera-tion
Volume 53, 2015, Pages 92–102 2015 INNS Conference on Big Data
92Selection and peer-review under responsibility of the Scientific Programme Committee of INNS-BigData2015 c
into the electric power grid. On the other hand, high levels of PV power penetration in the elec-tric grid introduces several operational challenges. Uncertainty of PV power generation is the most challenging issue, which introduces frequency fluctuations and instabilities of the power system. Predicting PV power generation over short time periods can overcome the shortfalls of inaccurate decision-making under uncertainty such as near real-time operational planning in support of control centers [7].
There are various approaches proposed for predicting PV power over small time intervals. A statistical approach was presented in [3] which uses three modules including weather predictors to forecast the hourly PV power generation. Artificial neural networks (ANNs) have been widely used for PV power prediction [7],[20] and load forecasting [15],[14],[2]. ANN is an information system which mimics some behaviors of biological neuronal system. Basic concept in ANN is learning from experience. Reservoir based computing network is a type of ANN, suitable for predicting and solving non-linear systems, and predicting time series such as PV power generation under changing weather conditions. Echo state networks (ESNs) and extreme learning machines (ELMs) are commonly used reservoir based computing networks [7]. ESNs are more powerful compared to ELMs particularly for time series predictions where current state of the reservoir is depending on the previous states [8]. ANNs are suitable for learning big data sets and other technologies used in learning big data can be exploited to train ANNs on such datasets [18].
Fuzzy systems are useful in modeling uncertainties and handling vagueness in data. Fuzzy systems have been used for different decision making applications such as power systems con-trol [13],[17], short term load forecasting [10] and time series prediction [6]. Combination of neural networks’ adaptive capabilities and fuzzy logic uncertainty modeling capabilities results in robust information processing systems [5]. Adaptive neuro-fuzzy inference systems (ANFIS) is an integration of neural networks to develop fuzzy inference systems from input-output data sets. ANFIS is a suitable approach for weather and PV power output predictions [4],[19] which requires uncertainty modeling and previous behavior adaptation for more accurate predictions. More resilient, sustainable and efficient power system operations can be established with the introduction of big data techniques in power systems [21], [12]. Weather data and PV power prediction can be classified as a big data problem for all purposes when dynamical systems (electric grid) are involved. This problem includes the important characteristics of big data such as volume, velocity, variety, value and veracity [1]. In this study, the ANFIS method is developed and compared with ESN approach for predicting short term PV power generation. The PV power output prediction for 35 seconds ahead is studied for purpose of real-time power system operational control with variable generation. This time period is considered as short-term prediction. Both approaches are tested under different weather conditions from a historic database of Clemson, SC, weather profiles. Short-term PV prediction results can be applied for tie-line bias control in a multi-area power system with large PV plants. Predictions improves the performance of automatic generation control that is implemented to maintain the system frequency and dynamic tie-line power flow control [7].The remainder of this paper is organized as follows. Weather database used in this study and two prediction approaches are described in section 2. In section 3, typical results and discussions are provided. Finally, concluding remarks and future work are given in section 4.
2
Photo-Voltaic Power Prediction
This section describe the weather monitoring system, the ANFIS development methodology and ESN architecture used in this study.
Figure1: Schematic diagram of adaptive neuro-fuzzy inference systems for PV power prediction
2.1
Weather Monitoring System
Real-Time Power and Intelligent Systems (RTPIS) laboratory, Clemson University, SC is equipp ed with a real time weather monitoring system which monitors, visualizes and stores the weather conditions in Clemson, SC. Four weather parameters including solar irradiance, temperature, wind speed and wind direction are collected by the system and display all four weather param-eters in real-time every each second. Weather system stores data since its operation from June 1st 2013 to the current time. The size of the database is rapidly increasing day by day due to the archival of every second data. The main characteristics of big data - volume, velocity and variability - is apparent with the data stored in RTPIS weather monitoring system.
Inputs to the proposed PV power prediction methods are obtained from the weather data starting from June 1st 2013 to April 10th2015. A data set consisting of twelve representative days is selected for the development of the ANFIS and ESN for PV power prediction. Twelve days of data includes weather patterns of sunny, moderate and cloudy days in all four sea-sons of the year for Clemson. The selected data set includes 1,036,800 number of records (a record indicates one second) and this is made up of a total of 13 parameters (solar irradiance, temperature and PV power).
2.2
ANFIS Prediction Methodology
Neural networks and fuzzy systems are useful computational intelligence (CI) paradigms in expert decision making systems. Integrating neural networks with capabilities to learn from experience with fuzzy systems creates a robust expert system. ANFIS exploits neural network learning capabilities to develop a fuzzy inference system from input-output data sets. Fuzzy system membership function parameters are learned to track the given input and output sets accurately [9].
It is difficult to detect the shape of the optimal membership function for the fuzzy system by examining the data. ANFIS builds a fuzzy inference system (FIS) whose membership functions’ parameters are tuned by learning from available data. Adaptive-neuro technique allows the FIS to learn information about the data it is modeling. ANFIS structure is similar to the structure of a neural network, that maps inputs through input membership functions and related parameters, outputs through output membership functions and related parameters to construct the input-output mapping. The membership function parameters are changed during the training process [11]. ANFIS system is implemented using Matlab fuzzy logic tool box, which uses a hybrid learning algorithm to tune the membership functions. Algorithm includes a combination of the least-squares and back-propagation gradient descent methods.
In this study, three adaptive neuro fuzzy systems (ANFIS) are implemented using historic weather data and real-time PV plant simulation. Three ANFISs are integrated together to predict the PV power generation of a 200 MW large PV plant. A 200 MW PV plant is
simulated on Real-Time Digital Simulator (RTDS) using archived weather data. PV power outputsPpv(t) are captured and stored with corresponding solar irradianceI(t) and temperature
T(t) measurements for the ANFIS development. Fig. 1 shows the schematic diagram of the three ANFIS modules. ANFIS 1 and 2 are developed to predict the solar irradianceI(t+ 35) and temperature T(t+ 35) values 35 seconds ahead, respectively. Predicted irradiance and temperature values of these two ANFISs are passed on to the 3rdANFIS as inputs to estimates the PV power generationPpv(t+ 35) accordingly. Optimal membership functions are obtained for each ANFIS module based on their self-learning procedure. Three ANFISs are chosen initially for this study to investigate their capabilities for prediction and estimation in regard to PV power prediction.
2.2.1 Solar Irradiance Prediction:
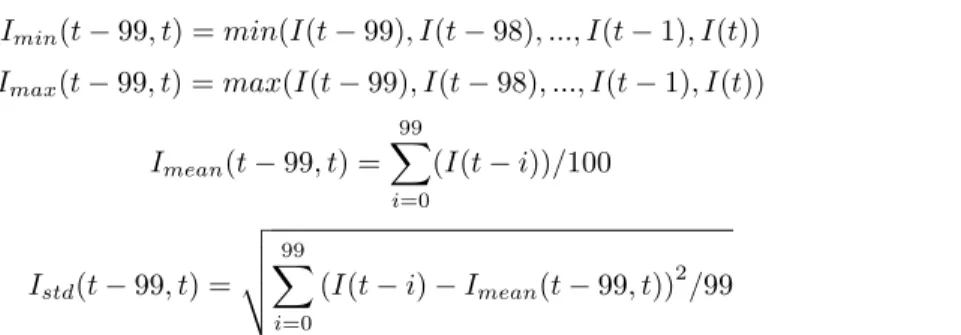
Solar irradiance prediction ANFIS (ANFIS 1) is developed to predict solar irradiance 35 seconds ahead using the following four inputs: minimum, maximum, mean and standard deviation of irradiance over a time interval. The time interval for the inputs is taken as 100 seconds for the 35s ahead prediction. The 100s interval was selected to provide sufficient dynamic information over past periods of 35s and remains to be investigated using a systematic approach as part of our ongoing study. The prediction is implemented for every second. In other words, the sliding window drops the first second as the 101th second is received maintaining a window of 100s of data. The four inputs are calculated as shown below.
Imin(t−99, t) =min(I(t−99), I(t−98), ..., I(t−1), I(t)) (1) Imax(t−99, t) =max(I(t−99), I(t−98), ..., I(t−1), I(t)) (2) Imean(t−99, t) = 99 i=0 (I(t−i))/100 (3) Istd(t−99, t) = 99 i=0 (I(t−i)−Imean(t−99, t))2/99 (4) whereImin(t−99, t) is the minimum irradiance value betweenI(t−99) andI(t) ,Imax(t− 99, t) is the maximum irradiance value betweenI(t−99) andI(t),Imean(t−99, t) is the mean of the irradiance values betweenI(t−99) andI(t) andIstd(t−99, t) is the standard deviation of the values between I(t−99) and I(t). Output parameter for ANFIS is the irradiance at
t+ 35,I(t+ 35)
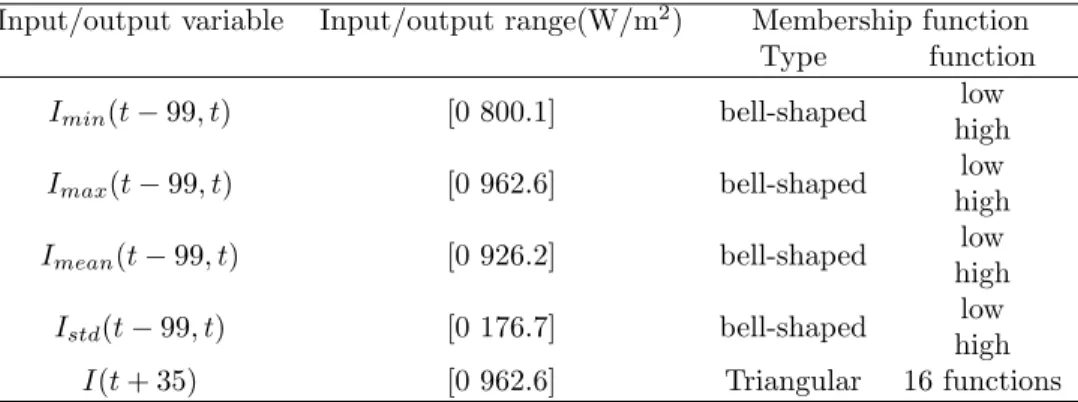
Table 1 presents the input/output variable range (minimum and maximum), membership function type and membership function obtained by training the ANFIS 1. Fuzzy inference system (Table 2) has 16 rules with two membership functions for the four input variables and 16 membership functions for an output variable. The output membership functions are named as I1-I16.
2.2.2 Temperature Prediction:
Temperature prediction ANFIS (ANFIS 2) is developed to predict the temperature 35 seconds ahead using four inputs just like in the case of the irradiance ANFIS predictor. Minimum, maximum, mean and standard deviation of temperature over a time interval are used as inputs. For the same reasons explained above, the time interval is taken as 100 seconds and prediction is implemented for every second. The four input parameters are computed as shown below.
Input/output variable Input/output range(W/m2) Membership function Type function
Imin(t−99, t) [0 800.1] bell-shaped highlow
Imax(t−99, t) [0 962.6] bell-shaped highlow
Imean(t−99, t) [0 926.2] bell-shaped low high Istd(t−99, t) [0 176.7] bell-shaped low high I(t+ 35) [0 962.6] Triangular 16 functions
Table 1: Membership functions for solar irradiance prediction fuzzy system
Imin(t−99, t) Imax(t−99, t) Imean(t−99, t) Istd(t−99, t) I(t+ 35)
Low Low Low Low I1
Low Low Low High I2
Low Low High Low I3
Low Low High High I4
Low High Low Low I5
Low High Low High I6
Low High High Low I7
Low High High High I8
High Low Low Low I9
High Low Low High I10
High Low High Low I11
High Low High High I12
High High Low Low I13
High High Low High I14
High High High Low I15
High High High High I16
Table 2: Rule Based Fuzzy System
Tmin(t−99, t) =min(T(t−99), T(t−98), ..., T(t−1), T(t)) (5) Tmax(t−99, t) =max(T(t−99), T(t−98), ..., T(t−1), T(t)) (6) Tmean(t−99, t) = 99 i=0 T(t−i)/100 (7) Tstd(t−99, t) = 99 i=0 (T(t−i)−Tmean(t−99, t))2/99 (8) where Tmin(t−99, t) is the minimum temperature value between T(t −99) and T(t) ,
Tmax(t−99, t) is the maximum temperature value betweenT(t−99) andT(t),Tmean(t−99, t) is the mean of the temperature values between T(t−99) and T(t) and Tstd(t−99, t) is the
standard deviation of the values betweenT(t−99) andT(t). Output parameter for ANFIS is the temperature att+ 35,T(t+ 35)
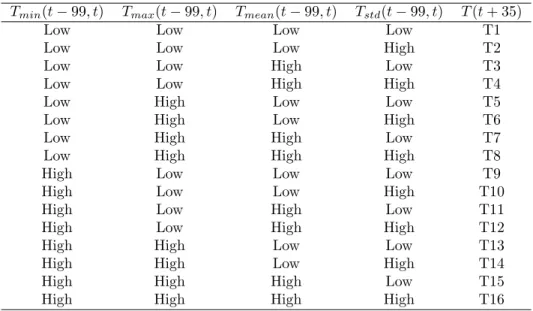
Table 3 presents the input/output variable range ( minimum and maximum), membership function obtained by the ANFIS 2. Fuzzy inference system (Table 4) has 16 rules with two membership functions for the four input variables and 16 membership functions for an output variable. The output membership functions are named as T1-T16.
Input/output variable Input/output range(W/m2) Membership function Type function
Tmin(t−99, t) [-0.6507 28.26] bell-shaped highlow
Tmax(t−99, t) [-0.6026 28.36] bell-shaped highlow
Tmean(t−99, t) [-0.6234 28.3] bell-shaped low high Tstd(t−99, t) [0 10.51] bell-shaped low high T(t+ 35) [-0.6507 28.36] Triangular 16 functions Table 3: Membership functions for temperature prediction fuzzy system
Tmin(t−99, t) Tmax(t−99, t) Tmean(t−99, t) Tstd(t−99, t) T(t+ 35)
Low Low Low Low T1
Low Low Low High T2
Low Low High Low T3
Low Low High High T4
Low High Low Low T5
Low High Low High T6
Low High High Low T7
Low High High High T8
High Low Low Low T9
High Low Low High T10
High Low High Low T11
High Low High High T12
High High Low Low T13
High High Low High T14
High High High Low T15
High High High High T16
Table 4: Rule Based Fuzzy System
2.2.3 PV Power Estimation:
PV power estimation ANFIS (ANFIS 3) system is developed to estimate PV power generation the 35 seconds ahead. Three fuzzy systems are integrated to obtain the PV power output
Figure2: ESN Architecture
T(t+ 35) respectively are passed on to ANFIS 3 (Fig. 1) to estimate the PV power output Ppv(t+ 35).
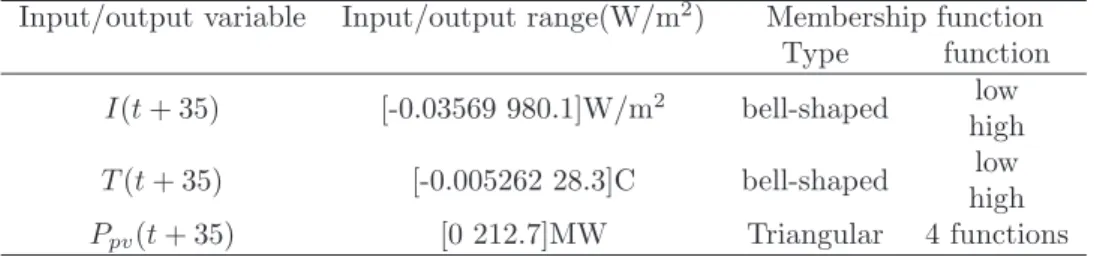
Table 5 shows the input/output range, membership function type and parameter values for the membership functions obtained for PV power estimation ANFIS. Rule based fuzzy inference system includes four rules, shown in Table 6.
Input/output variable Input/output range(W/m2) Membership function
Type function I(t+ 35) [-0.03569 980.1]W/m2 bell-shaped low high T(t+ 35) [-0.005262 28.3]C bell-shaped low high Ppv(t+ 35) [0 212.7]MW Triangular 4 functions
Table 5: Membership functions for PV power prediction fuzzy system
I(t+ 35) T(t+ 35) Ppv(t+ 35)
Low Low PV1
Low High PV2
High Low PV3
High High PV4
Table 6: Rule Based Fuzzy System
2.3
ESN Based PV Power Prediction
In order to compare the performance of the ANFIS system in Fig. 1, an echo state network (ESN) architecture shown in Fig. 2 is used. ESN is a reservoir based neural network, which includes a fixed large reservoir with randomly and sparsely connected neurons. The reservoir is complex in dynamics and a changing behavior with respect to the input and output units connected to it. Due to the dynamic changing nature of the reservoir, ESNs are more suitable for complex time series predictions [8].
An ESN is implemented to predict the PV power generation att+ 35thsecond (P
pv(t+ 35)) using solar irradiance at tth second (I(t)), temperature at tth second (T(t)) and PV power generation attthsecond (P
pv(t)) as inputs. ESN is designed with a hyperbolic tangent activation function for both reservoir update and output neuron calculation. The ESN implemented has 100 reservoir neurons. Reservoir weights are calculated by maintaining the echo state property. It is created by setting 1% of the matrix in to a randomly generated value between [-1, 1] and spectral radius is 0.8 [8]. Input weights and feedback weights are initialized using randomly selected values from a uniform distribution ranging [-1, 1] and the settling time of the reservoir is set to be within the first 40 samples.[7]
3
Results and Discussion
ANFIS and ESN prediction networks are trained and tested with different weather patterns. Training data set includes eight days (691,200 number of records) of data and testing data set includes four days of data (345,600 number of records). Accuracies of the implemented systems are compared using measures mean absolute percentage error (MAPE) given in (9) and APE is calculated as in (10). All the experiments were conducted three times and average of the measures are shown.
M AP E= 1/n
n i=1
AP Ei (9)
AP Ei=|(T arget(i)−Output(i))/T arget(i)|x100 (10) wherenis the number of data points, andT arget(i) andOutput(i) areithtarget value and
ithpredicted value respectively. AP E
i is the APE forithdata point.
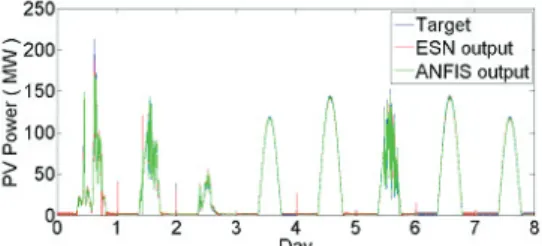
Figs. 3 and 4 shows the training and testing results obtained for PV power prediction using ANFIS and ESN approaches. Table 7 shows the MAPEs obtained for irradiance and temperature ANFIS predictors separately, and combined ANFIS for PV power estimation. A small PV power generation was observed during night time, which varies rapidly around a small range of MWs (0 - 1)MW. Table 8 shows the MAPEs obtained for training and testing stages for the ANFIS and ESN.
ANFIS MAPE
Training Testing Solar Irradiance predictor 6.9603 7.4378 Temperature predictor 2.9525 1.0681 PV power predictor (combined) 26.0899 25.8076
Table 7: MAPEs obtained for ANFIS aproache
According to the Table 7, solar irradiance and temperature predictors have higher accuracy in training and testing stages compared to the final PV power estimation. Combination of two predictors reduce the accuracy of the integrated PV power predictor system.
According to the Table 8 (showing PV power prediction measures), ESN performs well in both training and testing stages compared to ANFIS during night and day times. It is clear from these results that ESNs are able to perform well on complex time series predictions. Day time measures are reveal better accuracies compared to night time measures.
Figure3: Target, ESN predictor output and ANFIS predictor output for training phase
Figure4: Target and ESN predictor output and ANFIS predictor output for testing phase
Method MAPE
Training Testing
Day Night All Day Night All
ANFIS 22.9600 28.3889 26.0899 15.5690 53.8001 25.8076 ESN 5.7752 13.4408 10.1946 4.1044 14.2487 10.2686 Table 8: MAPEs obtained for ANFIS and ESN approaches on PV Power
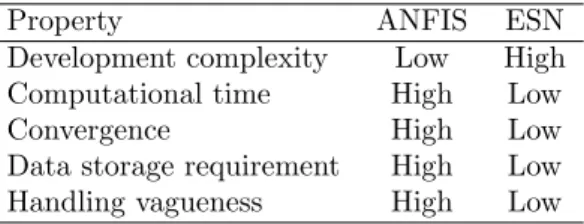
Table 9 compare and contrasts the two approaches used in this study. ANFIS is developed in this study using the Matlab fuzzy toolbox whereas ESN is developed using code written in Matlab. Therefore, knowledge of ESN is required. Thus, higher development complexity with ESNs compared to ANFIS. ANFIS predictor system (three ANFISs) is computationally more complex compared to the ESN. It is also to be noted that ANFIS system is developed in iterative manner compared to the one-shot training approach with ESNs. Thus, convergence with ANFIS requires more epochs and time. Data requirements for the systems developed in this study for decision-making by ANFIS is higher than with the ESN. On other hand, ANFIS is a fuzzy system and has the capability to handle vagueness and uncertainty compared to a neural network. It is expected that the performance of the ANFIS predictor can be improved with more development time.
4
Conclusion
In this study, an integrated adaptive neuro-fuzzy inference system for predicting PV power generation using historic weather data is presented. The time period for the prediction studied herein is a short-term mainly for real-time power system operation with variable generation. The prediction results of the ANFIS are compared with that of the echo state network’s. According to the results obtained, ANFIS system does not perform as good as ESN for different weather conditions, day or night. On other hand, fuzzy systems are known to handle vagueness and
Property ANFIS ESN Development complexity Low High Computational time High Low
Convergence High Low
Data storage requirement High Low Handling vagueness High Low
Table 9: ESN vs ANFIS
uncertainty better than neural networks. Future study to improve ANFIS prediction accuracy includes expanding the number of membership functions and types to enable higher resolution in decision-making, and investigating irradiance and temperature as both inputs to the respective ANFISs. It is the intend of the authors to extend the studies beyond Clemson weather profiles and avail some data to promote similar studies by other research communities.
References
[1] Jenn Cano. The v’s of big data:velocity, volume, value,
va-riety and veracity. http://www.xsnet.com/blog/bid/205405/
The-V-s-of-Big-Data-Velocity-Volume-Value-Variety-and-Veracity, 2014. [Online; accesse 04-June-2015].
[2] W. Dai and P. Wang. Application of pattern recognition and artificial neural network to load forecasting in electric power system. InThird International Conference on Natural Computation, ICNC, pages 381–385, 2007.
[3] L. A. Fernandez-Jimenez, A. Muoz-Jimenez, A. Falces, M. Mendoza-Villena, E. Garcia-Garrido, P. M. Lsrs-Santillan, E. Zorzano-Alba, and P. J. Zorzano-Santamaria. Short-term power forecasting system for photovoltaic plants. Renewable Energy, 44:311–317, 2012.
[4] Inan Gulera and Elif Derya Ubeylib. Adaptive neuro-fuzzy inference system for classification of eeg signals using wavelet coefficients. Journal of Neuroscience Methods, 148(2):113–121, 2005. [5] M. M. Gupta. Fuzzy logic, neural networks and virtual cognitive systems. InSecond International
Symposium on Uncertainty Modeling and Analysis Proceedings, pages 90 – 97, 1993.
[6] M. Hashim, J. Jaafar, and S. Taib. New forecasting model using type-2 fuzzy multivariate time series. InNational Postgraduate Conference (NPC), pages 1–4, 2011.
[7] I. Jayawardene and G. K. Venayagamoorthy. Reservior based learning networks for control of two-area power system with variable renewable generation. Neurocomputing , in press.
[8] I. Jayawardene and G. K. Venayagamoorthy. Comparison of echo state network and extreme learning machine for pv power prediction. In IEEE Symposium on Computational Intelligence Applications in Smart Grid (CIASG), pages 1–8, 2014.
[9] Jyh-Shing and Roger Jang. Anfis: Adaptive-network-based fuzzy inference system. IEEE Trans-actions on systems, Man and Cybernetics, 23:665–685, 1993.
[10] R. Mamlook, O. Badran, and E. Abdulhadib. A fuzzy inference model for short-term load fore-casting. Energy Policy, 37(4):1239–1248, 2009.
[11] Matlab. Neuro-adaptive learning and anfis. http://www.mathworks.com/help/fuzzy/ neuro-adaptive-learning-and-anfis.html, 2014-2015. [Online; accesse 22-May-2015].
[12] Xin Miao and Dongxia Zhang. The opportunity and challenge of big data’s application in dis-tribution grids. China International Conference on Electricity Distribution (CICED 2014), pages 962–964, 2014.
[13] S. Mohagheghi, G. K. Venayagamoorthy, and R. Harley. Fully evolvable optimal neurofuzzy controller using adaptive critic designs. IEEE Transactions on fuzzy systems, 33:1450 – 1461, 2008.
[14] D. Niu, H. Shi, J. Li, and Y. Wei. Research on short-term power load time series forecasting model based on bp neural network. InSecond International Conference on Advanced Computer Control, ICACC, pages 509 – 512, 2010.
[15] Z. Osman, M. Awad, and T. Mahmoud. Neural network based approach for short-term load forecasting. InPower Systems Conference and Exposition, pages 1–8, 2009.
[16] G. K. Singh. Solar power generation by pv (photovoltaic) technology: A review.Energy, 53:1–13, 2013.
[17] G. K. Venayagamoorthy and P. Chakravarty. Optimal fuzzy logic based coordination controller for improved transient stability of a smart grid. InIEEE International Conference on Fuzzy Systems (FUZZ-IEEE), pages 346 – 353, 2014.
[18] Yu Wang, Boxun Li, Rong Luo, Yiran Chen, Ningyi Xu, and Huazhong Yang. Energy efficient neural networks for big data analytics. InDesign, Automation and Test in Europe Conference and Exhibition (DATE), pages 1–2, 2014.
[19] Yuan-Kang Wu, Chao-Rong Chen, and Hasimah Abdul Rahman. A novel hybrid model for short-term forecasting in pv power generation. International Journal of Photoenergy, 2014:9, 2014. [20] P.L. Zervas, H. Sarimveis, J.A. Palyvos, and N.C.G. Markatos. Prediction of daily global solar
irradiance on horizontal surfaces based on neural-network techniques.Renewable Energy, 33:1796– 1803, 2008.
[21] Jie Zhan, Jinxin Huang, Lin Niu, Xiaosheng Peng, Diyuan Deng, and Shijie Cheng. Study of the key technologies of electric power big data and its application prospects in smart grid.Power and Energy Engineering Conference (APPEEC), 2014 IEEE PES Asia-Pacific, pages 1–4, 2014.