SAFETY RISK ASSESSMENT FOR VERTICAL CONCRETE FORMWORK
1
ACTIVITIES IN CIVIL ENGINEERING CONSTRUCTION.
2
Lopez-Arquillos, A; Rubio-Romero, JC; Gibb, AGF; Gambatese, JA (2014) 3
Work: A Journal of Prevention, Assessment & Rehabilitation, 49:2, 183-192, 4
ISSN 1051-9815, DOI 10.3233/WOR-131724 5
Abstract:
6 7
BACKGROUND: The construction sector has one of the worst occupational health and safety
8
records in Europe. Of all construction tasks, formwork activities are associated with a high
9
frequency of accidents and injuries.
10
OBJECTIVE: This paper presents an investigation of the activities and related safety risks
11
present in vertical formwork for in-situ concrete construction in the civil engineering sector.
12
METHODS: Using the methodology of staticized groups, twelve activities and ten safety risks
13
were identified and validated by experts. Every safety risk identified in this manner was
14
quantified for each activity using binary methodology according to the frequency and severity
15
scales developed in prior research. A panel of experts was selected according to the relevant
16
literature on staticized groups.
17
RESULTS: The results obtained show that the activities with the highest risk in vertical
18
formwork tasks are: Plumbing and leveling of forms, cutting of material, handling materials
19
with cranes, and climbing or descending ladders. The most dangerous health and safety risks
20
detected were falls from height, cutting and overexertion.
21
CONCLUSIONS The research findings provide construction practitioners with further
22
evidence of the hazardous activities associated with concrete formwork construction and a
23
starting point for targeting worker health and safety programmes.
24 25
Keywords: Occupational, expert panel, fall from height,
26 27 28
1. Introduction
29
According to the European Agency for Safety and Health at Work, the construction sector has
30
one of the worst occupational health and safety records in Europe [1]. In the original 15
31
European Union (EU) Member States alone, about 1,300 construction workers die every year,
32
another 800,000 are injured, and countless more suffer work-related ill health [2].
33
In the United States, 751 deaths occurred on construction sites in 2010 [3]. This figure accounts
34
for about 17% of all fatal occupational injuries and is the fourth highest fatality rate for all U.S.
35
industries. A similar problem exists in Spain where the fatality rate on construction sites in 2011
36
was 11.2 fatalities per 100,000 workers [4], with a total of 120 worker deaths.
37
Formwork is defined as a temporary structure whose purpose is to provide support and
38
containment for fresh concrete until it can support itself. It molds the concrete to the desired
39
shape and size, and controls its position and alignment [5].Of all construction tasks, formwork
40
activities are associated with a high frequency of accidents and injuries. Huang and Hinze [6]
41 42
construction of temporary structures and approximately 21% of all accidents involved wood
43
framing or formwork construction. Many studies on construction safety are focused on topics
44
such as contributing factors in construction accidents [7] or the impact of the different variables
45
on the severity of the accidents [8,9,10,11,12,13,14,15]. Research studies have tried to quantify
46
the safety risks of large-scale processes, such as underground construction projects [16] or
47
buildings [17]. However, only one study was found in which the authors actually quantified the
48
relative health and safety risks of specific construction tasks [18]. The objective of the latter
49
study was to quantify the comprehensive health and safety risk at the activity level for a
50
common construction process, such as formwork activities, using the Delphi method.
51
The aim of the present study is to quantify the health and safety risks in different vertical
52
formwork activities in civil engineering construction using the binary method and the
53
methodology of staticized groups.
54 55
2. Methodology
56
To achieve the study aim, the researchers used two different methodologies. A general research
57
methodology was used to define the study´s structure and a specific methodology inside this
58
structure was used as a tool to elaborate the safety risk assessment.
59
With regard to the specific methodology, some authors have developed methods of risk
60
quantification with different levels of complexity and application. An example of this is a study
61
where ergonomic risks were analysed using ratings for each risk factor on a three-point scale
62
[insignificant, moderate and high] in 65 construction activities to identify the presence of risk
63
factors concerning overexertion injuries [19]. Other studies quantifying safety risk defined it as
64
the product of frequency and severity [20]. A similar methodology with the addition of the
65
exposure factor was used by Jannadi and Almishari [21].The method we have chosen for this
66
study is the approach known as the binary method [22], where the unit risk is defined as the
67
product of frequency and severity (see Equation 1).Frequency is defined in terms of worker
68
hours per incident, while severity is defined in terms of impact on the worker per incident.
69
severity
incident
severity
UNIT RISK
=Frequency
×Severity
1
work-hour
work-hour
incident
70
Once the method for risk quantification was defined, the next step was to define a suitable
71
research strategy to accomplish our specific goal.
72
According to a previous civil construction research [23] based on the Delphi method, cited
73
method can be defined as systematic and interactive research technique for obtaining the
74
judgment of a panel of independent experts on a specific topic. Panel members are selected
75
according to predefined guidelines and are asked to participate in two or more rounds of
76
structured surveys. After each round, an anonymous summary of the experts’ input from the
77
previous survey is provided as a part of the subsequent survey. In each subsequent round,
78
participants are encouraged to review the anonymous opinion of the other panelists and consider
79
revising their previous response. The goal during this process is to decrease the variability of the
80
responses and achieve group consensus about a correct value. Finally, the process is concluded
81
after a predefined criterion (as number of rounds or the achievement of consensus) is met and a
82
statistical aggregation of the responses in the final round determines the results.
83 84
The staticized group technique is very similar to the Delphi method. The only methodological
85
difference is the exclusion of feedback or iterations in the staticized group technique. Several
86
studies have reported different opinions about the accuracy of both methods. Some of these
87
studies have reported a significant increase of the staticized group technique over Delphi rounds
88
as far as accuracy is concerned [24, 25]. By contrast, other studies found no substantial
89
difference in the accuracy records when the Delphi and staticized group approaches were
compared [26, 27]. Meanwhile, two other surveys suggested that the accuracy of the Delphi
91
method is worse when there is a high level of iterations [28, 29].
92
Authors such as Erffmeyer and Lane [30] are in favour of using the staticized group approach
93
because panel members are not led to achieve a consensus on a value that could be wrong. This
94
is the main reason why the present study was carried out using the method of staticized groups.
95 96
2.1 Panel Members
97
As in the Delphi procedure, in the staticized group approach the selection of experts is a very
98
important factor in determining the quality of the study. Hallowell and Gambatese [23] maintain
99
that the level of expertise is the most important facet in a panel member and propose guidelines
100
for a flexible point system for the selection of an expert panel member. A suitable adaptation of
101
the suggested point system to the specific goals of our research project resulted in the
102
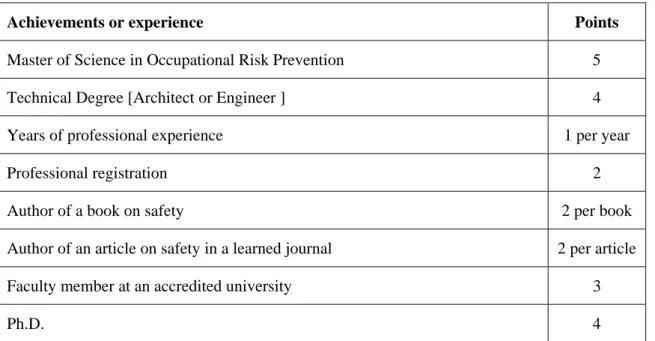
requirements listed in Table 1.
103
TABLE 1
104
The authors contacted 15 construction companies and 10 universities. After a review of the
105
background and availability of the possible candidates, 12 experts were selected from 7 large
106
high profile companies from the engineering construction sector, and from 5 Schools of
107
Engineering. In addition to the flexible point system requirements, only one expert per company
108
or per University was selected in order to ensure diversity in the origin of the experts.
109
According to the guidelines proposed by Hallowell and Gambatese [23], all members of the
110
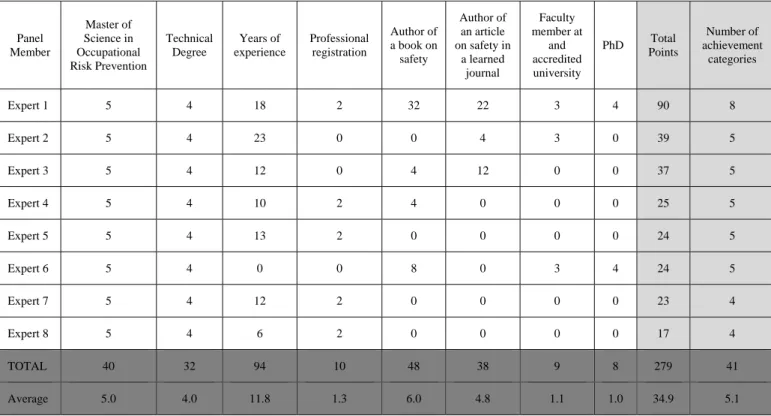
panel met the minimum level of requirements. As can be seen in Table 2, all of the panellists
111
scored a total of at least 17 points and in at least four different achievement or experience
112
categories. Four other professionals were selected as panel members, but they did not complete
113
the survey and so were excluded from the final list of panel members and also from the results
114
shown in Table 2.
115
TABLE 2
116
The qualifications of the selected members of the staticized groups are as follows.
117
- As a guarantee of expertise in Safety at Work and Occupational Risk, all members of
118
the panel have obtained a Master in Occupational Risk Prevention degree. In our
119
opinion, this is the most valuable requirement for our research, because it shows that the
120
person has completed specific courses on occupational health and safety and, therefore,
121
that he or she has the expertise to evaluate risks in the activities under study.
122
- Every member has a technical Bachelor’s or Master’s degree. Formwork activities in
123
construction have a very important technical profile. Consequently, this requirement is
124
considered highly relevant because previous training in technical issues is necessary to
125
be able to form an accurate evaluation.
126
- Between them, the panellists have 94 years of experience in the construction sector.
127
Experience is another extremely relevant requirement.
128
- Four of the panellists have contributed to 24 books related to construction safety and
129
health or risk management.
130 131
2.2 Study Design
132
A web-survey used for collecting the expert responses was developed on a specialized site and
133
was made available to the experts. Experts had access to the survey only by using a password
134
supplied by the researchers. The web-survey expired after the collection of data in the above
135
mentioned period of time.
136 137
In order to improve the quality of the study, certain strategies for study design and the
138
elimination of bias were adopted. For example:
139
- The order of the questions and the order of the potential safety risk in the survey were
140
randomized for each panel member to reduce the contrast effect and the primacy effect.
141
- Independent frequency and severity rates were implemented.
142
- The anonymity of each expert was ensured.
143 144
2.3 Survey Content
145
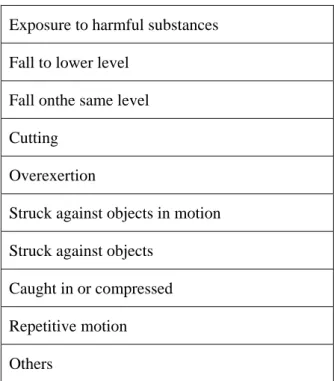
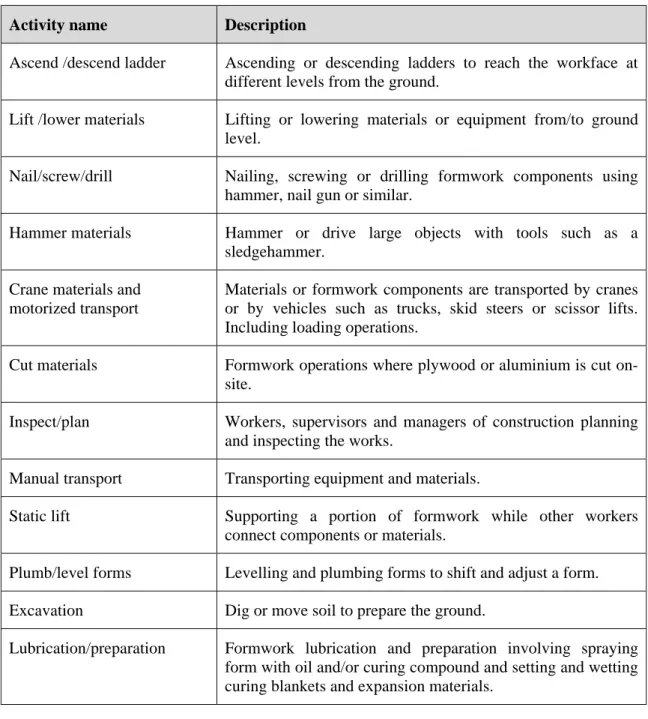
Following the guidelines of Hallowell and Gambatese [18], experts were provided with the
146
incident classification descriptions (Table 3) and the formwork construction activity
147
descriptions (Table 4). In line with the above, the selected incidents or health and safety risk
148
classification were based on the Occupational Safety & Health Administration, Bureau of
149
Labour Statistics, and Hinze accident classification systems [31].
150
The panellists were asked to provide their opinion on frequency rates and severity levels using
151
the frequency and severity scales provided previously (Table 5&Table 6). These scales were
152
created by Hallowell and Gambatese [18], and cover a complete spectrum of frequency and
153 severity levels. 154 TABLES 3-6 155 156
3. Results and Discussion
157
Although consensus is not a requirement for the methodology of staticized groups, it was also
158
calculated in order to compare the results with the Delphi approach (Table 7).
159
TABLE 7
160
To measure the variation in the responses, the absolute deviation was calculated using the
161
following equation:
162
Average Deviation from Median = Average (Median j – Value ij)(2)
163
After calculating the absolute deviation from the median, and accepting that consensus is
164
achieved with a value less than1/10 of the possible value for the quantitative study developed,
165
the target consensus was found to be achieved in this case.
166
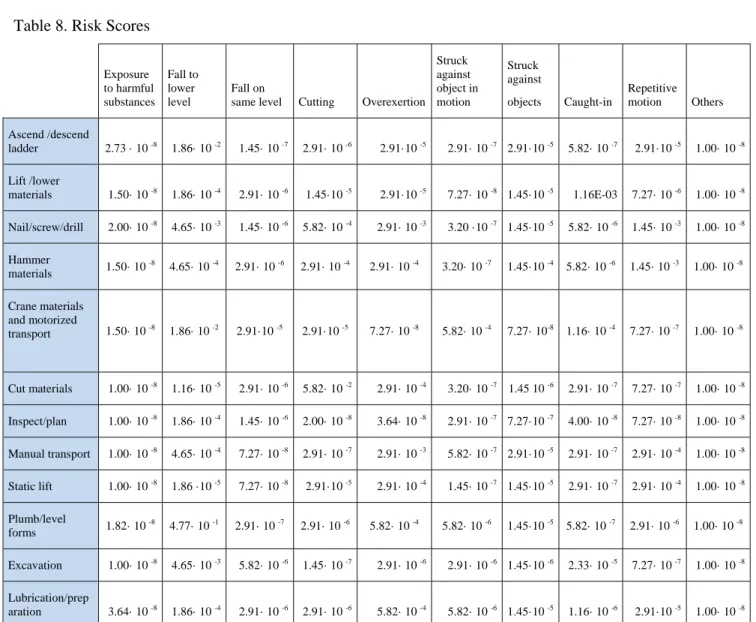
Table 8 shows the quantified risk when all formwork activities are included by the following
167
methods. First, the frequency ratings chosen by the expert from a range of values from table 5
168
with units of worker-hours per incident were converted into a single point value with units of
169
incidents per worker-hour. Then single point values were multiplied by the severity values
170
chosen by the experts according to the severity scale from Table 6.
171
TABLE 8
172
For example, if the expert rated the average frequency as 10-100 w-h /incident, the mean value
173
of 55 w-h/incident was identified in order to convert to a single value, and the inverted value
174
0.018 [1/55] represented the frequency value for the particular risk and activity. The product of
175
this frequency and the severity rating from table 6 represents the unit risk for the activities.
176
In a further analysis of the data matrix shown in Table 8, two different comparative tables were
177
produced according to the sum values from a row [Activities] and from a column [Safety risks].
178
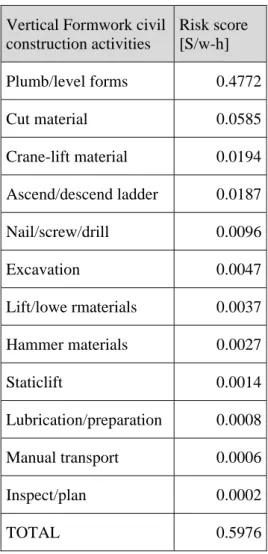
Table 9 summarizes the total safety risk score for each activity, and Table 10 shows the
179
quantified risks when all formwork activities are included.
180
TABLE 9
181
Table 9 shows that the highest risk scores for the construction activities under study were
182
obtained by the activities plumb/level forms (0.4772 S/w-h) cut material (0.0585 S/w-h), crane
material (0.0194 S/w-h) and ascend/descend ladder (0.0187S/w-h). On the other hand, the
184
lowest risk scores were obtained by lubrication/preparation (0.0008S/w-h), manual transport
185
(0.0006S/w-h) and inspect/plan (0.0002S/w-h). Some of the activities with the highest risk
186
scores such as crane material or ascend and descend ladders, have been dealt with in other
187
papers with a more general approach [32,33,34,35,36].Our specific results for vertical formwork
188
activities in construction are in line with other general results that are discussed below.
189
Surprisingly, the first and second highest risk score activities, that is, plumb/level forms and cut
190
material, had not been studied before. This fact could be due to the highly specific activities
191
involved. Consequently, further research concerning these issues is needed. It is especially
192
significant that plumb/level forms accumulated approximately 80% of all of the risk. Therefore,
193
it should be an activity which is the primary focus of safety management on the worksite.
194
Crane-lifting of material is one of the major causes of fatalities in construction [32]. To reduce
195
the rate of crane fatalities, these authors believe that crane operators and riggers should be
196
qualified and requalification courses should take place every 3 years. Likewise, other
197
researchers [33] highlighted the fact that big contractors and other agents provide insufficient
198
training for crew members. In addition, these authors found difficulties in communication
199
among crew members, including language and a proper understanding of signals. Consequently,
200
to improve the health and safety levels in these tasks, education programmes should be
201
redesigned for all workers engaged in crane operations. Sometimes the risk is caused by
202
deficiencies in the electrical system of the crane [34].
203 204
Ascending and descending ladders has been associated with a high percentage (33.5%) of the
205
non-fatal accidents in construction workers in the United States [35]. Ladders were also
206
associated with 11% of all fatal falls over the period 1980-1989 in the US. More recently,
207
ladder-related accidents have been shown to be associated with risk factors that increased the
208
probability of a serious or fatal accident [36]. Hallowell and Gambatese [18] found that this
209
activity is one of the most dangerous. They studied formwork activities following a more
210
general approach, that is, without concentrating on vertical civil works. To improve the safety
211
records at work in this activity, we must make a more accurate risk assessment.
212
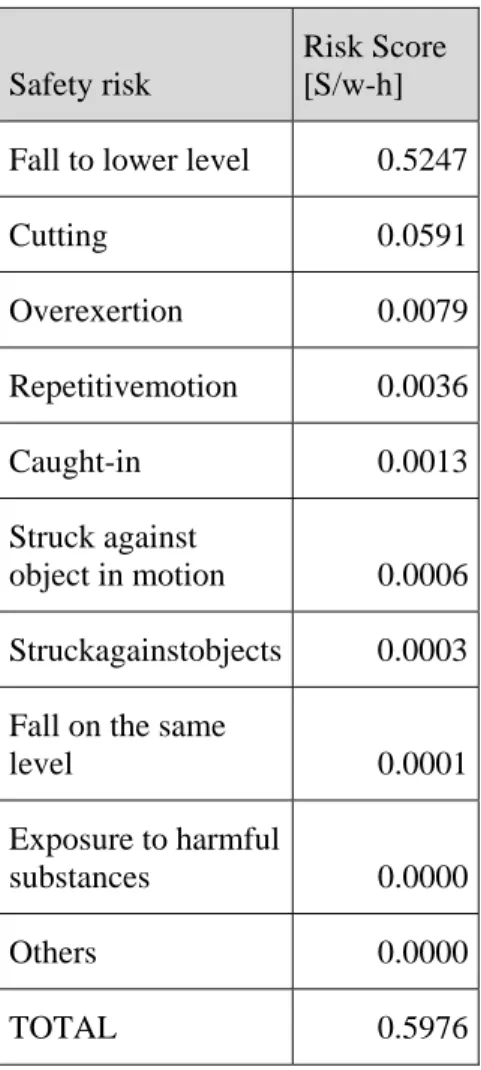
Regarding the health and safety risk values included in Table 10, the highest risk scores were
213
obtained by fall to a lower level (0.5247 S/w-h), cutting (0.0591 S/w-h) and overexertion
214
(0.0079 S/w-h). The lowest risk scores correspond to fall on the same level (0.0001 S/w-h),
215
exposure to harmful substances (0.0000 S/w-h) and others (0.0000 S/w-h). The health and
216
safety risks studied had previously been addressed by many papers on construction activities
217
[18,19,37,38,39,40,41]. The results provided here on specific vertical formwork safety risks are
218
in line with the results of other general studies on the same issue.
219
Given their fatal consequences, falls to a lower level in the construction industry have been
220
extensively studied by many authors [35, 36, 37, 38, 39]. Although these authors studied falls in
221
the construction industry, their research was not focused on falls related to a formwork task. The
222
most relevant work on falls and formwork is the study carried out by Adam, Pallarés, and
223
Calderon [41]. In this study, falls from a height during floor slab formwork of buildings are
224
dealt with specifically. They compared the fall protection systems commonly used during floor
225
slab formwork construction in buildings and concluded that the suitability of the different
226
systems depends greatly on the willingness of the workers to use the systems. This fact should
227
be taken into account when making the choice. Hallowell and Gambatese [18] found that falls to
228
a lower level is a very important risk, but this result was obtained without distinguishing
229
between the two types of formwork (vertical or horizontal).Unfortunately, no literature about
230
the risk of falls in vertical formwork in civil engineering is available. In a similar way to the
231
studied activities, fall to lower levels accumulated almost 88% of the total risk score. Therefore
232
concentration on this aspect of the work will produce the greatest improvement in health and
233
safety performance.
234 235
Overexertion injury is the single largest category of injuries in construction work. They account
236
for about 24% of all injuries [19]. Everett's analysis shows that virtually all construction
237
activities have moderate-to-high ratings for at least one risk factor, and thereby place craft
238
workers at increased risk for overexertion injuries and disorders.
239 240
The authors of this paper have found no articles on the safety risk involved in formwork cutting
241
activities.
242
To sum up, although there are several research papers on common health and safety issues in
243
construction work, there is still a significant shortage of specific investigations on some of the
244
activities and risks relating to tasks such as formwork erection dealt with in this paper.
245 246
4.Conclusions
247
The results of this study can be used as an important tool for making a risk assessment when a
248
vertical formwork task is scheduled. Each construction project involves specific health and
249
safety issues because each has different circumstances and environment. However, the general
250
health and safety topics described in this research can be addressed effectively on each project.
251
As for preventive measures, resources are always limited and must be managed efficiently.
252
Construction practitioners must first identify the most dangerous activities and their safety risks.
253
This is the first step for prioritizing preventive measures according to a suitable scale of needs.
254
The classification obtained according to the scores provided by expert panel members in this
255
study placed plumb/level forms, cut material, crane-lift material, and ascend/descend ladder at
256
the top of the list of activities with high risk factors. Likewise, fall to a lower level, cutting, and
257
overexertion were the most dangerous safety risks according to the experts. Accordingly, special
258
attention is needed to reduce these safety risks.
259 260
4.1 Limitations of the study
261
This research does not consider the exposure [worker-hours] to the hazards. The total risk will
262
depend on the magnitude of the exposure [see Equation 3]. The exposure can vary significantly
263
depending on the specific construction project.
264
accident severity
TOTAL RISK severity =Frequency ×Severity ×Exposure work-hour 3
work-hour accident
265
If the exposure is high but the unit risk is low, then the total risk may be high relative to the
266
other activities. Similarly, if the exposure is low, but the unit risk is high, then the total risk may
267
be low compared to the other activities. In spite of this fact, unit risk is a very important tool to
268
quantify health and safety needs.
269
The results allow us to compare risk values between different activities, and valuate them in
270
order to prioritize preventive resources. However, as a relative subjective scale, it cannot be said
271
that greater than a specific value the risk is major and under this value the risk is minor.
272 273
4.2 Impact on the Industry
274
The conclusions from this research can be used by construction companies in several ways.
275
Health and Safety managers and supervisors can improve associated risks with specific
276
activities, especially with plumb/level forms activities and risks of falls to lower levels. Project
277
engineers and designers can estimate the exposure time for their specific project and calculate
278
the total risk. This calculation can be made considering the different formwork types and design
279
solutions. Companies can use the results obtained in their occupational safety strategies and in
280
their safety training programmes. The authors encourage further research on the issue and
281
promote future solutions to prevent the risks involved.
283
ACKNOWLEDGMENTS
284
[edited for the review process]
285 286
REFERENCES
287
[1] OHSA Europe. European Agency for Safety and Health at Work. Building in Safety -
288
Prevention of risks in construction - in practice. : Office for Official Publications of the
289
European Communities 2004; 2004.
290
[2] OHSA Europe. European Agency for Safety and Health at Work.
291
http://osha.europa.eu/en/sector/construction. 2012.
292
[3] BLS. Bureau of Labor Statistics.National census of fatal occupational injuries in 2010
293
[preliminary results].http://www.bls.gov/news.release/archives/cfoi_08252011.pdf. 2010.
294
[4] INSHT. Instituto Nacional de Seguridad e Higiene en el Trabajo. Avance de siniestralidad
295
laboral. Periodo octubre 2010-septiembre 2011. ; 2011.
296
[5] Hanna AS. Concrete formwork systems. : CRC; 1998.
297
[6] Huang X, Hinze J. Analysis of construction worker fall accidents. J Constr Eng Manage
298
2003;129[3]:262-271.
299
[7] Haslam R, Hide S, Gibb AGF, Gyi DE, Pavitt T, Atkinson S, et al. Contributing factors in
300
construction accidents. Appl Ergon 2005;36[4]:401-415.
301
[8] Sawacha E, Naoum S, Fong D. Factors affecting safety performance on construction sites.
302
Int J Project Manage 1999;17[5]:309-315.
303
[9] Salminen S. Have young workers more injuries than older ones? An international literature
304
review. J Saf Res 2004;35[5]:513-521.
305
[10] Chau N, Gauchard GC, Siegfried C, Benamghar L, Dangelzer JL, Francais M, et al.
306
Relationships of job, age, and life conditions with the causes and severity of occupational
307
injuries in construction workers. Int Arch Occup Environ Health 2004;77[1]:60-66.
308
[11] LópezArquillos A, Rubio Romero JC, Gibb A. Analysis of construction accidents in Spain,
309
2003-2008. J Saf Res 2012.
310
[12] Choi SD. Safety and ergonomic considerations for an aging workforce in the US
311
construction industry. Work: A Journal of Prevention, Assessment and Rehabilitation
312
2009;33(3):307-315.
313
[13] Goldsheyder D, Weiner SS, Nordin M, Hiebert R. Musculoskeletal symptom survey among
314
cement and concrete workers. Work: A Journal of Prevention, Assessment and Rehabilitation
315
2004;23(2):111-121.
316
[14] Gillen M, Kools S, Sum J, McCall C, Moulden K. Construction workers' perceptions of
317
management safety practices: A qualitative investigation. Work: A Journal of Prevention,
318
Assessment and Rehabilitation 2004;23(3):245-256.
319
[15] Liu M, Wei W, Fergenbaum J, Comper P, Colantonio A. Work-related mild-moderate
320
traumatic brain injury and the construction industry. Work: A Journal of Prevention,
321
Assessment and Rehabilitation 2011;39(3):283-290.
322
[16] Choi HH, Cho HN, Seo J. Risk assessment methodology for underground construction
323
projects. J Constr Eng Manage 2004;130[2]:258-272.
324
[17] Aneziris O, Topali E, Papazoglou I. Occupational Risk of building construction. Reliab
325
Eng Syst Saf 2011.
[18] Hallowell MR, Gambatese JA. Activity-based safety risk quantification for concrete
327
formwork construction. J Constr Eng Manage 2009;135[10]:990-998.
328
[19] Everett JG. Overexertion injuries in construction. J Constr Eng Manage
1999;125[2]:109-329
114.
330
[20] Sun Y, Fang D, Wang S, Dai M, Lv X. Safety risk identification and assessment for
331
Beijing Olympic venues construction. J Manage Eng 2008;24[1]:40-47.
332
[21] Jannadi OA, Almishari S. Risk assessment in construction. J Constr Eng Manage
333
2003;129[5]:492-500.
334
[22] Romero JCR. Métodos de evaluación de riesgos laborales. : Ediciones Díaz de Santos;
335
2004.
336
[23] Hallowell MR, Gambatese JA. Qualitative research: application of the Delphi method to
337
CEM research. J Constr Eng Manage 2009;136[1]:99-107.
338
[24] Best RJ. An experiment in Delphi estimation in marketing decision making. J Market Res
339
1974:448-452.
340
[25] Rowe G, Wright G. The impact of task characteristics on the performance of structured
341
group forecasting techniques. Int J Forecast 1996;12[1]:73-89.
342
[26] Fischer GW. When oracles fail -A comparison of four procedures for aggregating
343
subjective probability forecasts. Organ Behav Hum Perform 1981;28[1]:96-110.
344
[27] Sniezek JA. A comparison of techniques for judgmental forecasting by groups with
345
common information. Group & Organization Management 1990;15[1]:5-19.
346
[28] Gustafson DH, Shukla RK, Delbecq A, Walster GW. A comparative study of differences in
347
subjective likelihood estimates made by individuals, interacting groups, Delphi groups, and
348
nominal groups. Organ Behav Hum Perform 1973;9[2]:280-291.
349
[29] Boje DM, Murnighan JK. Group confidence pressures in iterative decisions. Management
350
Science 1982;28[10]:1187-1196.
351
[30] Erffmeyer RC, Lane IM. Quality and acceptance of an evaluative task: The effects of four
352
group decision-making formats. Group & Organization Management 1984;9[4]:509-529.
353
[31] Hinze J. Construction safety. : Prentice-Hall Upper Saddle River, NJ; 1997.
354
[32] Beavers J, Moore J, Rinehart R, Schriver W. Crane-related fatalities in the construction
355
industry. J Constr Eng Manage 2006;132[9]:901-910.
356
[33] Tam VWY, Fung IWH. Tower crane safety in the construction industry: A Hong Kong
357
study. Saf Sci 2011;49[2]:208-215.
358
[34] Rubio-Romero JC, Simón-Donaire JM. Principales defectos en las instalaciones eléctricas
359
de las grúas torre desmontables para obra. Dyna, 2009: 84[4]:321-326.
360
[35]Cattledge GH, Hendricks S, Stanevich R. Fatal occupational falls in the US construction
361
industry, 1980–1989. AccidentAnalysis&Prevention 1996;28[5]:647-654.
362
[36] Camino López MA, Ritzel DO, Fontaneda González I, González Alcántara OJ.
363
Occupational accidents with ladders in Spain: Risk factors. J Saf Res 2011.
364
[37] Derr J, Forst L, Chen HY, Conroy L. Fatal falls in the US construction industry, 1990 to
365
1999. Journal of occupational and environmental medicine 2001;43[10]:853-860.
366
[38] Dong XS, Fujimoto A, Ringen K, Men Y. Fatal falls among Hispanic construction workers.
367
Accident Analysis & Prevention 2009;41[5]:1047-1052.
368
[39] Gillen M. Injuries from construction falls. Functional limitations and return to work.
369
AAOHN journal: official journal of the American Association of Occupational Health Nurses
370
1999;47[2]:65.
[40] Cattledge GH, Schneiderman A, Stanevich R, Hendricks S, Greenwood J. Nonfatal
372
occupational fall injuries in the West Virginia construction industry. Accident Analysis &
373
Prevention 1996;28[5]:655-663.
374
[41] Adam JM, Pallarés FJ, Calderón PA. Falls from height during the floor slab formwork of
375
buildings: Current situation in Spain. J Saf Res 2009;40[4]:293-299.
376 377 378
TABLES.
379
Table 1.Flexible point system for the selection of panel members.
380
Achievements or experience Points
Master of Science in Occupational Risk Prevention 5
Technical Degree [Architect or Engineer ] 4
Years of professional experience 1 per year
Professional registration 2
Author of a book on safety 2 per book
Author of an article on safety in a learned journal 2 per article
Faculty member at an accredited university 3
Ph.D. 4
381 382
Table 2. Panel members’ scores 383 Panel Member Master of Science in Occupational Risk Prevention Technical Degree Years of experience Professional registration Author of a book on safety Author of an article on safety in a learned journal Faculty member at and accredited university PhD Total Points Number of achievement categories Expert 1 5 4 18 2 32 22 3 4 90 8 Expert 2 5 4 23 0 0 4 3 0 39 5 Expert 3 5 4 12 0 4 12 0 0 37 5 Expert 4 5 4 10 2 4 0 0 0 25 5 Expert 5 5 4 13 2 0 0 0 0 24 5 Expert 6 5 4 0 0 8 0 3 4 24 5 Expert 7 5 4 12 2 0 0 0 0 23 4 Expert 8 5 4 6 2 0 0 0 0 17 4 TOTAL 40 32 94 10 48 38 9 8 279 41 Average 5.0 4.0 11.8 1.3 6.0 4.8 1.1 1.0 34.9 5.1 384 385
Table 3.Incident classification
386
Exposure to harmful substances
Fall to lower level
Fall onthe same level
Cutting
Overexertion
Struck against objects in motion
Struck against objects
Caught in or compressed
Repetitive motion
Others
387 388
Table 4. Activities
389
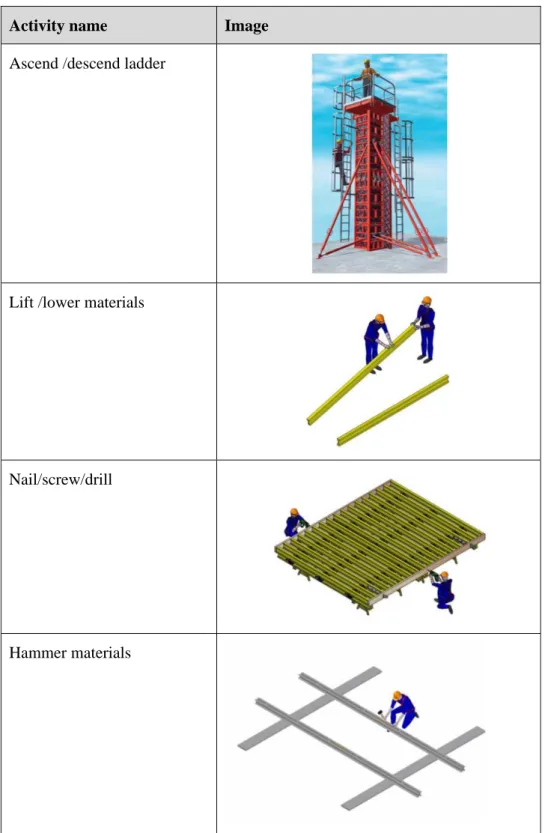
Activity name Description
Ascend /descend ladder Ascending or descending ladders to reach the workface at different levels from the ground.
Lift /lower materials Lifting or lowering materials or equipment from/to ground level.
Nail/screw/drill Nailing, screwing or drilling formwork components using hammer, nail gun or similar.
Hammer materials Hammer or drive large objects with tools such as a sledgehammer.
Crane materials and motorized transport
Materials or formwork components are transported by cranes or by vehicles such as trucks, skid steers or scissor lifts. Including loading operations.
Cut materials Formwork operations where plywood or aluminium is cut on-site.
Inspect/plan Workers, supervisors and managers of construction planning and inspecting the works.
Manual transport Transporting equipment and materials.
Static lift Supporting a portion of formwork while other workers connect components or materials.
Plumb/level forms Levelling and plumbing forms to shift and adjust a form.
Excavation Dig or move soil to prepare the ground.
Lubrication/preparation Formwork lubrication and preparation involving spraying form with oil and/or curing compound and setting and wetting curing blankets and expansion materials.
390 391 392 393
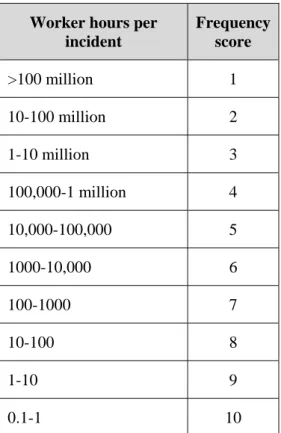
Table 5.Frequency Scale.
394
Worker hours per incident Frequency score >100 million 1 10-100 million 2 1-10 million 3 100,000-1 million 4 10,000-100,000 5 1000-10,000 6 100-1000 7 10-100 8 1-10 9 0.1-1 10 395 396
Table 6. Severity Scale
397
Subjective severity level Severity score
Negligible 1
Temporary discomfort 2
Persistent discomfort 4
Temporary pain 8
Persistent pain 16
Minor first aid 32
Major first aid 64
Medical case 128
Lost work time 256
Permanent disablement 1,024
Fatality 26,214
399
Table 7. Consensus of experts
400
401 402
Table 8. Risk Scores
403 Exposure to harmful substances Fall to lower level Fall on
same level Cutting Overexertion Struck against object in motion Struck against objects Caught-in Repetitive motion Others Ascend /descend ladder 2.73 · 10 -8 1.86· 10 -2 1.45· 10 -7 2.91· 10 -6 2.91·10 -5 2.91· 10 -7 2.91·10 -5 5.82· 10 -7 2.91·10 -5 1.00· 10 -8 Lift /lower materials 1.50· 10 -8 1.86· 10 -4 2.91· 10 -6 1.45·10 -5 2.91·10 -5 7.27· 10 -8 1.45·10 -5 1.16E-03 7.27· 10 -6 1.00· 10 -8 Nail/screw/drill 2.00· 10 -8 4.65· 10 -3 1.45· 10 -6 5.82· 10 -4 2.91· 10 -3 3.20 ·10 -7 1.45·10 -5 5.82· 10 -6 1.45· 10 -3 1.00· 10 -8 Hammer materials 1.50· 10 -8 4.65· 10 -4 2.91· 10 -6 2.91· 10 -4 2.91· 10 -4 3.20· 10 -7 1.45·10 -4 5.82· 10 -6 1.45· 10 -3 1.00· 10 -8 Crane materials and motorized transport 1.50· 10 -8 1.86· 10 -2 2.91·10 -5 2.91·10 -5 7.27· 10 -8 5.82· 10 -4 7.27· 10-8 1.16· 10 -4 7.27· 10 -7 1.00· 10 -8 Cut materials 1.00· 10 -8 1.16· 10 -5 2.91· 10 -6 5.82· 10 -2 2.91· 10 -4 3.20· 10 -7 1.45 10 -6 2.91· 10 -7 7.27· 10 -7 1.00· 10 -8 Inspect/plan 1.00· 10 -8 1.86· 10 -4 1.45· 10 -6 2.00· 10 -8 3.64· 10 -8 2.91· 10 -7 7.27·10 -7 4.00· 10 -8 7.27· 10 -8 1.00· 10 -8 Manual transport 1.00· 10 -8 4.65· 10 -4 7.27· 10 -8 2.91· 10 -7 2.91· 10 -3 5.82· 10 -7 2.91·10 -5 2.91· 10 -7 2.91· 10 -4 1.00· 10 -8 Static lift 1.00· 10 -8 1.86 ·10 -5 7.27· 10 -8 2.91·10 -5 2.91· 10 -4 1.45· 10 -7 1.45·10 -5 2.91· 10 -7 2.91· 10 -4 1.00· 10 -8 Plumb/level forms 1.82· 10 -8 4.77· 10 -1 2.91· 10 -7 2.91· 10 -6 5.82· 10 -4 5.82· 10 -6 1.45·10 -5 5.82· 10 -7 2.91· 10 -6 1.00· 10 -8 Excavation 1.00· 10 -8 4.65· 10 -3 5.82· 10 -6 1.45· 10 -7 2.91· 10 -6 2.91· 10 -6 1.45·10 -6 2.33· 10 -5 7.27· 10 -7 1.00· 10 -8 Lubrication/prep aration 3.64· 10 -8 1.86· 10 -4 2.91· 10 -6 2.91· 10 -6 5.82· 10 -4 5.82· 10 -6 1.45·10 -5 1.16· 10 -6 2.91·10 -5 1.00· 10 -8 404 405 406 407 408
Absolute deviation from the median
Frequency ratings Severity ratings
Table 9. Comparison of activity risk values
409
Vertical Formwork civil construction activities Risk score [S/w-h] Plumb/level forms 0.4772 Cut material 0.0585 Crane-lift material 0.0194 Ascend/descend ladder 0.0187 Nail/screw/drill 0.0096 Excavation 0.0047 Lift/lowe rmaterials 0.0037 Hammer materials 0.0027 Staticlift 0.0014 Lubrication/preparation 0.0008 Manual transport 0.0006 Inspect/plan 0.0002 TOTAL 0.5976 410 411 412 413 414 415 416 417 418
Table 10.Comparison of safety risk values.
419
Safety risk
Risk Score [S/w-h]
Fall to lower level 0.5247
Cutting 0.0591 Overexertion 0.0079 Repetitivemotion 0.0036 Caught-in 0.0013 Struck against object in motion 0.0006 Struckagainstobjects 0.0003
Fall on the same
level 0.0001 Exposure to harmful substances 0.0000 Others 0.0000 TOTAL 0.5976 420 421 422 423 424 425 426 427 428
Table 11. Activities description by images.
429
Activity name Image
Ascend /descend ladder
Lift /lower materials
Nail/screw/drill
Crane materials and motorized transport
Cut materials
Inspect/plan
Static lift Plumb/level forms Excavation Lubrication/preparation 430 431 432