Distribution of trace elements from a coal burned in
two different Spanish power stations
M. Antonia López-Antón*, Mercedes Díaz-Somoano, Raquel Ochoa-González and M. Rosa Martínez-Tarazona
Instituto Nacional del Carbón (INCAR), CSIC.c/ Francisco Pintado Fe, 26, 33011, Oviedo, Spain
*Corresponding author
Phone: +34 985119090 Fax: +34 985297662
Abstract
The behaviour of trace elements during coal combustion varies depending on their mode of occurrence in a given coal and the variations in the operational conditions in the power plants. However it is not yet clear to what extent these variables may influence the behaviour of trace elements. The aim of this study is to evaluate the influence of the operational conditions on the behaviour of trace elements in two coal-fired power plants when the same coal supply is used. Fractions of the fly ashes sampled from the hoppers of the electrostatic precipitators (ESPs) were studied and the relative enrichment factors (RE) of the elements were compared. Moreover, a series of leaching tests were carried out with the aim of determining the level of risk when the wastes are finally disposed of. The behaviour of the trace elements was found to be broadly similar. However, some differences were observed when evaluating their distribution among the different fly ash fractions from the ESPs. These differences are related to the operational variables of the power plants and to the performance of the mills. All of the coal combustion by-products evaluated in this work may be considered as inert wastes when they are disposed of.
1. Introduction
Most of the elements are present in coal in different proportions and, although some are found in concentrations lower than 0.1% (trace elements), these may cause various environmental or technological problems during energy production. The gradual introduction of increasingly restrictive legislation on emissions from combustion sources and the growing public concern relating to the emissions of trace elements have made this an imperative topic of research1-3.
Studies on the distribution of trace elements during coal combustion have shown that their volatility depends not only on their affinities and concentrations in coal and their physical changes and chemical reactions with minerals but also on the combustion parameters and the operational variables in the power stations4-9. Many of the differences in partitioning are attributed to the type of coal. In fact
they are more likely to be due to the form of the element in relation to coal rank. Elements associated with clays are generally retained in fly ash, whereas elements associated with the organic matrix are more likely to volatilize10. However, few works have focused on the distribution of trace elements from the same coal. Depending on the characteristics of the coal and the operational variables, most trace elements released from coal during combustion are redistributed among the bottom ash, fly ash and gaseous phase in different proportions. Several authors have studied the partitioning of trace elements among these different combustion products and, according to this partitioning, have classified them into groups11-12. However, the classification criterion is not exactly the same in all cases and not all the parameters have been considered.
The distribution of trace elements may be modified by improvements in the technologies used to control emissions. For instance, power plants have been equipped with electrostatic precipitators (ESPs) or other equally highly efficient systems (>99.9%) of particle capture, whose performance may modify the partitioning of the trace elements and their emission in fly ash particles leaving the stack.
In addition to the partitioning of trace elements among the ashes and gases, the relationship of trace metal emissions to fly ash particle size has been widely studied5, 13-16. It has been observed that
trace elements are preferentially concentrated in fly ash particles, and mostly in the fly ashes of smallest particle size. The results from several laboratories and field studies on the enrichment of trace elements in fractions of different particle size15-17 have shown that the submicron fraction of fly ashes is rich in trace elements such as Sb, As, Cd. It should also be noted that part of this submicron fraction is emitted into the environment.
The partitioning of trace elements among the coal combustion by-products (CCBs) is not only studied because of the toxicity of fly ash particles that may be emitted into the environment with the gases, but also because of the possible lixiviation of toxic elements when the ashes are disposed of at landfill sites. The negative impact on the environment due to potential leaching by acid rain and groundwater is a matter of considerable importance. Over 65 million tonnes of CCBs are produced annually in Europe. Among these, fly ash constitutes about 67% of the total amount of CCBs produced, 48% of which is used for road construction and cement replacement material18. Although a variety of leaching/metal extraction tests have shown that metal released from coal fly ash under natural conditions is not a cause for environmental concern19-21, elements such as As, Mo, Se, Sr and V have been shown to have a high mobility in some leaching tests 22. A study carried out on fly and
bottom ashes23 found that the leachable fraction was in most cases <1%, ranging from 1 to 52% for elements such as Mo, Cu, As, Zn, Ni, Tl and U, the mobility of these trace elements depending mostly on their pH21, 24-25. Metal release from coal fly ash has been observed to be pronounced both at low and high pHs, the lowest solubility corresponding to neutral pH21, 25-26. Although the leaching of cationic metals such as Pb, Cu and Ni tends to be low due to the alkaline nature of fly ash24, 27, very strong
alkaline conditions (pH>10) may favour their release as a consequence of desorption/dissolution reactions25, 28.
The present work is a comparative study of the behaviour of trace elements present in a coal taken from the same coal supply and used in two power plants operating under conditions that are similar in some respects but different in others. The study assesses the influence of these operational
variables on the characteristics of the fly ashes. The retention efficiency of ESPs depends on a range of factors such as particle size, ash resistivity, flue gas temperature and moisture content29. However, other parameters may influence the distribution of trace elements. To this end, the performance of ESPs in the partitioning of trace elements was evaluated. The trace element content in the different fly ash fractions was determined taking into account their distribution among the hoppers of the ESPs. The leaching characteristics of the fly ashes were also studied.
2. Experimental Section
2.1 Sample collection
The samples were obtained from two Spanish pulverized fuel power stations labeled A and B (between 300 and 600 MW), during a period in which both plants were fed with the same bituminous coal. In addition to the coal, a representative sample of bottom ash from each power station (BAA, BAB), seven representative samples of fly ashes (FA) from the hoppers of the electrostatic precipitators of power plant A and nine samples from B were taken for analysis. The samples of the feed coal (CA and CB) were obtained by sampling the mills feeding the boiler. The concentration of trace elements in these coals was calculated as a weighted average of the samples from each mill. Whereas the mills in power station A are ball mills, the mills in power station B are mortar mills. Consequently the particle size of the pulverized fuel is more homogeneous in the coal feed in A than in B.
The ESPs of both power plants operate between 140 and 160ºC. Power station A has two parallel electrostatic precipitators, each with a row of hoppers. Four hoppers were sampled in the first electrostatic precipitator (FAaA-FAdA) and only three in the second (FAeA-FAgA) as the fourth hopper did not accumulate enough fly ash during the sampling period. Power station B has just one precipitator with two rows. Five hoppers were sampled in the first row (FAhB-FAlB) and four in the second row (FAmB-FApB). Thus, samples FAhB and FAmB are parallel. As in the case of plant A, in
the last hopper of the second row no significant quantities of ashes were obtained. A schematic diagram of the hoppers of both power plants is shown in Figure 1. All of the fly ash samples from the hoppers were analyzed in order to study the partitioning and leachability of trace elements. For technical reasons representative samples of the fly ashes from each power plant (FAA and FAB) were not sampled but their composition was estimated from the weighted average of the trace element content of the fly ash fractions separated from the hoppers and their historical splitting percentages. Finally it should be noted that none of the plants have desulphurization systems.
2.2 Methods
With the exception of Hg, all the trace elements were analyzed as follows. 0.050 g of sample was digested in teflon high pressure digestion vessels with 2 ml of HNO3 (65%) and 2 ml of HF
(40%). 3 ml of saturated H3BO3 was also added after dissolution to neutralise the corrosive
hydrofluoric acid. The digestion was carried out in a microwave oven by decreasing the power from 600 to 250 W over a period of 24 min. The resulting solutions were analysed in a HP 4500 ICP-MS equipped with a Babington nebuliser and a RF power of 1200 W. The instrumental conditions were optimised using a tune solution containing 10 ng ml -1 of 7Li, 89Y, 140Ce and 205Tl. The solution
obtained by the microwave dissolution method was diluted to 50 ml. For the ICP-MS analysis, an aliquot of this solution and 100 μl of a 1 μg ml -1 solution of the internal standard (103Rh) were taken to 10 ml. The matrix effects were compensated for by using the standard addition method. The Hg analyses were carried out on solid and liquid samples using a LECO AMA 254 gold amalgam atomic absorption spectrometer after the pyrolysis of each sample in a combustion tube at approximately 750°C under an oxygen-rich atmosphere, and collection on a gold amalgamator. Two standard samples, a coal sample (SARM19) and a fly ash sample (1633 b), were employed throughout the work to ensure the quality of the results. The particle sizes of the samples were measured with a Beckman Coulter LS 13 320. The Coulter Counter technique determines the size and distribution of particles
suspended in a liquid by applying the theories of Fraunhofer or Mie scattered light (ASTM LS 13 320). This equipment works in a range of between 0.040-2.000 μm
A mass balance was calculated by normalising the concentration of each element in a given stream with the corresponding stream flow for the whole installation. A total of 5 streams, 4 solids (feed fuel blend, bottom ash, fly ash, particulate matter) and the gas stream were sampled and analysed in power stations A and B. The input flow is the feed fuel blend, whereas the output is composed of the bottom and fly ashes, particulate matter and flue gases.
Isokinetic measurements of gaseous streams were performed at the sampling point in each power plant. At each sampling point, two trains of sampling system were assembled with specific trapping solutions, one for the capture of metals and other for the capture of Hg. In the first case, the gas sampling system was devised according to standard UNE-EN 14385 (2004). The sampling of gaseous Hg was devised in accordance with the Ontario Hydro method (ASTM D6784 - 02(2008)).
2.3. Leaching tests
The amount of leachable trace elements in the fly ash and bottom ash samples was determined according to the standard UNE-EN-12457/2 method. 50 g of sample was transferred to a container with 500 ml of ultrapure water and stirred for 24 h, after which the sample was filtered. The conductivity and pH of the samples were then measured with a TitraLab 870 Titration apparatus and the trace element contents of the leachates were determined using ICP-MS and AMA.
3. Results and discussion
The results of the work were assessed on the basis of i) a comparison of the distribution and mass balances of Hg, Sb, As, Be, Cd, Co, Pb, Mn, Ni, Se, U, Ag, V, Zn, Mo and Cu in the two power plants fed by the same coal, ii) the enrichment factors (RE) of the elements in the ashes, focusing
especially on the fly ash fractions taken from each hopper and iii) a leachability test performed on the fly ashes.
3.1 Distribution of trace elements in the feed coal, fly ashes and bottom ashes
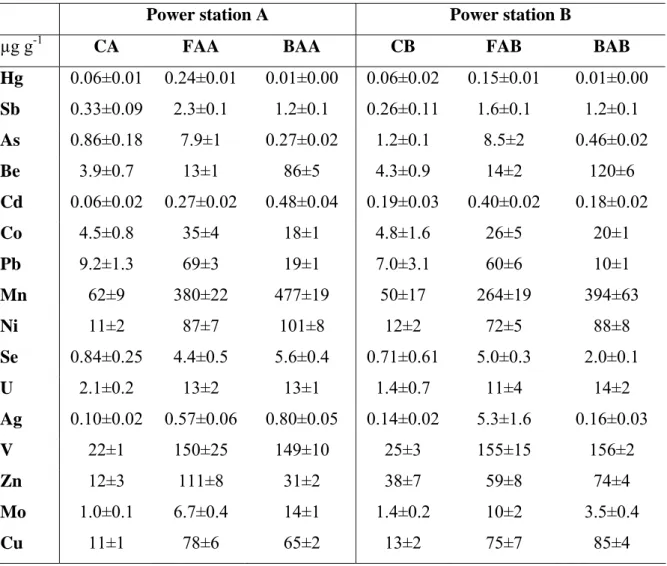
Table 1 shows the Hg, Sb, As, Be, Cd, Co, Pb, Mn, Ni, Se, U, Ag, V, Zn, Mo and Cu contents of the feed coals (CA, CB) and fly and bottom ashes (FA and BA), for power plants A and B. The confidence limit of the results is given as the standard deviation (SD). The concentrations of trace elements in CA and CB are within the standard range for world coals30 and, because CA and CB are from the same coal supply, their composition is similar, though not identical due to the fact that the coals burned in each power plant were taken from different coal piles and they were sampled from different types of mill. Most of the trace element contents in CA and CB were found to be the same with the exception of Cd and Zn, whose concentrations were 0.06, 0.21, and 12, 42 µg g-1, respectively. We have assumed that the concentrations in CA and CB are similar when the difference between them is lower than the reproducibility accepted by the ASTM standard methods (D6722-01, D6357-04 and D4606-03)
Taking into account the ASTM reproducibility results, the concentrations of most of the trace elements in the bottom ashes (BAA, BAB) and fly ashes (FAA, FAB) (Table 1), were also similar in the two power stations with some exceptions. The differences in the case of Cd and Zn may be related to the above mentioned variations in the composition of the feed combustible. However, the higher concentrations of Ag in FA from B, and the different distributions of Mo in FA and BA between power plants A and B (Table 1) suggest that the partitioning of some trace elements may be affected by the operational parameters. As a consequence of the different performances of the mills in power plants A and B, the particle size distribution of the feed coal CA is more homogeneous than that of CB. This may have caused different partitionings of some elements among the products and affected the homogeneity of the composition of these CCBs. Variations between compositions may also be a
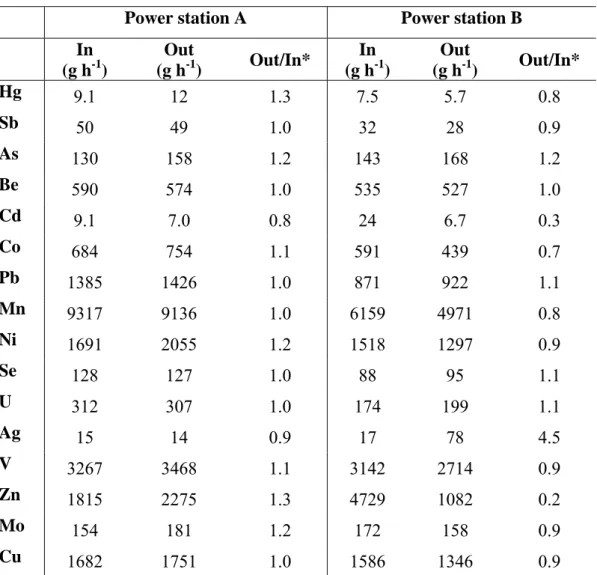
consequence of contamination by residual ashes or other products and materials during the process or the sampling campaign. With the aim of validating the sampling campaign, a mass balance was carried out in each power plant. The results of the mass balances are presented in Table 2 for all the elements studied. If we assume that the balance is closed with an error margin of 30% (Out/In= 1±0.3), the accuracy of the measurements of the fuel, ashes, particulate matter and flue gases is generally high with the exception of Cd, Ag and Zn in power plant B. The mass balances of Cd and Zn in B indicate that the ingoing flow of fuel was too high, confirming the hypothesis that the feed fuel CB had an irregular and non-representative content of these two elements (Table 2). The mass balance of Ag suggests possible contamination of the outgoing flow of bottom ash, fly ash, particulate matter or flue gas, although the effect of non- representative sampling due to the non-homogeneity of the coal particles in B could also be the reason for this deviation (Out/In »1).
The partitioning of trace elements in the fly ash, bottom ash, particulate matter and flue gases for the whole installation (Figure 2) reveals that most of the trace pollutants are concentrated in the fly ashes, whereas Hg is emitted mainly in gas phase and Be is concentrated in the bottom ash. As can be seen, broadly speaking, the distribution of elements was similar in both power plants.
3.2 Relative enrichment factors (REs)
The partitioning of the trace elements among the ashes and fly ash fractions was comparatively evaluated by using their relative enrichment (REs) factors as defined by Meij 31-32 [RE = (conc. in ash / conc. in coal) (% ash content in coal / 100)]. This parameter or other similar enrichment factors are commonly used to classify the different elements into groups. Meij’s classification scheme, which groups elements into Classes I, II and III, is based on an element’s degree of volatilization during combustion33-34. With respect to fly ashes, the RE for Class I is around 1.0 with a range of ± 0.3, whereas for Class II it is >1. All elements that volatilise in the boiler but condense in the ESPs are grouped in Class II. Class III elements have a very low RE factor. In other words, they are elements
that are mainly volatilized. If the RE value is higher or lower than 1, the trace element is enriched or depleted, respectively.
In this work the RE values were calculated for the fly ash fractions taken from the hoppers of the electrostatic precipitators of both power stations. The RE values were compared with the particle sizes in order to clarify the partitioning of trace elements among the fly ash fractions (Figures 3-6). It is remarkable that the size distribution of the fly ash fractions is completely different in the two ESPs. The particle size distribution is more homogeneous in A than in B. Most volatile trace elements are concentrated in the fly ash fractions of lowest particle size especially in the case of ESP B where the differences in size are also more marked. Bearing in mind that no sample was taken from the last hopper of the second row in the ESPs of both power plants, if we compare the composition of the fly ashes sampled from the parallel hoppers of each precipitator, there are clear differences between power plant A and B (Figures 3-6). This is because the parallel burners in power plant A and B show different combustion efficiencies. This effect is much more significant in power plant B, where the particle size of the ashes taken from the first two hoppers is higher than 100 μm compared to A where it is lower than 50 μm. The elements: Sb, As, Pb and Se in both power plants (Figures 3-6) and Ag, Mo in B (Figures 5-6) have REs values »1, and in the fractions of smaller particles33-34 reach values as high as 10-20 (Sb, As, Se, Ag). The RE factor of the fly ash fractions is about 1 or slightly higher than 1 for the rest of the elements with the exception of Hg and Be in both power plants (Figure 3) and Cd and Zn in B (Figures 4 and 6), whose RE factors are «1.
Furthermore, Figure 7 shows the RE factors for the two fly ashes (FAA and FAB), whose composition was estimated as the weighted average of the fractions taken from the hoppers analyzed. The elements differentiated in Figure 7 (Cd, Ag and Zn in B) were the elements whose mass balances were not closed. They are also the elements whose RE values are much higher or lower than 1. Cd and Zn show RE factors «1 and their Out/In ratios in the mass balance were 0.3 and 0.2 respectively in power plant B (Table 2). This may confirm the non-homogeneity of the feed fuel which would lead to
non-representative sampling and, as a consequence, an overestimation of the concentration of these elements in the fuel (Table 1). The high values of the RE factors for Ag in B can be misinterpreted (Figure 7). This element is the one that showed the highest Out/In ratios in the mass balances (above 1.3), (Table 2) and therefore, the most vulnerable to contamination by residual materials. This may have produced an increase in the amount of Ag in some fractions of the fly ashes. This would explain the different behaviours of Ag in the fly ash fractions between two power plants, as can be seen in Figures 3 and 5.
In general, most of the elements have RE factors ≥1, Hg and Be being the elements with RE factors <1, i.e., they are present in very low proportions in the fly ashes (Class III) (Figure 7). The elements Sb, As, Cd, Pb, Se and Mo are mainly concentrated in the FA of lowest particle size (Figures 3-6). However, no clear relationship based on particle size was found for the other elements.
The relative enrichment factors for trace elements in the bottom ashes from power station A (BAA) and B (BAB) are shown in Figure 8. A comparison of FA and BA (Figures 7-8), shows that elements such as Hg, Sb, As, Co, Pb and Zn are enriched in FA, whereas elements such as Be, Cd, and Mn are enriched in BA. The elements Ni, Se, U, Ag, V and Cu have similar RE values. The behavior of Mo in the two BA from the two power plants was different. Mo shows an RE value of «1 in power station B and of »1 in power station A (Figure 8). The different distributions of Mo in the power plants were also observed in the FAs (Table 1, Figure 6). This again indicates that the operational conditions may have caused a different partitioning of some elements during coal combustion.
3.3 Leachable concentrations from the fly ashes and bottom ashes
The pH values for the fly and bottom ash leachates ranged from 8 to 13. The conductivity for the fly ashes ranges from 2 to 9 mS cm-1,whereas for the bottom ashes it is slightly lower (148-172 µS cm-1). The fly ashes from power station A have lower alkalinity leachates with a very narrow pH range (pH from 8.4 to 8.5), whereas the fly ashes from power plant B exhibit a pH from 8 to 13.
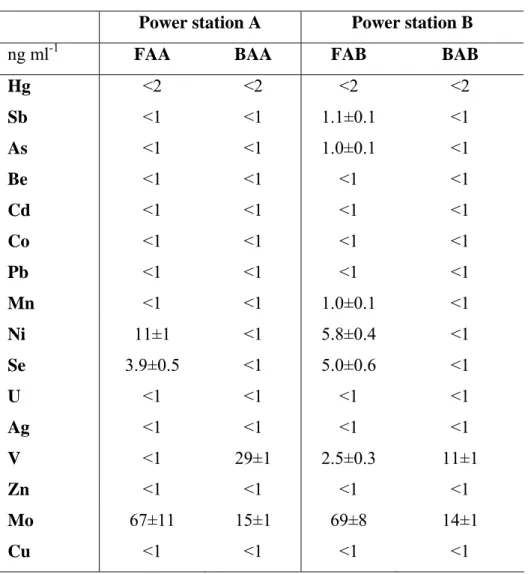
Table 3 shows the concentration of trace elements in the leachates for the FA, which was calculated as the weighted average of the elements in solution and BA. Most of the elements were leached from the fly ashes in inappreciable amounts (outside the detection limit) and Ni, Se, V and Mo in concentrations of the order of ng ml-1. The leachable proportion from the coal fly ashes is less than 5% of the total metal content of all the elements.
The concentration of trace elements in the leachates from the bottom ashes showed no appreciable values for any of the elements with the exception of V and Mo, although their concentrations were still very low, ranging from 11 to 29 ng ml-1.
According to Council Directive 2003/33/CEE35, these fly ashes may be admitted to disposal sites as inert wastes. Therefore, these fly ashes do not represent an environmental risk.
4. Conclusions
On comparing the mass balances and distributions of trace elements in two power plants fed with the same coal from the same coal supply, we observed no significant differences, especially in the case of Hg, which is mainly emitted in gas phase, nor in the case of Be, which is concentrated in BA, nor in the rest of the trace elements, which are concentrated in the FA. However, an in-depth study of the fly ash fractions taken from the hoppers of the ESPs revealed that some operational variables, especially the different performances of the mills, may significantly modify the composition of FA. In fact, the particle size of the pulverized fuel was more homogeneous in the coal feed of A than in that of B which led to elements such as Sb, As and Se being more enriched in the fly ash fractions of lowest particle size in B than in power plant A with the result that the emissions to the air were generally lower. All of the CCBs evaluated in this work can be considered inert waste suitable for disposal since their leachable concentration does not exceed the limit beyond which waste is considered hazardous.
Acknowledgements
The authors gratefully acknowledge to FICYT (Regional research programme) for the award of a predoctoral fellowship to Ms Raquel Ochoa-González.
References
(1) U.S. Environmental Protection Agency, http://www.epa.gov
(2) WHO, 2000. Air quality Guidelines for Europe. WHO Regional Publications Eur. Ser. No. 91, Regional Office for Europe, Copenhagen, Denmark
(3) Directive of the European Parliament and of the Council on industrial emissions (integrated pollution prevention and control) (recast). 2010. Available at: http://www.cogeneurope.eu/wp-content/uploads//2010/03/Council-Common-Position-on-IPPC-IED_st11962.en09.pdf
(4) Clarke, L. Sloss, L. Trace elements: emissions from coal combustion and gasification, IEACR,
vol. 49, IEA Coal Research, London, 1992.
(5) Querol, X.; Fernández-Turiel, J. L.; López-Soler, A. Trace elements in coal and their behaviour during combustion in a large power station. Fuel. 1995, 74, 331.
(6) Bool, L. E.; Helble, J. J. A laboratory study of the partitioning of trace elements during pulverized coal combustion. Energy Fuels. 1995, 9, 880.
(7) Selcuk, N.; Gogebakan, Y.; Gogebakan, Z. Partitioning behaviour of trace elements during pilot-scale fluidized bed combustion of high ash content lignite. J. Hazard. Mater. 2006, B137,
1698.
(8) Xu, M.; Yan, R.; Zheng, Ch.; Qiano, Y.; Han, J.; Sheng, Ch. Status of trace element emission in a coal combustion process: a review. Fuel Process. Technol. 2003, 85, 215.
(9) Meij, R. Distribution of trace species in Power Plant Streams: A Europe Perspective. American Power Conference, Chicago, IL, 1994.
(10) Helble, J. J.; Sarofim, A. F. Trace element behavior during coal combustion. ACS Division of Fuel Chemistry Preprints 1993, 38, 257.
(11) Cenni, R.; Frandsen, F.; Gerhardt, T.; Spliethoff, H.; Hein, K. R. G. Study on trace metal partitioning in pulverized combustion of bituminous coal and dry sewage sludge. Waste Manage.
1998, 18, 433.
(12) Yan, R.; Gauthier, D.; Flamant, G. Volatility and chemistry of trace elements in a coal combustor. Fuel. 2001, 80, 2217.
(13) Seames, W.; Wendt, J. O. L. Partitioning of arsenic, selenium, and cadmium during the combustion of Pittsburgh and Illinois #6 coals in a self-sustained combustor. Fuel Process. Technol.
2000, 63, 179.
(14) Zeng, T.; Sarofirm, D. F.; Senior, C. L. Vaporization of arsenic, selenium and antimony during coal combustion. Combust. Flame. 2001, 126, 1714.
(15) Linak, W. P.; Wendt, J. O. L. Toxic metal emissions from incineration: Mechanisms and control. Prog. Energy Comb. Sci. 1993, 19, 145.
(16) Skodras, G.; Grammelis, P.; Prokopidou, M.; Kakaras, E.; Sakellaropoulos, G. Chemical, leaching and toxicity characteristics of CFB combustion residues. Fuel. 2009, 88, 1201.
(17) Spears, D. A.; Martínez-Tarazona, M. R. The fate of trace elements and bulk minerals in pulverized coal combustion in a power station. Fuel Process. Technol. 1996, 47, 79 -92.
(18)European Coal Combustion Products Association, http://www.ecoba.com/ecobaaccpprod.html
(19) Querol, X.; Juan, R.; Lopez-Soler, A.; Fernandez-Turiel, J. L.; Ruiz C. R. Mobility of trace elements from coal and combustion wastes. Fuel 1996, 75, 821.
(20) Huggins, F. E.; Senior, C. L.; Chu, P.; Ladwing, K.; Huffman, G. P. Selenium and arsenic speciation in fly ash from full-scale coal-burning utility plants. Environ. Sci. Technol. 2007, 41,
(21) Jankowski, J.; Ward, C. R.; French, D.; Groves, S. Mobility of trace elements from selected Australian fly ashes and its potential impact on aquatic ecosystems. Fuel. 2006, 85, 243.
(22) Moreno, N.; Querol, X.; Andrés, J. M.; Stanton, K.; Towler, M.; Nugteren, H.; Janssen-Jurkovicová, M.; Jones, R. Physico-chemical characteristics of European pulverized coal combustion fly ashes Fuel. 2005, 84, 1351.
(23) Pires, M.; Querol, X. Characterization of Candiota (South Brazil) coal and combustion by-product. Int. J. Coal Geol. 2004, 60, 57.
(24) Kim, A. G. The effect of alkalinity of Class F PC fly ash on metal release. Fuel. 2006, 85,
1403.
(25) Al-Abed, S. R.; Jegadeesan, G.; Purandare, J.; Allen, D. Arsenic release from iron rich mineral processing waste: influence of pH and redox potential. Chemosphere 2007, 66, 775.
(26) Wang, J.; Ban, H.; Teng, X.; Wang, H.; Ladwig, K. Impacts of pH and ammonia on the leaching of Cu(II) and Cd(II) from coal fly ash. Chemosphere 2006, 64, 1892.
(27) Kim, A. G.; Kazonich, G.; Dahlberg, M. Relative solubility of cations in Class F fly ash.
Environ Sci Technol 2003, 37, 4507.
(28) Van der Hoek, E. E.; Bonouvrie, P. A.; Comans, R. N. J. Sorption of As and Se on mineral components of fly ash: relevance for leaching processes. Appl. Geochem. 1994, 9, 403.
(29) Clarke, L. B. The fate of trace elements during coal combustion and gasification. Fuel 1993,
72, 733.
(30) Swaine, D. J. Trace elements in coal. Butterworth and Co Ltd 276pp, London U.K, 1990.
(31) Meij, R.; Van Der Kooij, J.; Van Der Sluys, J. L. G.; Siepman, F. G. C.; Van Der Sloot, H. A. The emission of fly ash and trace species from pulverized coal fired utility boilers. Proceedings of the sixth world clean air congress, Paris,1983; vol IV, 317.
(32) Meij, R. Trace elements behaviour in coal-fired power plants. Fuel Process. Technol. 1994, 39,
(33) Meij, R.; Vredenbregt, L. H. J.; Winkel, H. T. The fate of mercury in coal-fired power plants.
J. Air Waste Manage. Assoc. 2002, 52, 912.
(34) Meij, R.; Winkel, H. T. The emissions of heavey metals and persistent organic pollutants from modern coal-fired power stations. Atmos. Environ. 2007, 41, 9262.
(35) Council Decision 2003/33/EC of 19 December 2002 establishing criteria and procedures for the acceptance of waste at landfills pursuant to Article 16 and Annex II to Directive 1999/31/EC.
Table 1. Concentrations of trace elements in the feed coals, fly ashes and bottom ashes for power stations A and B.
Power station A Power station B
µg g-1 CA FAA BAA CB FAB BAB
Hg 0.06±0.01 0.24±0.01 0.01±0.00 0.06±0.02 0.15±0.01 0.01±0.00 Sb 0.33±0.09 2.3±0.1 1.2±0.1 0.26±0.11 1.6±0.1 1.2±0.1 As 0.86±0.18 7.9±1 0.27±0.02 1.2±0.1 8.5±2 0.46±0.02 Be 3.9±0.7 13±1 86±5 4.3±0.9 14±2 120±6 Cd 0.06±0.02 0.27±0.02 0.48±0.04 0.19±0.03 0.40±0.02 0.18±0.02 Co 4.5±0.8 35±4 18±1 4.8±1.6 26±5 20±1 Pb 9.2±1.3 69±3 19±1 7.0±3.1 60±6 10±1 Mn 62±9 380±22 477±19 50±17 264±19 394±63 Ni 11±2 87±7 101±8 12±2 72±5 88±8 Se 0.84±0.25 4.4±0.5 5.6±0.4 0.71±0.61 5.0±0.3 2.0±0.1 U 2.1±0.2 13±2 13±1 1.4±0.7 11±4 14±2 Ag 0.10±0.02 0.57±0.06 0.80±0.05 0.14±0.02 5.3±1.6 0.16±0.03 V 22±1 150±25 149±10 25±3 155±15 156±2 Zn 12±3 111±8 31±2 38±7 59±8 74±4 Mo 1.0±0.1 6.7±0.4 14±1 1.4±0.2 10±2 3.5±0.4 Cu 11±1 78±6 65±2 13±2 75±7 85±4
Table 2. Mass balances of the trace elements in power stations A and B. Power station A Power station B In (g h-1) Out (g h-1) Out/In* In (g h-1) Out (g h-1) Out/In* Hg 9.1 12 1.3 7.5 5.7 0.8 Sb 50 49 1.0 32 28 0.9 As 130 158 1.2 143 168 1.2 Be 590 574 1.0 535 527 1.0 Cd 9.1 7.0 0.8 24 6.7 0.3 Co 684 754 1.1 591 439 0.7 Pb 1385 1426 1.0 871 922 1.1 Mn 9317 9136 1.0 6159 4971 0.8 Ni 1691 2055 1.2 1518 1297 0.9 Se 128 127 1.0 88 95 1.1 U 312 307 1.0 174 199 1.1 Ag 15 14 0.9 17 78 4.5 V 3267 3468 1.1 3142 2714 0.9 Zn 1815 2275 1.3 4729 1082 0.2 Mo 154 181 1.2 172 158 0.9 Cu 1682 1751 1.0 1586 1346 0.9
Table 3. Concentrations of leachable trace elements in the fly and bottom ashes Power station A Power station B
ng ml-1 FAA BAA FAB BAB
Hg <2 <2 <2 <2 Sb <1 <1 1.1±0.1 <1 As <1 <1 1.0±0.1 <1 Be <1 <1 <1 <1 Cd <1 <1 <1 <1 Co <1 <1 <1 <1 Pb <1 <1 <1 <1 Mn <1 <1 1.0±0.1 <1 Ni 11±1 <1 5.8±0.4 <1 Se 3.9±0.5 <1 5.0±0.6 <1 U <1 <1 <1 <1 Ag <1 <1 <1 <1 V <1 29±1 2.5±0.3 11±1 Zn <1 <1 <1 <1 Mo 67±11 15±1 69±8 14±1 Cu <1 <1 <1 <1
Figure captions
Figure 1. Schematic of the situation of the samples taken from the hoppers of the electrostatic precipitator in power plants A and B.
Figure 2. Distribution of the elements in the bottom ash, fly ash, particulate matter and flue gases for whole installation in power station A (a) and B (b).
Figure 3. Enrichement factors for Hg, Sb, As and Be in the fly ash samples from power station A (a) and B (b).
Figure 4. Enrichement factors for Cd, Co, Pb and Mn in the fly ash samples from power station A (a) and B (b).
Figure 5. Enrichement factors for Ni, Se, U and Ag in the fly ash samples from power station A (a) and B (b).
Figure 6. Enrichement factors for V, Zn, Mo and Cu in the fly ash samples from power station A (a) and B (b).
Figure 7. Enrichment factors for the trace elements in the fly ashes from power station A (FAA) and B (FAB).
Figure 8. Enrichment factors for the trace elements in the bottom ashes from power station A (BAA) and B (BAB).
Figure 1. b c e f g a d h i j k l m n o p A B
(a) (b) 0% 20% 40% 60% 80% 100% Hg Sb As Be Cd Co Pb Mn Ni Se U Ag V Zn Mo Cu Bottom ash Fly ash Gas phase Particulate matter
0% 20% 40% 60% 80% 100% Hg Sb As Be Cd Co Pb Mn Ni Se U Ag V Zn Mo Cu Bottom ash Fly ash Gas phase Particulate matter
FAaA FAbA FAcA FAdA FAeA FAfA FAgA 0.0 1.0 2.0 3.0 4.0 RE 0 20 40 60 80 100 120 μm Hg Particle size
FAhB FAiB FAjB FAkB FAlB FAmBFAnB FAoB FApB 0.0 1.0 2.0 3.0 4.0 RE 0 20 40 60 80 100 120 μm Hg Particle size
FAaA FAbA FAcA FAdA FAeA FAfA FAgA 0.0 1.0 2.0 3.0 4.0 RE 0 20 40 60 80 100 120 μm Sb Particle size
FAhB FAiB FAjB FAkB FAlB FAmBFAnB FAoB FApB 0.0 2.0 4.0 6.0 8.0 10.0 12.0 RE 0 20 40 60 80 100 120 μm Sb Particle size
FAaA FAbA FAcA FAdA FAeA FAfA FAgA 0.0 2.0 4.0 6.0 8.0 10.0 12.0 14.0 RE 0 20 40 60 80 100 120 μm As Particle size
FAhB FAiB FAjB FAkB FAlB FAmBFAnB FAoB FApB 0.0 2.0 4.0 6.0 8.0 10.0 12.0 14.0 16.0 RE 0 20 40 60 80 100 120 μm As Particle size
FAaA FAbA FAcA FAdA FAeA FAfA FAgA 0.0 1.0 2.0 3.0 4.0 RE 0 20 40 60 80 100 120 μm Be Particle size
FAhB FAiB FAjB FAkB FAlB FAmBFAnB FAoB FApB 0.0 1.0 2.0 3.0 4.0 RE 0 20 40 60 80 100 120 μm Be Particle size (a) (b) Figure 3.
FAaA FAbA FAcA FAdA FAeA FAfA FAgA 0.0 1.0 2.0 3.0 4.0 RE 0 20 40 60 80 100 120 μm Cd Particle size
FAhB FAiB FAjB FAkB FAlB FAmBFAnB FAoB FApB 0.0 1.0 2.0 3.0 4.0 RE 0 20 40 60 80 100 120 μm Cd Particle size
FAaA FAbA FAcA FAdA FAeA FAfA FAgA 0.0 1.0 2.0 3.0 4.0 RE 0 20 40 60 80 100 120 μm Co Particle size
FAhB FAiB FAjB FAkB FAlB FAmBFAnB FAoB FApB 0.0 1.0 2.0 3.0 4.0 RE 0 20 40 60 80 100 120 μm Co Particle size
FAaA FAbA FAcA FAdA FAeA FAfA FAgA 0.0 1.0 2.0 3.0 4.0 RE 0 20 40 60 80 100 120 μm Pb Particle size
FAhB FAiB FAjB FAkB FAlB FAmBFAnB FAoB FApB 0.0 1.0 2.0 3.0 4.0 RE 0 20 40 60 80 100 120 μm Pb Particle size
FAaA FAbA FAcA FAdA FAeA FAfA FAgA 0.0 1.0 2.0 3.0 4.0 RE 0 20 40 60 80 100 120 μm Mn Particle size
FAhB FAiB FAjB FAkB FAlB FAmBFAnB FAoB FApB 0.0 1.0 2.0 3.0 4.0 RE 0 20 40 60 80 100 120 μm Mn Particle size (a) (b) Figure 4
FAaA FAbA FAcA FAdA FAeA FAfA FAgA 0.0 1.0 2.0 3.0 4.0 RE 0 20 40 60 80 100 120 μm Ni Particle size
FAhB FAiB FAjB FAkB FAlB FAmBFAnB FAoB FApB 0.0 1.0 2.0 3.0 4.0 RE 0 20 40 60 80 100 120 μm Ni Particle size
FAaA FAbA FAcA FAdA FAeA FAfA FAgA 0.0 1.0 2.0 3.0 4.0 RE 0 20 40 60 80 100 120 μm Se Particle size
FAhB FAiB FAjB FAkB FAlB FAmBFAnB FAoB FApB 0.0 4.0 8.0 12.0 16.0 20.0 RE 0 20 40 60 80 100 120 μm Se Particle size
FAaA FAbA FAcA FAdA FAeA FAfA FAgA 0.0 1.0 2.0 3.0 4.0 RE 0 20 40 60 80 100 120 μm U Particle size
FAhB FAiB FAjB FAkB FAlB FAmBFAnB FAoB FApB 0.0 1.0 2.0 3.0 4.0 RE 0 20 40 60 80 100 120 μm U Particle size
FAaA FAbA FAcA FAdA FAeA FAfA FAgA 0.0 1.0 2.0 3.0 4.0 RE 0 20 40 60 80 100 120 μm Ag Particle size
FAhB FAiB FAjB FAkB FAlB FAmBFAnB FAoB FApB 0.0 2.0 4.0 6.0 8.0 10.0 12.0 14.0 16.0 18.0 20.0 RE 0 20 40 60 80 100 120 μm Ag Particle size (a) (b) Figure 5
FAaA FAbA FAcA FAdA FAeA FAfA FAgA 0.0 1.0 2.0 3.0 4.0 RE 0 20 40 60 80 100 120 μm V Particle size
FAhB FAiB FAjB FAkB FAlB FAmBFAnB FAoB FApB 0.0 1.0 2.0 3.0 4.0 RE 0 20 40 60 80 100 120 μm V Particle size
FAaA FAbA FAcA FAdA FAeA FAfA FAgA 0.0 1.0 2.0 3.0 4.0 RE 0 20 40 60 80 100 120 μm Zn Particle size
FAhB FAiB FAjB FAkB FAlB FAmBFAnB FAoB FApB 0.0 1.0 2.0 3.0 4.0 RE 0 20 40 60 80 100 120 μm Zn Particle size
FAaA FAbA FAcA FAdA FAeA FAfA FAgA 0.0 1.0 2.0 3.0 4.0 RE 0 20 40 60 80 100 120 μm Mo Particle size
FAhB FAiB FAjB FAkB FAlB FAmBFAnB FAoB FApB 0.0 1.0 2.0 3.0 4.0 RE 0 20 40 60 80 100 120 μm Mo Particle size
FAaA FAbA FAcA FAdA FAeA FAfA FAgA 0.0 1.0 2.0 3.0 4.0 RE 0 20 40 60 80 100 120 μm Cu Particle size
FAhB FAiB FAjB FAkB FAlB FAmBFAnB FAoB FApB 0.0 1.0 2.0 3.0 4.0 RE 0 20 40 60 80 100 120 μm Cu Particle size (a) (b) Figure 6
Hg Sb As Be Cd Co Pb Mn Ni Se U Ag V Zn Mo Cu FAA 0.0 1.0 2.0 3.0 4.0 5.0 RE Hg Sb As Be Cd Co Pb Mn Ni Se U Ag V Zn Mo Cu FAB 0.0 1.0 2.0 3.0 4.0 5.0 6.0 RE Figure 7
Hg Sb As Be Cd Co Pb Mn Ni Se U Ag V Zn Mo Cu BAA 0.0 1.0 2.0 3.0 4.0 RE Hg Sb As Be Cd Co Pb Mn Ni Se U Ag V Zn Mo Cu BAB 0.0 1.0 2.0 3.0 4.0 RE Figure 8