Document
de
travail
CENTRAL BANK FORECASTS AS
AN INSTRUMENT OF MONETARY
POLICY
Paul Hubert
(OFCE)
201
1- 23
/
No ve mb er 2 0 1 1Central Bank Forecasts as an Instrument of Monetary Policy
Paul Hubert
*OFCE
2011 - 23 November 2011 AbstractPolicymakers at the Federal Open Market Committee (FOMC) publish macroeconomic forecasts since 1979. Some studies find that these forecasts do not contain useful information to predict these macroeconomic variables compared to other forecasts. In this paper, we examine the value of publishing these FOMC forecasts in two steps. We assess whether they influence private forecasts and whether they may be considered as a policy instrument. We provide original evidence that FOMC forecasts are able to influence private expectations. We also find that FOMC forecasts give information about future Fed rate movements, affect policy variables in a different way from the Fed rate, and respond differently to macro shocks.
JEL classification: E52, E58
Keywords: Monetary Policy, Forecasts, FOMC, Influence, Policy signals, Structural VAR.
* I would like to thank Christophe Blot, Camille Cornand, Jérôme Creel, Michael Ehrmann, Harun Mirza, Francesco
Saraceno and Xavier Timbeau for useful comments and suggestions, as well as seminar participants at OFCE. Email: paul.hubert@ofce.sciences-po.fr. Address: OFCE (SciencesPo), 69 quai d’Orsay, 75340 Paris cedex 07.
1. Introduction
Two times per year since 1979 and four times per year since 2007, the Federal Open Market Committee (FOMC), which consists of twelve voting members including the seven members of the Board of Governors of the Federal Reserve and is responsible for the implementation of US monetary policy, publishes macroeconomic forecasts as part of the Monetary Policy Report to the Congress. As these FOMC forecasts are closely monitored by the public, the purpose of this study is to analyze their value.
Monetary policy is increasingly about managing private expectations for two reasons. First, the expectations channel is one of the most subtle channels of monetary policy. Indeed, changes in the central bank short-term interest rate affect the expectations of private agents of inflation, employment and growth, and such expectations then determine future realizations of these variables. However, the impact of monetary policy through this channel is uncertain as it depends on the private agents’ interpretation of interest rate variations. For instance, private agents may interpret that a decrease in the interest rate will lead to higher growth in the future, increasing their confidence to consume and invest. At the opposite, they may interpret that growth is weaker than expected and need the central bank to intervene, decreasing their confidence. The policy decisions of the central bank can therefore be understood in various ways and this is one reason why central banks complement their actions with communication to the public. King (2005) summarizes that “because inflation expectations matter to the behaviour of the households and firms, the critical aspect of monetary policy is how decisions of the central bank affect those expectations”.
A second rationale for shaping private expectations is to shorten the transmission lag of monetary policy, given the long time lag between policy actions and their effects on the real economy with the traditional channels of transmission. The effectiveness of monetary policy thus depends on the policymakers’ ability to promptly affect private expectations.
Central bank communication can take different forms (see Blinder et al. (2008) for a comprehensive survey): statements, minutes, interviews, or speeches. This paper focuses on a different way to communicate to the public in order to potentially manage private expectations: the publication of policymakers’ macroeconomic forecasts. The quantitative communication of the central bank has the advantage that its use is not based on judgmental classifications (content analysis, word counting, etc) and it is possible to assess its quality. We therefore abstract from qualitative communication and focus specifically on policymakers’ forecasts. The first question this paper assesses is whether central bank forecasts influence private ones in the US. Fujiwara (2005) and Ehrmann, Eijffinger and Fratzscher (2009), among others, have tested whether central bank forecasts or the degree of central bank transparency have an impact on the dispersion of private forecasts, whereas we focus on the effect of FOMC forecasts on the level of private forecasts. This question matters for two reasons: first, in practice, a central bank which is able to influence private expectations is supposed to make monetary policy implementation more effective. Second, in theory, Bernanke and Woodford (1997) have shown that a monetary policy influenced by private expectations may lead to indeterminacy, whereas Muto (2011) argues that when private agents follow the central bank, it must respond more strongly to expected inflation to achieve macroeconomic stability. Influential central bank
forecasts may also lead private agents to stop forming their specific information set and only refer to central bank information, as Morris and Shin (2002) show that there may be a crowding out effect of public information on independent sources of information. The ability to influence might then be self-sustained. Finally, Amato and Shin (2006) develop a model emphasizing that the central bank, as the policymaker, shapes market expectations. This paper provides original empirical evidence on the influencing ability of FOMC forecasts.
If it turns out that FOMC forecasts influence private ones, a further question is why. Two main reasons may be put forward: first, central bank forecasts may have lower forecast errors than private ones and are therefore used by private agents to produce more accurate forecasts of the economic outlook. Second, central bank forecasts may convey signals of two types. FOMC forecasts may act as policy signals and hence be important to understand the appropriate stance of monetary policy (referring to the uncertainty of policy actions), to shed light on monetary policy preferences, strategies and objectives, and/or to extract private information. FOMC forecasts may also act as public signals which provide a focal point for private agents to coordinate when prices are strategic complements and agents seek to coordinate (Morris and Shin, 2002). Romer and Romer (2008) show that FOMC forecasts do not contain useful additional information to predict future realizations, while Gavin and Pande (2008) find evidence that FOMC forecasts are not more accurate than private ones. Ellison and Sargent (2010) argue in response to Romer and Romer (2008) that FOMC forecasts depict a worst-case scenario used to design robust policy decisions. Finally, Orphanides and Wieland (2008) show that FOMC forecasts have a predominant explanatory power for Fed rate decisions compared to observed economic outcomes. These four papers support the idea that FOMC forecasts may convey signals, and that this may be the reason for their ability to influence.
The second goal of this paper is to characterize this signaling content of FOMC forecasts. How do FOMC forecasts work? What are their effects? To answer these questions, we test whether central bank forecasts enhance the implementation of usual policy actions or are another instrument of monetary policy. Indeed, publishing central bank forecasts may make monetary policy actions more effective as well as it may provide different outcomes than interest rate decisions do. Monetary policy instruments would be the various tools that a central bank can use to influence private inflation expectations, to impact some intermediate targets as money market and long-term interest rates, and to achieve its final objectives: stabilizing inflation and economic activity. Private inflation expectations are ranked first as they are important determinants of wage increases, future inflation as well as long-term interest rates. The response
to this second question will then consist in assessing (a) to what extent FOMC forecasts have
effects different from the Fed rate on private expectations, intermediate targets and final
objectives, (b) whether the introduction of FOMC forecasts modifies the effects of Fed rate
actions, (c) whether the Fed rate and FOMC forecasts are complementary, and (d) whether
FOMC forecasts and the Fed rate respond to macroeconomic shocks in the same way.
This paper is related to three strands of the existing literature. The first one deals with the content and the effects of the FOMC communication. Gavin (2003), Gavin and Mandal (2003), Gavin and Pande (2008), Capistran (2008), Tillmann (2010) and McCracken (2010) analyze the characteristics, biases and performances of FOMC forecasts while Meade (2005), Chappell et al. (2007), Meade and Stasavage (2008), Banternghansa and McCracken (2009) and Tillmann (2011) study the voting procedure inside the FOMC and how the preparation of and the divergence in
forecasts may respond to strategic behaviours. Kohn and Sack (2004), Gürkaynak, Sack and Swanson (2005), Ehrmann and Fratzscher (2007), Rosa (2008) and Farka (2010) study how FOMC statements impact asset prices and long-term yields. Boukus and Rosenberg (2006) show that FOMC minutes also impact long-term yields. Pakko (2005) and Lucca and Trebbi (2009) assess the policy stance of FOMC statements. Last, Bauer et al. (2006) finds that private forecasts have been more synchronized since FOMC started to publish statements with Fed rate decisions, but that forecast errors have not become smaller since then.
The second one refers to the signaling role of central bank action or communication. Geraats (2005) shows that the publication of central bank forecasts provides reputational signals on the
type of central banks.Walsh (2007) analyzes the welfare effects of the publication of central bank
forecasts and proposes optimal degrees of transparency according to demand and cost-push shocks. Baeriswyl and Cornand (2010) analyze how central bank actions may convey signals to the public and show that central banks may adjust their policy decisions in order to withhold some information. Empirically, the signaling role of actions has been studied by Romer and Romer (2000), who show that ‘‘the Federal Reserve’s actions signal its information’’ since private agents revise their inflation expectations in response to policy decisions. Finally, Gürkaynak, Sack and Swanson (2005) provide evidence that both monetary policy actions and FOMC statements have important and different effects on asset prices.
The third one focuses on the influence of private expectations. Fujiwara (2005) shows that the Bank of Japan influences private forecasters while the opposite is not true. Ehrmann, Eijffinger and Fratzscher (2009) analyse whether central bank transparency reduces dispersion in private forecasts. Both analyses focus on the dispersion of forecasts. In related analyses, Levin, Natalucci and Piger (2004), Gürkaynak, Levin and Swanson (2010), Jansen and De Haan (2007), Cecchetti and Hakkio (2009) and Capistran and Ramos-Francia (2010) assess the effect of increased central bank communication and transparency on private expectations. Crowe (2010) evidences that inflation targeting adoption leads to better private forecasts. The contribution of this paper to the literature is to provide original evidence on the influence of FOMC forecasts on private ones. We examine whether FOMC inflation forecasts influence private ones and whether they may be considered as an instrument of monetary policy, using a structural VAR model with a recursive identification scheme. This method enables one to identify FOMC forecast shocks which would be independent of private inflation expectations, the Federal Reserve interest rate, inflation and real GDP. In addition, it enables one to assess the dynamics of such a shock in contrast to an event-study or a simple regression that would provide only a 1-period effect. Indeed, we are not
only interested in the immediate influence effect but also in the dynamics of influence to
characterize whether FOMC forecasts might be considered as a policy instrument. We therefore use the Survey of Professional Forecasters (SPF) as a measure of private forecasts, and we add it and FOMC forecasts to a standard monetary VAR with real GDP, inflation and the Fed rate. We also test an alternative VAR model with SPF and FOMC forecasts, the Fed rate, the 10-year Treasury yields and the US 3-month LIBOR rate. The monetary policy communication shock is identified by assuming that policymakers immediately observe the Fed rate, long- and short-term interest rates, inflation and real GDP. This is done to identify the monetary policy communication shock from other types of shocks, such as a monetary policy action shock, a supply shock and a demand shock. Estimates are robust to various alternative model and estimation specifications, as well as to different data and samples.
Our first set of results shows that an exogenous increase in FOMC forecasts produces a significant and persistent effect on private forecasts. They respond, as expected, positively on impact and proportionally less than the increase in FOMC forecasts. The maximum effect happens after four semesters while the forecasting horizon is shorter, and this suggests that it does not stem from forecasting accuracy but from some signaling content, i.e. information on the future policy path. Granger-causality Wald tests and a simple regression including the residual component of FOMC forecasts confirm this effect. The second set of estimates provides evidence that first, the effects of both FOMC forecasts and Fed rate shocks are different. In particular, FOMC forecasts have a positive and deferred impact on private forecasts, short- and long-term interest rates. Second, Fed rate shocks have the same effect whether considering FOMC forecasts or not. This suggests that the publication of FOMC forecasts does not change the effects of monetary action shocks and that FOMC forecasts are not a way of enhancing standard policy actions. Third, FOMC forecasts give information on the future Fed rate movements. This effect might be interpreted as a part of the policy signal content of the FOMC forecasts. Finally, responses of both FOMC forecasts and the Fed rate to macro shocks are differentiated: Fed rate responses are large and prompt, compared to those of FOMC forecasts.
Hence, a possible interpretation of this statistical evidence may be that FOMC forecasts work as an instrument of monetary policymaking. In part because of the signals on the future “appropriate monetary policy” scenario underlying FOMC forecasts, they influence private expectations. However, because the effects of FOMC forecasts shocks are differentiated from Fed rate shocks, one may suppose that FOMC forecasts do not only contain signals on future Fed rate decisions, but are also an instrument which enables one to impact policy variables in an other way. The fact that FOMC forecasts do not modify the effects of Fed rate shocks supports this view. Moreover, it is particularly interesting to note that FOMC forecasts and the Fed rate do not respond in the same way to macro shocks. These outcomes suggest that FOMC forecasts
may be an instrument a priori, designed to implement policy about the long-run trend, whereas
the Fed rate is more an instrument a posteriori responding to short-run cycles.
By contrast with Fed actions (through the federal funds rate, reserve requirements, the Term
Deposit Facility –TDF– or the Term Asset-Backed Securities Loan Facility –TALF–) which have a
mechanical effect on their respective policy-objective variables, the effects of the communication
instrument are not restrictive and would go through the credibility of the central bank. The channel of transmission of communication is not binding and this is the fundamental difference with actions. If some announcement is credible, it might not need action to be effective: a credible communication may result in changes in private expectations and private decisions which make future central bank action unnecessary, or which at least require smaller action than needed without communication. Central bank forecasts appear to be an instrument without having the mechanical and binding effects of the Fed rate, the main policy instrument. The statistical results presented in this paper do not establish that this interpretation is right, however evidence of the influence of FOMC forecasts on private ones as well as their effect on some policy variables and their response to macro shocks in contrast to the Fed rate support the hypothesis that central bank forecasts may be an instrument of monetary policy.
This outcome would have some policy implications for central bankers. They may use their forecasts as an instrument of monetary policy, in addition to and complementarily with the central bank interest rate. This would give another string to policymakers’ bow when pursuing
multiple objectives, and especially when the interest rate is at the zero lower bound and policymakers need another instrument to take over.
The rest of the paper is organized as follows. Section 2 presents the data and section 3 details the structural VAR model used. In sections 4 and 5, we respectively ask whether FOMC forecasts influence private ones and whether FOMC forecasts may be considered as an instrument of monetary policy. Section 6 concludes this paper.
2. Data
Since 1979, the Federal Reserve has reported forecasts for key macroeconomic variables –
inflation, real growth, and unemployment – twice each year1 in the Monetary Policy Report to
the Congress. It contains two ranges encompassing the forecasts of each individual member of the Federal Open Market Committee (FOMC): the “full range” includes the highest and the lowest forecasts while the “central tendency” removes the three highest and three lowest forecasts. The standard approach in the literature is to consider the midpoint of those ranges to characterize the FOMC forecast. As a benchmark for this analysis, we use the midpoint of the central tendency following the result by McCracken (2010) for inflation and provide sensitivity tests with the midpoint of the full range. FOMC inflation forecasts are published each year in February and July, and are made of fourth quarter over fourth quarter growth rates. Those of February are for the current year and those of July are for both the current year and the next year. For sake of consistency of the sample and for comparison purpose with SPF forecasts, the focus is on the current year forecasts. Finally, it has to be noted that the variables forecasted have changed over time. Different measures of inflation have been forecasted by the policymakers: the implicit GNP price deflator until the end of July 1988, the CPI between February 1989 and July 1999, the chain-type price index for personal consumption expenditures (PCE) between February 2000 and February 2004, and the core PCE since then. Finally, it is worth noting that these forecasts are conditioned on FOMC members’ assessment of “appropriate monetary policy” which corresponds to the future interest rate path that best satisfies the Fed's dual objectives of maximum employment and price stability.
The Survey of Professional Forecasters (SPF) was first compiled by the American Statistical Association and the National Bureau of Economic Research since 1968, and then it has been published by the Federal Reserve Bank of Philadelphia. Surveys are sent to panelists at the end of the first month of the quarter, the deadline for submission is the second week of the second month of the quarter and at the end, forecasts are published between middle to late February, May, August, and November. They are annualized quarter-over-quarter growth rates for the current quarter and the next four quarters for the GDP price index; a fourth-quarter-over-fourth-quarter forecast is then constructed to match FOMC data. Consumer price index (CPI) and core PCE forecasts are already provided on the basis of fourth-quarter-over-fourth-quarter percent changes. Finally, we consider the median of the individual responses as the SPF forecast.
One issue arises when matching these data sets. The exact variables forecasted to capture inflation have changed over time and are not necessarily available at the same date for the two actors. Indeed, SPF has only started to forecast core PCE in 2007 and never forecasted PCE.
There is therefore no exact match between 2000 and 2006. Our benchmark approach is to continue to consider CPI forecasts during this period until SPF starts forecasting core PCE. We assess the robustness of this choice first by using the GDP deflator forecasts during the period of mismatch and second by focusing on a sub-sample ending in 2000 for which the match is perfect. Figure 1 shows the different measures of inflation forecasted and documents that there is no jump when variables change. Besides, Gavin and Pande (2008) note that there is no difference in the accuracy of FOMC inflation forecasts when variables change.
The actual variables considered here come from the Real-Time Data Set of the Federal Reserve Bank of Philadelphia. We use the second release data, which are the vintage data published the next quarter. Since FOMC forecasts are released to the public only twice a year, the frequency of the overall dataset is biannual. Because these actual data are not in biannual frequency, we face a dilemma: we can use the value of the month or quarter corresponding to the publication of forecasts, or use the average of the 6 months (in our case, Q4 and Q1 for February forecasts, and Q2 and Q3 for the July/August forecasts). Both solutions have advantages and drawbacks. The first one respects the timing of information publication but do not take into account some information in each semester, whereas the second one considers all information of the semester by averaging it but do not correspond to the information set at the time of the publication. We decide to focus on the first method and provide robustness tests for the second one. We
therefore consider the first and third quarters for real GDP and inflation2 (i.e. GNP/GDP price
deflator, CPI and core PCE) and the values of February and August for the Federal funds target rate, the US 3-month LIBOR rate and the 10-year Treasury bonds rate to match the schedule of publication of FOMC forecasts. Real GDP and inflation are included in the analysis as year-over-year growth rates as for SPF and FOMC forecasts. In addition, we also consider final data obtained from FRED database for these variables. The overall biannual data set thus starts in 1979.2, ends in 2010.2, and comprises 63 observations.
3. Structural VAR Model
In order to assess first whether FOMC forecasts influence SPF ones and second whether FOMC forecasts are an additional instrument of monetary policy, we use a structural VAR model for decomposing FOMC forecasts into mutually orthogonal components with a structural economic interpretation. The methodology consists of augmenting a standard VAR for monetary policy analysis including real GDP growth, inflation and the central bank interest rate with FOMC and SPF forecasts. Initially, the objective is to identify an exogenous shock on the FOMC forecast which might be interpreted as a signal sent by the FOMC policymakers and to assess its effect on SPF forecasts. Second, the objective is to assess the effect of FOMC forecasts on the final objective variables of monetary policy – inflation and real GDP – and on some intermediate targets – short- and long-term interest rates – and to characterize the interaction of the action instrument: the Fed rate with the communication tool: the FOMC forecast.
Let Zt represent the (k x 1) vector that contains our k variables of interest at date t. In the
benchmark specification, Zt = [Real GDP, Inflation, SPF, Fed rate, FOMC]’. The regression of Zt
on its own lags p produces the reduced-form VAR errors et:
β = =
p + t i t-i t i 1 Z Z eIn that case, the reduced-form errors comprise the contemporaneous effects of each variable on the others and therefore combine the exogenous innovation of a given variable to the contemporaneous responses to the other variables. The identification of exogenous innovations to both monetary policy variables goes through the following relation between the reduced-form errors and the exogenous innovation, called the structural errors:
real GDP real GDP
11
t t
inf lation inf lation
21 22 t t SPF SPF 31 32 33 t t t Fedrate Fedrate 41 42 43 44 t t FOMC FOMC 51 52 53 54 55 t t a 0 0 0 0 e a a 0 0 0 e a a a 0 0 e e a a a a 0 e a a a a a e ε ε ε ε ε = =
The recursive identification assumption postulates that the structural errors are independent and that A is lower triangular. This means that the covariance between the reduced-form errors
is attributed to the structural error of the variable ordered previously in the vector Zt. Thus, the
structural error is uncorrelated by construction to the reduced-form errors of the preceding variables.
The recursive identification assumption depends on the ordering of the variables in the vector
Zt. Thus, shifts in the real GDP, inflation, SPF forecasts or the Fed rate result in a
contemporaneous change in the FOMC forecasts. At the opposite, real GDP is assumed not to respond to shocks in the other variables instantaneously. This restriction seems plausible as the transmission lags to the real economy are slow. Usually, the literature ranks the monetary policy instrument last in the vector of variables. We thus assume that both potential instruments react to other variables contemporaneously. Concerning the relative position of FOMC forecasts and the Fed rate, we suppose that if there is an exogenous shock on the Fed rate, FOMC forecasts would react contemporaneously as policy decisions are set according to FOMC forecasts. This implies that the Fed rate would respond with a lag to an exogenous shock to FOMC forecasts. Two arguments may support this hypothesis: first, the Fed rate exhibits a strong inertia, and second, policymakers often communicate on their future policy decisions and prepare market participants. Finally, we suppose SPF forecasts respond with a lag to both instruments, but contemporaneously to changes in inflation and real GDP. The fact that surveys take time to be collected from panellists and aggregated is a first argument in that direction. A second one refers to Coibion and Gorodnichenko (2008, 2010) and Andrade and LeBihan (2010) who document that private forecasters are subject to rational inattention and sticky information. This implies that the Fed reacts contemporaneously to private expectations and is consistent with the fact that it continuously gathers information on private expectations through surveys or financial markets. This benchmark ordering seems to be the most relevant one. However, in order to test the sensitivity of the results and the contribution of these assumptions to them, several orderings are tested and compared.
In addition to this benchmark VAR with final objectives variables, we test an alternative VAR model with two intermediate targets instead of inflation and real GDP. We introduce the US 3-month LIBOR rate and the 10-year Treasury bonds rate. The benchmark ordering for this alternative VAR is [SPF, 10y rate, LIBOR rate, Fed rate, FOMC]. We assume that all 3 interest
rates and the FOMC forecast respond contemporaneously to changes in the SPF forecasts. Once again, in order to assess the robustness of our estimations, we proceed to various orderings.
Table 1 lists all orderings tested3.
The structural VAR analysis is performed with 2 lags. The final prediction error (FPE) and the Akaike information criterion (AIC) suggest 2 lags, while the Schwarz Bayesian information criterion (SBIC) and the Hannan and Quinn information criterion (HQIC) propose 1 lag. The validity of benchmark estimates is therefore tested with 1 lag. We also checked the eigenvalue stability condition of our VAR estimates, since impulse–response functions and forecast-error variance decompositions require the VAR to be stable to be interpreted. In the present case, all the eigenvalues lie inside the unit circle, so our VAR satisfies the stability condition.
4. Do FOMC forecasts influence SPF forecasts?
The purpose of this section is to assess whether FOMC forecasts influence SPF ones. Using our benchmark VAR model, we test the hypothesis that a FOMC forecast shock has an effect on private forecasts. One step further is to test whether an increase of FOMC forecast yields to an increase in SPF forecasts with an elasticity inferior to one. Indeed, a decrease of SPF forecasts after a positive FOMC forecasts shock would imply that the Fed is exceptionally credible and policy actions are not necessary, and hence seems not realistic; or that the Fed is not credible at all. At the opposite, an increase of SPF forecasts superior to the increase of FOMC forecasts would imply that the Fed has a low credibility for stabilizing inflation, would render its task more difficult, and would not justify that it publishes its forecasts.
Figure 2 plots the impulse response of SPF forecasts to a FOMC forecast one standard deviation (S.D.) innovation. It causes a significant increase in SPF forecasts with a maximum magnitude of 0.17 percentage point after three and four semesters. In more general economic terms, it corresponds to a 0.68 percentage point increase in SPF forecasts after a 1-percentage point increase in FOMC forecasts. This result suggests that the FOMC forecasts have some influential power on SPF forecasts, and this estimate of influence is consistent with monetary theory and practice since the elasticity is inferior to one. The fact that this effect happens after four semesters, so after the forecasting horizon, also suggests that the device at work is not linked to the forecast accuracy. Interestingly, this horizon corresponds to the delays of transmission of monetary policy and would suggest that the influencing ability might be due to some signaling effect, in part on the future “appropriate monetary policy” and so the future interest rate path. Table 2 contains the variance decomposition result of SPF forecasts in order to distinguish the contribution of the FOMC forecast shock to the total variance of private forecasts. It follows that the communication shock has an effect on SPF of 10.2 percent, while past SPF and inflation explain respectively 51.2 and 29 percent of the variance of SPF. We also observe that the Fed rate shock has no effect on SPF forecasts (0.7 percent).
Table 3 presents Granger-causality Wald tests between SPF and FOMC forecasts. The Wald test investigates whether the coefficients on the two lags of FOMC forecasts which appear in the SPF equation are jointly zero. The null hypothesis that FOMC forecasts do not Granger-cause SPF
forecasts is strongly rejected. At the opposite, the null hypothesis that SPF forecasts do not Granger-cause FOMC forecasts cannot be rejected. Given the strong correlation between these two series of forecasts, the fact that FOMC forecasts are strongly significant to determine SPF forecasts whereas the opposite is not true is very striking. This evidence suggests that FOMC forecasts influence SPF ones, but that SPF ones do not influence FOMC ones.
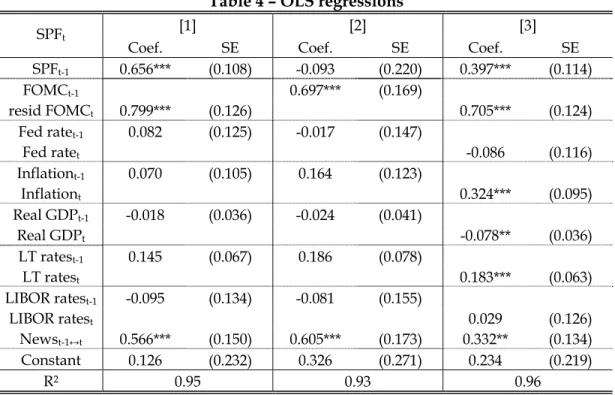
Table 4 provides another complementary set of estimates. FOMC forecasts are regressed on one lag of the SPF forecast, the Fed rate, the inflation rate, real GDP, the long-term rate, the LIBOR
rate, the FOMC forecasts and a variable comprising the set of macroeconomic news4 released
between t and t-1. The residuals which one might reasonably assume that they represent a series
of FOMC forecast shocks is then used along with the above-included regressors to determine SPF forecasts. Estimates show that the FOMC forecasts or their residual component are always very significant in determining SPF forecasts regardless of the timing assumptions considered.
Sensitivity Analysis
The approach to estimate the effect of FOMC forecasts structural shocks on SPF relies on restrictions and hypotheses that seem reasonable, but requires assessing whether the main result holds with different hypotheses. We thus provide information on the robustness of this result. Two series of tests are conducted related to model and estimation specifications, and to the data. Concerning the estimation procedure, the first test consists of providing the impulse responses of SPF forecasts to a FOMC forecast shock with different orderings than the benchmark one (see Figure 3.1). The same exercise is done for the contribution of FOMC forecasts to the variance decomposition of SPF forecasts (Table 2). As a second test, we estimate a reduced-form VAR
with the same variables in the vector Zt and plot the equivalent impulse response (Figure 3.2).
Indeed, imposing some restrictions on the structure of the error variance-covariance matrix enables one to make a causal interpretation of the results. However, estimating a reduced-form VAR allows data to speak without questionable assumptions. Third, the impact of the number of lags is evaluated (Figure 3.3). Finally, because the number of observations may be considered small, the variance-covariance matrix is estimated with a small-sample degrees-of-freedom
adjustment: the small-sample divisor used is 1/(T-m) instead of the maximum likelihood divisor
1/T, T being the sample size and m the average number of parameters in each of the equations
(Figure 3.4). It is also worth noting that since small samples produce greater standard errors, the related potential bias would go against the hypothesis that FOMC forecasts influence private ones. Significant estimates would therefore be all the more so convincing.
Concerning the data, the first test consists of replacing the midpoint of the central tendency by the midpoint of the full range as the FOMC forecast and plotting the impulse response of SPF forecasts following a FOMC forecast shock (Figure 4.1). We then estimate the benchmark VAR with the SPF forecasts of the GDP price deflator rather than those of the CPI during the period of time when there is a mismatch between SPF and FOMC forecasts. We also estimate the benchmark VAR on a subsample ending in 2000 (Figure 4.2). We then test whether FOMC forecasts still influence SPF forecasts when using real GDP forecasts (Figure 4.3). We also consider the use of final data rather than real-time data for inflation and real GDP, and finally,
4 Following the news and announcement literature (see Andersen et al. 2003), we construct the news variable by
replace the value of the specific month or quarter considered for each semester by the average of the whole semester data (Figure 4.4).
All the tests5 performed confirm the robustness of the baseline result that FOMC forecasts
influence SPF ones and even reinforce the scope of this baseline result, to the extent that the baseline result appears to be the lower bound of the range of estimates. The response of SPF forecasts to a FOMC forecast shock is either similar or superior to the baseline result. Interestingly, the effects when considering the midpoint of the full range or the midpoint of the central tendency are alike while McCracken (2010) documents that full range inflation forecasts are subject to strategic behaviour by the individual FOMC members and so to some noise. Their lower accuracy does not mean that they do not influence private forecasts.
Discussion
It appears that FOMC forecasts are able to influence private forecasts. The positive and less than proportional effect on private expectations suggests that the quantitative communication policy of the FOMC is not irrational and enables it to shape private expectations. Two possible sources of this influence are that first, central bank forecasts may have lower forecast errors than private ones and are therefore used by private agents to produce more accurate forecasts of the future economic outlook; second, central bank forecasts may convey signals: on policymakers’ preferences or objectives, on their private information on the long-run equilibrium trend or the potential of the economy, on their future “appropriate monetary policy” decisions or strategies. Romer and Romer (2008) and Gavin and Pande (2008) shed some light on this issue, and show that FOMC forecasts have no useful predictive power and are not more accurate than private forecasts. These results support the second source of influence: the signals content of FOMC forecasts. In addition, it is worth noting that two interpretations of the positive but less than proportional coefficient are possible: the Fed may expect an increase in inflation and communicates on it. If the Fed is credible, private agents will expect a rise in the Fed rate and then forecast a smaller than communicated increase in inflation. The Fed would have succeeded to prevent a part of the increase of inflation by communicating on it. At the opposite, one may argue that the Fed creates self-fulfilling prophecies by communicating on inflation. By influencing private expectations which are the main determinants of future realized inflation, the Fed somewhat set in part the future inflation rate. Signaling may therefore be interpreted in two different ways. To conclude this section, regardless of the source of this influence of central bank forecasts on private expectations and of the potential use made by policymakers of their forecasts, estimates provide empirical support for the wide theoretical literature which states that monetary policy is about managing private expectations.
5. Are FOMC forecasts an instrument of monetary policy?
The second question of this paper follows from the evidence of the preceding section and of Romer and Romer (2008) and Gavin and Pande (2008). Since FOMC forecasts influence SPF ones and FOMC forecasts are not more accurate, one natural hypothesis is to suppose that FOMC forecasts are influential because of some signal content. A further step is then to assess whether
5 We also assessed the robustness of the Granger-causality Wald tests with similar robustness tests (see Table 3) and
added a test in which we deliberately put FOMC forecasts in a situation of timing disadvantage by considering only the forecasts of the third quarter which are published in July (FOMC) and August (SPF).
the publication of central bank forecasts may be considered as an instrument of monetary
policy6. In other words, how do policy signals work? What are the effects of FOMC forecasts on
policy variables? How do FOMC forecasts interact with the main instrument of the Fed?
In order to shed light on these questions, we assess whether central bank forecasts are an improved means of implementing standard policy actions or another instrument of monetary
policy. We consider four hypotheses: (a) a FOMC forecast shock has the same effects than a Fed
rate shock, (b) the introduction of FOMC forecasts modifies the effects of a Fed rate shock, (c) a
Fed rate shock has an impact on FOMC forecasts and vice-versa, and (d) the Fed rate and FOMC
forecasts respond to exogenous macroeconomic shocks in the same way.
We start with the hypothesis (a) and assess whether a FOMC forecast shock has differentiated
effects on intermediate targets and objective variables. Figure 5 plots the impulse response of inflation, real GDP and SPF forecasts to both Fed rate and FOMC forecast shocks based on the benchmark VAR specification. There are two differences between both monetary shocks: for inflation and SPF forecasts. The “price puzzle” – the fact that inflation increases in response to a monetary contraction in a simple VAR – disappears while the FOMC forecast shock has a positive effect on inflation of 0.20 percentage point, which corresponds to an increase of 0.80 percentage point after a 1-percentage point increase in FOMC forecasts. In the same time, the Fed rate shock has no effect on SPF forecasts while the FOMC forecast shock has an impact of 0.17 percentage point after four periods (as seen in the preceding section).
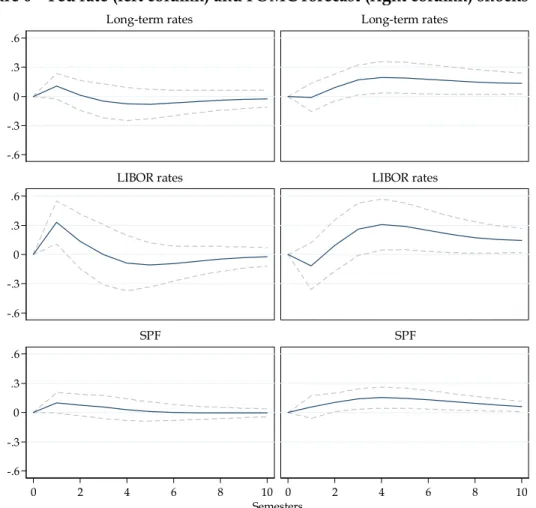
Figure 6 plots the impulse response of long-term (10-year Treasury bonds) and short-term (US 3-month LIBOR) interest rates and SPF forecasts to both Fed rate and FOMC forecast shocks based on the alternative VAR model. The Fed rate shock has no impact on long-term rates and SPF forecasts while the FOMC forecast shock increases long-term rates by 0.2 percentage point (0.8 after a percentage point shock) and SPF forecasts by 0.15 percentage point (0.60 after a 1-percentage point shock) after four periods. The response of the LIBOR rates is even more interesting: the Fed rate has a positive effect of 0.33 percentage point (0.92 percentage point after a 1-percentage point increase in the Fed rate) only the period next to the shock while the FOMC forecast shock has an effect of 0.31 percentage point (1.24 percentage point after a 1-percentage point increase in FOMC forecasts) but after 4 to 5 periods. It is particularly striking to note that FOMC forecasts produce such a deferred impact which is another distinction with the Fed rate. Table 5 contains the contribution of both policy tools to the variance decomposition of all three policy variables for both the objective variables VAR and the intermediate targets VAR. It follows that the communication shock has a higher effect on SPF forecasts than the monetary action shock: 10.2 versus 0.7 percent and 8.1 versus 2.4 percent for respectively both VARs.
Concerning the hypothesis (b), figures 7 and 8 show respectively the responses of inflation, real
GDP and SPF forecasts, and long-term and short-term rates and SPF forecasts to a Fed rate shock when including or excluding the FOMC forecasts from the VAR. If the FOMC forecasts were an improving means to implement the usual policy actions, to the extent that it makes those policy actions more effective, including the FOMC forecasts in the VAR should make the responses of
6 This question is close but differs from the one of Ellison and Sargent (2010). Their analysis proposes to reconcile the
fact that FOMC policymakers can be bad forecasters and good policymakers. In the present paper, we abstract from the question of the forecasting performance and assess whether FOMC forecasts may be used for policymaking.
objective variables, intermediate targets and private expectations different and would then provide an estimate of the effect of policymakers’ forecasts to enhance policy actions. The evidence points out that the introduction of FOMC forecasts does not produce differentiated effects of a Fed rate shock, and suggests that publishing FOMC forecasts is not an enhanced way to implement monetary policy. It rather supports the view that publishing FOMC forecasts strives to another objective and that they may act as a different policy instrument.
Figure 9 deals with the hypothesis (c) and plots the response of FOMC forecasts and the Fed rate
to a Fed rate and a FOMC forecast shock using the benchmark and the alternative VARs. If each monetary instrument responds by a one-to-one variation to an innovation in the other one, both instruments may be considered as perfectly dependant. At the extreme opposite, they may be considered as independent. Between both, some cross-effect of one on the other would evidence some complementary between these two instruments. It appears that FOMC forecasts react only during 1 period to a Fed rate shock and seem independent afterwards, whereas a FOMC forecast shock calls for an increase of the Fed rate 0.34 percentage point (1.36 percentage point after a 1-percentage point innovation in FOMC forecasts) around 4 to 6 periods ahead. This effect might be interpreted as a part of the policy signal content of FOMC forecasts and would be consistent with the argument that policymakers reveal in part the future “appropriate monetary policy” when publishing the FOMC forecasts.
Concerning the hypothesis (d), figures 10 and 11 plot the Fed rate and FOMC forecasts responses
to innovations in respectively inflation, real GDP and SPF forecasts, and long-term rates, LIBOR rates and SPF forecasts. As expected, an increase in inflation, real GDP or inflation expectations leads to a monetary contraction. The general pattern of these estimates is that both variables do not respond the same way: Fed rate responses are large and prompt, compared to those of FOMC forecasts.
Table 6 presents the variance decomposition of both instruments. Based on the objective variables VAR, real GDP and SPF forecasts account for respectively 41 and 9 percent of the variance of the Fed rate, while SPF forecasts and inflation account for respectively 37 and 16 percent of the variance of the FOMC forecasts. Using the intermediate targets VAR, SPF forecasts, long-term and short-term rates account for respectively 30, 15 and 39 percent of the variance of the Fed rate, while the SPF forecasts account for 61 percent of the variance of the FOMC forecasts. Whereas the effect of Fed rate shocks on the macroeconomic variables is small, the policy interest rate variations result from these variables. FOMC forecasts are mainly driven by inflation and inflation expectations.
Sensitivity Analysis
The robustness of the preceding results is assessed with the same tests than those employed in the preceding section. Estimates are presented in the Appendix. Figures A.1 to A.3, respectively for the objective variable VAR, the intermediate targets VAR and the cross-effects of instruments, assess the sensitivity of the baseline results to various orderings. Figures A.4 to A.6 focus on the comparison of responses obtained with structural and reduced-form VARs. Figures A.7 to A.9 plot the responses stemming from the VAR specifications with 1 lag only. Figures A.10 to A.12 are drawn based on the use of a small-sample estimator. Figures A.13 to A.15 show the different responses when considering the midpoint of the full range rather than of the central tendency for the FOMC forecasts. Figures A.16 to A.18 make use of real GDP forecasts of
both FOMC and SPF. Figure A.19 is built with final data for real GDP and inflation. Figures A.20
to A.22 provide estimates with semester average data.7
All those tests provide confirmations that the baseline estimates are robust, except for the use of the midpoint of the full range of individual FOMC members’ forecasts for which evidence is sometimes smaller. This may be explained by the strategic behavior of the individual FOMC members as explained by McCracken (2010) or Tillmann (2011). Policymakers with extreme preferences will construct their forecasts to drive the preferred policy that they would like to see implemented. This is why removing the highest three and lowest three forecasts constitutes a forecast more representative of the consensus of the individual FOMC members. It suggests that FOMC forecasts may be more effective as an instrument of monetary policy when they are not subject to strategic considerations between individual FOMC members, but represent the consensus on the policy that will be implemented. An additional comment emerges for real GDP forecasts: it is interesting to note that FOMC forecasts still influence SPF forecasts and macro variables, and that a positive shock on FOMC forecasts leads in the next two periods to a decrease of the Fed rate. Once again, FOMC forecasts seem to convey a signal on the future “appropriate monetary policy” and how to interpret the increase in FOMC forecasts.
Discussion
The estimates from the four tests suggest that FOMC forecasts may be considered as an instrument of monetary policymaking. First, it appears that action and communication produce different effects: FOMC forecasts impact private forecasts, short- and long-term interest rates. This result is consistent with Gürkaynak, Sack and Swanson (2005). They show that a large portion of variation in long-term yields is due to FOMC communication rather Fed rate changes. Moreover, the effects of FOMC forecasts are deferred compared to the Fed rate. FOMC forecasts might therefore be used by policymakers to reach different objectives and follow a different strategy. Second, it seems that the publication of FOMC forecasts is not an improved way of implementing policy actions. The fact that the effects of a Fed rate shock are not modified by the disclosure of FOMC forecasts suggests that the communication of central bank forecasts has its own rationale. Third, it appears that FOMC forecasts give information on future Fed rate movements and the future “appropriate monetary policy”, and this may be interpreted as a part of the signal content of the FOMC forecasts. This is consistent with previous studies. Gürkaynak, Sack and Swanson (2005) find that FOMC statements are closely associated with the future path of policy decisions in contrast to the current Fed rate. Swanson (2006) shows that US financial markets and private forecasters have a better picture of the future Fed rate and have become less surprised by Fed decisions since the FOMC enhanced its communication policy, while Orphanides and Wieland (2008) evidence that Fed rate decisions can be explained by FOMC
forecasts8. Thus, FOMC forecasts might be seen as an instrument to signal future policy
decisions or policymakers’ preferences. Fourth, responses of both the Fed rate and FOMC forecasts to macro shocks are different: the Fed rate responds promptly and with more
magnitude. This suggest that whereas FOMC forecasts are a instrument a priori designed to
implement policy about the long-run trend, the Fed rate is more an instrument a posteriori
7 Robustness analyses are not provided in the Appendix for the following tests: Including/Excluding FOMC forecasts
and Responses to macro shocks. These tests are in line with the other robustness tests and confirm the baseline results. They are available from the author upon request.
8 Hayo and Neuenkirch (2010) find a similar result with a communication indicator encompassing speeches of Fed’s
responding to short-run cycles. This is consistent with the deferred impact of FOMC forecasts and the signal on future Fed rate decisions. All in all, it appears that FOMC forecasts are able to shape private expectations, to impact policy variables and to signal future policy actions; hence to conduct policy. It suggests that they may thus be considered as an instrument of monetary policy.
6. Conclusion
In this paper, we examine the value of the FOMC forecasts in two ways. We assess whether they influence private forecasts and whether they may be considered as an instrument of monetary policy. We provide original evidence that FOMC forecasts are able to influence private ones. The second set of estimates provides evidence that the effects of both FOMC forecasts and Fed rate shocks are differentiated. In particular, FOMC forecasts have a positive and deferred impact on private forecasts, short- and long-term interest rates. The publication of FOMC forecasts does not change the effects of Fed rate shocks and it suggests that FOMC forecasts do not enhance the implementation of standard policy actions. However, FOMC forecasts give information on the future Fed rate movements. Finally, responses of both FOMC forecasts and the Fed rate to macro shocks are differentiated: Fed rate responses are large and prompt.
Hence, a possible interpretation of this statistical evidence may be that FOMC forecasts work as an instrument of monetary policymaking. In part because of the signals on future Fed rate movements and the future “appropriate monetary policy”, FOMC forecasts influence the formation of private expectations. However, because the effects of FOMC forecasts shocks are different from Fed rate shocks, one may suppose that FOMC forecasts do not only contain signals on future Fed rate decisions, but are also a different policy instrument. The fact that FOMC forecasts do not modify the effects of Fed rate shocks and FOMC forecasts and the Fed rate respond differently to macro shocks supports this view. It suggests that FOMC forecasts are
an instrument a priori designed to implement policy about the long-run trend, whereas the Fed
rate is more an instrument a posteriori responding to short-run cycles. Based on the credibility of
the central bank, policymakers’ forecasts thus seem to be another instrument without owning the mechanical and binding effects of the Fed rate, the main instrument of monetary policy.
References
Amato, J. and H.S. Shin (2006), “Imperfect Common Knowledge and the Information Value of
Prices”, Economic Theory, 27(1), 213-241.
Andersen, T.G., T. Bollerslev, F.X. Diebold and C. Vega (2003), “Micro Effects of Macro
Announcements: Real-Time Price Discovery in Foreign Exchange”, American Economic
Review, 93(1), 38-62.
Andrade, P. and H. Le Bihan (2010), “Inattentive Professional Forecasters”, mimeo.
Baeriswyl, R. and C. Cornand (2010), "The Signaling Role of Policy Action", Journal of Monetary Economics, 57, 682-695.
Banternghansa, C. and M.W. McCracken (2009), “Forecast disagreement among FOMC
members”, Working Paper Federal Reserve Bank of St. Louis, n°2009-059A.
Bauer, A., R. Eisenbeis, D. Waggoner and T. Zha (2006), “Transparency, expectations and forecasts”, Federal Reserve Bank of Atlanta Working Paper 2006-3.
Bernanke, B. and M. Woodford (1997), “Inflation Forecasts and Monetary Policy”, Journal of Money, Credit and Banking, 29, 653-684.
Blinder, A., M. Ehrmann, M. Fratzscher, J. De Haan and D.-J. Jansen (2008), "Central Bank
Communication and Monetary Policy: A Survey of Theory and Evidence", Journal of
Economic Literature, 46(4), 910-45.
Boukus, E. and J. Rosenberg (2006), “The Information Content of FOMC Minutes”, Federal Reserve Bank of New York, Working Paper.
Capistrán, C. (2008), “Bias in Federal Reserve Inflation forecasts: is the Federal Reserve
irrational or just cautious?”, Journal of Monetary Economics, 55, 1415–1427.
Capistran, C. and M. Ramos-Francia (2010), “Does Inflation Targeting Affect the Dispersion of
Inflation Expectations?”, Journal of Money, Credit and Banking, 42(1), 113-134.
Cecchetti, S.G. and C. Hakkio (2009), “Inflation targeting and private sector forecasts”, NBER
WP No. 15424.
Chappell, H.W., R.R. McGregor and T.A. Vermilyea (2007), “The role of the bias in crafting
consensus: FOMC decision making in the Greenspan era”, International Journal of Central
Banking, 3, 39–60.
Coibion, O. and Y. Gorodnichenko (2008), “What can survey forecasts tell us about
informational rigidities?”, NBER Working Paper 14586.
Coibion, O. and Y. Gorodnichenko (2010), “Information Rigidity and the Expectations
Formation Process: A Simple Framework and New Facts”, NBER Working Paper 16537.
Crowe, C. (2010), “Testing the transparency benefits of inflation targeting: Evidence from
private sector forecasts”, Journal of Monetary Economics, 57, 226–232.
Ehrmann, M. and M. Fratzscher (2007), “Transparency, Disclosure, and the Federal Reserve”,
International Journal of Central Banking, 3(1), 179–225.
Ehrmann, M., S. Eijffinger and M. Fratzscher (2009), “The Role of Central Bank Transparency for Guiding Private Sector Forecasts”, CEPR Discussion Paper No 7585.
Ellison, M. and T.J. Sargent (2010), “A defence of the FOMC”, unpublished.
Farka, M. (2010), “The asymmetric impact of “informative” and “uninformative” Federal Open
Market Committee statements on asset prices”, Contemporary Economic Policy,
forthcoming.
Fujiwara, I. (2005), “Is the central bank’s publication of economic forecasts influential?”,
Economics Letters, 89, 255-261.
Gavin, W.T. (2003), “FOMC forecasts: is all the information in the central tendency?”, Federal Reserve Bank of St. Louis Review, 85, 27–46.
Gavin, W.T. and R.J. Mandal (2003), “Evaluating FOMC forecasts”, International Journal of Forecasting, 19, 655–667.
Gavin, W.T. and G. Pande (2008), “FOMC consensus forecasts”, Federal Reserve Bank of St. Louis Review, 90, 149–163.
Geraats, P.M. (2005), “Transparency and reputation: The publication of central bank forecasts”,
Topics in Macroeconomics, 5(1), 1–26.
Gürkaynak, R., A. Levin and E. Swanson (2010), ‘‘Does Inflation Targeting Anchor Long-Run
Inflation Expectations? Evidence from the U.S., U.K., and Sweden’’, Journal of the European
Economic Association, 8, 1208–1242.
Gürkaynak, R., B. Sack, and E. Swanson (2005), “Do Actions Speak Louder Than Words? The
Response of Asset Prices to Monetary Policy Actions and Statements”, International Journal
Hayo, B. and M. Neuenkirch (2010), “Do Federal Reserve communications help predict federal
funds target rate decisions?”, Journal of Macroeconomics, 32, 1014–1024.
Jansen, D.-J. and J. de Haan (2007),. “The Importance of Being Vigilant: Has ECB Communication Influenced Euro Area Inflation Expectations?”, CESifo WP No.2134.
King, M. (2005), “Monetary Policy: Practice Ahead of Theory”, Mais Lecture, Bank of England Quarterly Bulletin (Summer)
Kohn, D. and B. Sack (2004), “Central Bank Talk: Does It Matter and Why?”, Board of
Governors of the Federal Reserve System, Finance and Economics Discussion Series, 2003-55.
Levin, A., Natalucci, F., and Piger, J. (2004), “Explicit inflation objectives and macroeconomic outcomes”, European Central Bank Working Paper, N°383.
Lucca, D. and F. Trebbi (2009), “Measuring Central Bank Communication: An Automated
Approach with Application to FOMC Statements”, NBER Working Paper, n°15367.
McCracken, M.W. (2010), “Using FOMC forecasts to forecast the economy”, Economic Synopses, n°5, Federal Reserve Bank of St. Louis.
Meade, E.E. (2005), “The FOMC: preferences, voting, and consensus”, Federal Reserve Bank of St. Louis Review, 87, 93–101.
Meade, E.E. and D. Stasavage (2008), “Publicity of debate and the incentive to dissent: evidence
from the US Federal Reserve”, The Economic Journal, 118, 695–717.
Morris, S. and H.S. Shin (2002), “The Social Value of Public Information”, American Economic Review, 92, 1521-1534.
Muto, I. (2011), “Monetary Policy and Learning from the Central Bank’s Forecast”, Journal of Economic Dynamics and Control, 35(1), 52-66.
Orphanides, A. and V. Wieland (2008), “Economic projections and rules of thumb for monetary
policy”, Federal Reserve Bank of St. Louis Review, 90, 307–324.
Pakko, M.R. (2005), “On the Information Content of Asymmetric FOMC Policy Statements:
Evidence from a Taylor-Rule Perspective”, Economic Inquiry, 43(3), 558–69.
Romer, C.D. and D.H. Romer (2000), “Federal reserve information and the behavior of interest
rates”, American Economic Review, 90 (3), 429–457.
Romer, C.D. and D.H. Romer (2008), “The FOMC versus the staff: where can monetary
policymakers add value?”, American Economic Review: Papers & Proceedings, 98, 230–235.
Rosa, C. (2008), “Talking Less and Moving the Market More: Is This the Recipe for Monetary Policy Effectiveness? Evidence from the ECB and the Fed”, manuscript.
Swanson, E. (2006), “Have increases in Federal Reserve transparency improved private sector
interest rate forecasts”, Journal of Money, Credit and Banking, 38, 792-819.
Tillmann, P. (2010), "The Fed's Perceived Phillips Curve: Evidence from Individual FOMC
Forecasts", Journal of Macroeconomics, 32, 1008-1013.
Tillmann, P. (2011), "Strategic Forecasting on the FOMC", European Journal of Political Economy, forthcoming.
Walsh, C.E. (2007), “Optimal economic transparency”, International Journal of Central Banking, 3(1), 5–36.
Table 1 – Orderings used for the structural VAR model Benchmark VAR Model 2 Model 3 Model 4 Model 5 Model 6 Model 7 Alternative VAR Model 12 Model 13 Model 14 Model 15 Model 16 Model 17
[Real GDP, Inflation, SPF, Fed rate, FOMC] [Real GDP, Inflation, Fed rate, FOMC, SPF] [Real GDP, Inflation, Fed rate, SPF, FOMC] [Real GDP, Inflation, FOMC, Fed rate, SPF] [Real GDP, Inflation, FOMC, SPF, Fed rate] [Real GDP, Inflation, SPF, FOMC, Fed rate]
[Fed rate, SPF, FOMC]
[SPF, 10y rate, LIBOR rate, Fed rate, FOMC] [SPF, 10y rate, LIBOR rate, FOMC, Fed rate] [10y rate, LIBOR rate, SPF, Fed rate, FOMC] [10y rate, LIBOR rate, SPF, FOMC, Fed rate] [10y rate, LIBOR rate, FOMC, SPF, Fed rate] [10y rate, LIBOR rate, Fed rate, SPF, FOMC] [10y rate, LIBOR rate, Fed rate, FOMC, SPF]
Table 2 – Variance Decomposition of SPF
Benchmark VAR model
Contribution of: Real GDP Inflation SPF Fed rate FOMC
Average of 10 periods 0.090 0.290 0.512 0.007 0.102
Contribution of the FOMC Monetary Shock
Benchmark Model 2 Model 3 Model 4 Model 5 Model 6 Model 7
Average of 10 periods 0.102 0.474 0.102 0.416 0.416 0.063 0.100
Table 3 - Granger causality Wald tests – Benchmark VAR
Equation Variable chi2 df Prob > chi2
SPF FOMC 9.692 2 0.008 FOMC SPF 0.441 2 0.802
VAR with 1 lag
SPF FOMC 13.552 1 0.000 FOMC SPF 1.671 1 0.196
Small sample estimator
SPF FOMC 7.945 2 0.019 FOMC SPF 0.361 2 0.835
VAR with FOMC_FR
SPF FOMC 8.364 2 0.015 FOMC SPF 2.049 2 0.359
Only Q3: FOMC Timing Disad.
SPF FOMC 2.588 2 0.095 FOMC SPF 0.407 2 0.670
Table 4 – OLS regressions
[1] [2] [3] SPFt
Coef. SE Coef. SE Coef. SE
SPFt-1 0.656*** (0.108) -0.093 (0.220) 0.397*** (0.114) FOMCt-1 0.697*** (0.169) resid FOMCt 0.799*** (0.126) 0.705*** (0.124) Fed ratet-1 0.082 (0.125) -0.017 (0.147) Fed ratet -0.086 (0.116) Inflationt-1 0.070 (0.105) 0.164 (0.123) Inflationt 0.324*** (0.095) Real GDPt-1 -0.018 (0.036) -0.024 (0.041) Real GDPt -0.078** (0.036) LT ratest-1 0.145 (0.067) 0.186 (0.078) LT ratest 0.183*** (0.063) LIBOR ratest-1 -0.095 (0.134) -0.081 (0.155) LIBOR ratest 0.029 (0.126) Newst-1↔t 0.566*** (0.150) 0.605*** (0.173) 0.332** (0.134) Constant 0.126 (0.232) 0.326 (0.271) 0.234 (0.219) R2 0.95 0.93 0.96
***, **, * denote significance at the 10%, 5% and 1% levels. The variable resid FOMC corresponds to the residuals obtained from the regression of FOMC forecasts on one lag of the SPF forecast, the Fed rate, the inflation rate, real GDP, the long-term rate, the LIBOR rate, the FOMC forecasts and a variable comprising the set of macroeconomic news released between t and t-1.
Table 5 - Contribution of the FOMC and the Fed rate shocks
Variance decomposition of the Objectives variables
Real GDP Inflation SPF
FOMC Fed rate FOMC Fed rate FOMC Fed rate Average of 10 periods 0.011 0.009 0.043 0.026 0.102 0.007
Variance decomposition of the Intermediate targets
Long-term rates LIBOR rates SPF
FOMC Fed rate FOMC Fed rate FOMC Fed rate Average of 10 periods 0.052 0.013 0.046 0.031 0.081 0.024
Table 6 - Variance decomposition and Contribution of both Instruments
Objective VAR Real GDP Inflation SPF Fed rate FOMC
Variance of: FOMC Fed rate FOMC Fed rate FOMC Fed rate FOMC Fed rate FOMC Fed rate
Average of 10 periods 0.126 0.408 0.157 0.086 0.367 0.153 0.038 0.305 0.311 0.048
Targets VAR SPF Long-term rates LIBOR rates Fed rate FOMC
Variance of: FOMC Fed rate FOMC Fed rate FOMC Fed rate FOMC Fed rate FOMC Fed rate
Figure 1 – FOMC and SPF inflation forecasts 0 2 4 6 8 10 1979 1984 1989 1994 1999 2004 2009
SPF_PGDP SPF_CPI SPF_CorePCE FOMC_CT
Note: Forecasts are fourth-quarter-over-fourth-quarter growth rates. The y-axis is in percent. SPF_PGDP is the SPF forecast for the GDP price deflator, and FOMC_CT the mid-point of the central tendency of individual FOMC members’ forecasts.
Figure 2 – Response to a FOMC forecast shock
-.6 -.3 0 .3 .6 0 2 4 6 8 10 SPF Semesters
Note: Estimates based on the benchmark VAR. The dotted lines represent the 90% confidence intervals. The impulse response corresponds to the percentage point change in SPF forecasts, in response to a one-S.D. innovation in the FOMC forecast.
Figure 3 – Response of SPF forecasts to a FOMC forecast shock
3.1. Various orderings 3.2. Structural vs. Reduced-form VAR
-.6 -.3 0 .3 .6 0 2 4 6 8 10 Semesters SPF 0 .3 .6 .9 1.2 0 2 4 6 8 10 SPF Semesters
Note: Estimates based on the benchmark VAR and models 2-7. The dotted lines represent the 90% confidence intervals. The blue line is for benchmark VAR, maroon for model 2, green for model 3, orange for model 4, grey for model 5, red for model 6 and gold for model 7. The impulse response corresponds to the percentage point change in SPF forecasts, in response to a one-S.D. innovation in the FOMC forecast.
Note: Estimates based on the benchmark structural VAR (blue line). The dotted lines represent the 90% confidence intervals. The red line represents the SPF response based on the reduced-form VAR and the dash-dotted lines the associated 90% confidence intervals. The impulse response corresponds to the percentage point change in SPF forecasts, in response to a one-S.D. innovation in the FOMC forecast.
3.3. VAR with 1 lag 3.4. Small sample estimator
-.6 -.3 0 .3 .6 0 2 4 6 8 10 Semesters SPF -.6 -.3 0 .3 .6 0 2 4 6 8 10 Semesters SPF
Note: Estimates based on the benchmark VAR and models 2-7. The dotted lines represent the 90% confidence intervals. The blue line is for benchmark VAR, maroon for model 2, green for model 3, orange for model 4, grey for model 5, red for model 6 and gold for model 7. The impulse response corresponds to the percentage point change in SPF forecasts, in response to a one-S.D. innovation in the FOMC forecast.
Note: Estimates based on the benchmark VAR and models 2-7. The dotted lines represent the 90% confidence intervals. The blue line is for benchmark VAR, maroon for model 2, green for model 3, orange for model 4, grey for model 5, red for model 6 and gold for model 7. The impulse response corresponds to the percentage point change in SPF forecasts, in response to a one-S.D. innovation in the FOMC forecast.
Figure 4 – Response of SPF forecasts to a FOMC forecast shock 4.1. FOMC - Full Range 4.2. Alternative SPF forecasts
-.6 -.3 0 .3 .6 0 2 4 6 8 10 Semesters SPF -.6 -.3 0 .3 .6 0 2 4 6 8 10 Semesters SPF
Note: Estimates based on the benchmark VAR with the mid-point of the central tendency (blue line). The dotted lines represent the 90% confidence intervals. The red line represents the SPF response based on the benchmark VAR with the mid-point of the full range and the dash-dotted lines the associated 90% confidence intervals. The impulse response corresponds to the percentage point change in SPF forecasts, in response to a one-S.D. innovation in the FOMC forecast.
Note: Estimates based on the benchmark VAR with the SPF forecasts of the GDP price deflator rather than those of the CPI during 2000-2006 period (blue line). The dotted lines represent the 90% confidence intervals. The red line represents the SPF response based on the benchmark VAR ending in 2000 and the dash-dotted lines the associated 90% confidence intervals. The impulse response corresponds to the percentage point change in SPF forecasts, in response to a one-S.D. innovation in the FOMC forecast.
4.3. Real GDP forecasts 4.4. Final / Semester Average data
-.6 -.3 0 .3 .6 0 2 4 6 8 10 SPF forecast of real GDP Semesters -.6 -.3 0 .3 .6 0 2 4 6 8 10 Semesters SPF
Note: Estimates based on the benchmark VAR in which SPF and FOMC forecasts are for real GDP. The dotted lines represent the 90% confidence intervals. The impulse response corresponds to the percentage point change in SPF forecasts, in response to a one-S.D. innovation in the FOMC forecast.
Note: Estimates based on the benchmark VAR with final data for inflation and real GDP (solid blue line). The dashed lines represent the 90% confidence intervals. The long-dash-dotted red line represents the SPF response based on the benchmark VAR with semester average data, and the dash-dotted lines the associated 90% confidence intervals. The long-dashed grey line represents the SPF response based on the benchmark VAR. The impulse response corresponds to the percentage point change in SPF forecasts, in response to a one-S.D. innovation in the FOMC forecast.
Figure 5 – Fed rate (left column) and FOMC forecast (right column) shocks -.6 -.3 0 .3 .6 -.6 -.3 0 .3 .6 -.6 -.3 0 .3 .6 0 2 4 6 8 10 0 2 4 6 8 10 Inflation Real GDP SPF Inflation Real GDP SPF Semesters
Note: Estimates based on the benchmark VAR. The dotted lines represent the 90% confidence intervals. The impulse response corresponds to the percentage point change in inflation, real GDP and SPF forecasts, in response to a one-S.D. innovation in the Fed rate or the FOMC forecast.
Figure 6 – Fed rate (left column) and FOMC forecast (right column) shocks -.6 -.3 0 .3 .6 -.6 -.3 0 .3 .6 -.6 -.3 0 .3 .6 0 2 4 6 8 10 0 2 4 6 8 10 Long-term rates LIBOR rates SPF Long-term rates LIBOR rates SPF Semesters
Note: Estimates based on the alternative VAR with intermediate targets. The dotted lines represent the 90% confidence intervals. The impulse response corresponds to the percentage point change in long-term (10-year Treasury bonds) and short-term (US 3-month LIBOR) interest rates and SPF forecasts, in response to a one-S.D. innovation in the Fed rate or the FOMC forecast.
Figure 7 – Fed rate shock – Benchmark VAR
– Including (left column) or excluding (right column) FOMC forecasts
-.6 -.3 0 .3 .6 -.6 -.3 0 .3 .6 -.6 -.3 0 .3 .6 0 2 4 6 8 10 Inflation Real GDP SPF Semesters -.6 -.3 0 .3 .6 -.6 -.3 0 .3 .6 -.6 -.3 0 .3 .6 0 2 4 6 8 10 Inflation Real GDP SPF Semesters
Note: Estimates based on the benchmark VAR. The dotted lines represent the 90% confidence intervals. The impulse response corresponds to the percentage point change in inflation, real GDP and SPF forecasts, in response to a one-S.D. innovation in the Fed rate.
Figure 8 – Fed rate shock – Alternative benchmark VAR
– Including (left column) or excluding (right column) FOMC forecasts
-.6 -.3 0 .3 .6 -.6 -.3 0 .3 .6 -.6 -.3 0 .3 .6 0 2 4 6 8 10 Long-term rates LIBOR rates SPF Semesters -.6 -.3 0 .3 .6 -.6 -.3 0 .3 .6 -.6 -.3 0 .3 .6 0 2 4 6 8 10 Long-term rates LIBOR rates SPF Semesters
Note: Estimates based on the alternative VAR with intermediate targets. The dotted lines represent the 90% confidence intervals. The impulse response corresponds to the percentage point change in long-term (10-year Treasury bonds) and short-term (US 3-month LIBOR) interest rates and SPF forecasts, in response to a one-S.D. innovation in the Fed rate.
Figure 9 – Fed rate (left column) and FOMC forecast (right column) shocks -.6 -.3 0 .3 .6 0 2 4 6 8 10 FOMC -.6 -.3 0 .3 .6 0 2 4 6 8 10 Fed rate -.6 -.3 0 .3 .6 0 2 4 6 8 10 FOMC -.6 -.3 0 .3 .6 0 2 4 6 8 10 Fed rate
Note: The first line displays the responses of FOMC and Fed rate to both monetary shocks in the case of the benchmark VAR with inflation and real GDP. The second line displays the equivalent responses in the case of the alternative VAR with long-term rates and LIBOR. The dotted lines represent the 90% confidence intervals.