72
http://asrjetsjournal.org/
Arrhythmia Classification Algorithm Based on
Multi-Feature and Multi-type Optimized SVM
Hongqiang Li
a*, Xiaoqing Wei
b, Shasha Zuo
c, Qianzhi Dou
d, Mingjun Ding
e, Lu
Cao
f, Zheng Gong
g, Runjie Wang
h, Xuyi Chen
i, Binhua Wang
j, Joan Daniel
Prades
k, Feifan Wu
la,b,d,e,g,h,lTianjin Key Laboratory of Optoelectronic Detection Technology and Systems, School of Electronics and
Information Engineering, Tiangong University, Tianjin, 300387, China
cTianjin Textile Fiber Inspection Institute, Tianjin 300192, China fTianjin Chest Hospital, Tianjin 300051, China
iCharacteristic Medical Center of the Chinese People's Armed Police Force, Tianjin 300162, China jChinese People’s Liberation Army General Hospital, Beijing 100039, China
k
Departament of Electronics and Biomedical Engineering, Universitat de Barcelona, Barcelona E-08028, Spain
aEmail: [email protected], cEmail: [email protected], fEmail: [email protected] iEmail: [email protected], jEmail: [email protected], kEmail: [email protected]
Abstract
The electrocardiogram (ECG) signal feature extraction and classification diagnosis algorithm is proposed to address the high incidence of heart disease and difficulty in self-detection. First, the collected ECG signals are preprocessed to remove the noise of the ECG signals. Next, wavelet packet decomposition is used to perform a four-layer transformation on the denoised ECG signal and the 16 obtained wavelet packet coefficients analyzed statistically. Next, the slope threshold method is used to extract the R-peak of the denoised ECG signal. The RR interval can be calculated according to the extracted R peak. The extracted statistical features and time domain RR interval features are combined into a multi-domain feature space. Finally, the particle swarm optimization algorithm (PSO), genetic algorithm (GA), and grid search (GS) algorithms are applied to optimize the support vector machine (SVM). The optimized SVM is utilized to classify the extracted multi-domain features. Classification results show the proposed algorithm can classify six types of ECG beats accurately. The classification efficiency achieved by PSO, GA, and GS are 97.78%, 98.33%, and 98.89%, respectively.
Keywords: ECG signal; multi-domain feature; particle swarm optimization; genetic algorithm; grid search algorithm.
--- * Corresponding author.
73
1.Introduction
Cardiovascular disease, one of the diseases in humans with the highest morbidity and mortality, poses a serious threat to people's lives and health [1,2]. In recent years, sudden heart disease has become increasingly common, raising the need for a device that can monitor cardiac activity and reflect disease information in a timely manner. The wearable electrocardiogram (ECG) monitoring system [3, 4] can monitor the electrical activity of the heart intuitively, collect the waveform information of the human ECG signal, and provide feedback on the disease, which considerably reduces the damage caused by the sudden disease. Therefore, the automatic detection and classification of ECG signals has gradually become the focus of research.
In the study of automatic monitoring and classification of ECG signals, in addition to performing the necessary denoising processing, another important process is feature extraction and classification diagnosis. The reliability of the arrhythmia diagnosis results is ensured by extracting the characteristics of the ECG signal accurately and efficiently. At present, the commonly used methods for feature extraction of ECG signals include waveform morphology methods [5-7], transformation-based methods [8, 9], and statistical-based methods [10, 11]. Alvarado [12] extracted the time domain eigenvectors of ECG signals and classified arrhythmia through linear discriminant analysis classification model. Venkatesan and his colleagues [13] used the discrete wavelet coefficient feature as an ECG feature and applied the nearest neighbor classifier to classify the signal features with a classification accuracy of 97.5%. Charfi [14] and his colleagues obtained the ECG signal on wavelet transform, considere the wavelet coefficient as a feature vector, used the decision tree to classify the ECG signal, and achieved a classification accuracy of 96.87%. Martis and his colleagues [15] utilized the dual spectrum to extract the beyond mean and standard deviation of the ECG signal as statistical features. They used the least-squares support vector machine (SVM) to classify the five types of ECG signals with an accuracy of 93.48%.
Although extracting a single feature can classify ECG signals, ECG signals contain a large amount of complex information, and getting a single feature is insufficient to characterize its essence. Therefore, we propose a multi-domain feature extraction algorithm based on wavelet packet decomposition-statistical analysis [16] and slope threshold and employ particle swarm optimization (PSO), genetic (GA), and grid search (GS) algorithms to optimize the SVM [17]. The multi-domain features are classified, and the performance of the different optimization algorithms is compared and analyzed. The algorithm processes the ECG signal by lifting wavelet transform and improving the semi-soft threshold to remove the noise. The wavelet packet function is used to decompose the denoised ECG signal into four layers and 16 wavelet packet decomposition coefficients are obtained. The singular value, maximum value, and standard deviation of coefficients are calculated through the statistical analysis method to obtain a 48-dimensional frequency-domain feature space. The slope threshold method is applied to detect the R peak of the denoised ECG signal and obtain the RR interval. The first two RR intervals are extracted as time-domain features to form a two-dimensional time-domain feature space. The frequency-domain feature space and time domain are acquired to form a 50-dimensional multi-domain feature space. Finally, SVM is used to classify the multi-domain features of six ECG signals, and PSO, GA, and GS algorithms are used to optimize the parameters. The ECG data in the experiment are derived from the MIT-BIH arrhythmia database and PhysioNet’s Long-Term AF Database (LTAFDB). The ECG types can be classified as
74
normal ECG (N), sinus bradycardia (SBR), ventricular tachycardia (VT), premature ventricular contraction (PVC), premature atrial contraction (PAC), and atrial fibrillation (AF).
2.Methods
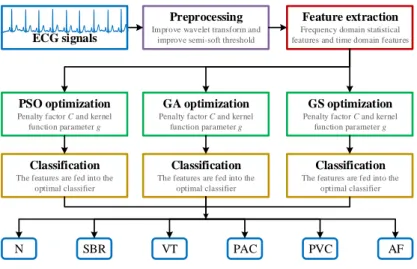
ECG signal processing includes preprocessing, feature extraction, and classification diagnosis [18]. Figure 1 shows the block diagram of the proposed processing method. The ECG signal is extracted from the database and preprocessed by lifting the wavelet transform and improving the semi-soft denoising method. Next, wavelet packet decomposition and slope threshold methods are used to extract the features of the preprocessed signals to form multi-domain feature spaces. Finally, PSO, GA, and GS algorithms are applied to optimize the SVM. Six types of ECG signals are classified.
Preprocessing Improve wavelet transform and
improve semi-soft threshold
Feature extraction Frequency domain statistical features and time domain features
GS optimization Penalty factor C and kernel
function parameter g GA optimization
Penalty factor C and kernel function parameter g PSO optimization
Penalty factor C and kernel function parameter g
Classification The features are fed into the
optimal classifier
N SBR VT PAC PVC AF
Classification The features are fed into the
optimal classifier
Classification The features are fed into the
optimal classifier ECG signals
Figure 1: Block diagram of the proposed method for ECG signal classification. ECG signal processing includes preprocessing, feature extraction, and classification. Preprocessing removes noise from the ECG signal. Feature
extraction extracts a multi-domain feature. Three algorithms are used to optimize the classifier used to categorize the six ECG signals.
2.1 Wavelet packet decomposition
The wavelet packet decomposition method is a time–frequency transform analysis method with a variable window function shape. It is an extended signal processing method for wavelet decomposition that can reflect the characteristics of signals in the time domain and the frequency domain and perform a detailed decomposition. Wavelet packet decomposition can decompose the signal at multiple scales. It can also decompose further the high- and low-frequency coefficients of the decomposition into layers and conduct multi-layer subdivision with no redundancy or omission. Therefore, a higher-frequency resolution is possible. The wavelet packet decomposition can reflect the complete signal characteristics and has better local analysis capability.
When performing multiscale decomposition, set the subspace Xmj to a closed space of the function xm(t), and let
75
2 2 1 ( ) 2 ( ) ( )(2 ) ( ) 2 ( ) ( )(2 ) m m k z m m k z x t h k x t t k x t g k x t t k
, (1)where g k( ) ( 1)kh
1k
, g(k) is a high-pass filter with multi-scale decomposition, and h(k) is a high-pass filter with multi-scale decomposition. The two are in a mutually orthogonal relationship. When m=0, Equation (1) can be converted to the following:0 0 1 0 ( ) ( ) ( )(2 ) ( ) ( ) ( )(2 ) k z k z x t h k x t t k x t g k x t t k
. (2)In multi-scale decomposition, (t) and (t) are the scaling function and the wavelet function respectively, and satisfy the following equation:
( ) ( ) ( )(2 ) ( ) ( ) ( )(2 ) k z k z t h k t t k t g k t t k
. (3)A comparison of Equations (2) and (3) shows that (t)=x0(t),(t)=x1(t),and {xm(t)}mZ is the orthogonal
wavelet packet obtained during decomposition.
The formula for calculating the wavelet packet coefficient can be derived as follows:
1,2 , 1,2 1 , ( 2 ) ( 2 ) j m j m l k k j m j m l k k d h k l d d g k l d
. (4) 2.2 Slope threshold methodIn the waveform detection of ECG signals, the slope threshold method is a simple and fast R-peak detection method. Although noise signals can interfere easily with its detection method, which may affect the detection effect, its design idea is relatively simple, has a fast calculation speed, and real-time calculation can be realized. Part of the arrhythmia can be recognized when the denoising effect is fine. The main process is as follows: solve the slope of each point of the detected signal, and set a decision condition based on the larger value of the slope of the point near the R peak. The threshold is determined when the slope satisfies the determination condition. When the point of the region satisfies the threshold condition, the maximum point of the region amplitude is detected as the R peak. The specific flow chart is shown in Figure 2.
76
Preprocessing ECGsignals Start
Cubic operation
Calculate the slope
Threshold determination R peak detection End Calculate RR interval Y N
Figure 2: Slope threshold method R peak detection flow chart. 2.3 Support vector machine
SVM is a binary model classifier that can be designed as a multi-classifier according to actual needs. Given a certain number of samples, classifying these samples requires setting their corresponding labels. Two types of data are provided in a two-dimensional plane, denoted by o and *, respectively, as shown in Figure 3. The easiest method to separate the two sets of data is to use a straight line. Given more than one line, the closest line in the line group to the closest point in the two sets of data must be found, that is, l2. In the high-dimensional
plane, the lines that separate the different categories are hyperplanes, which enable multi-category label separation in multi-dimensional data.
l1
|w| 2
a b
l2
l3
Figure 3: Schematic diagram of SVM.
For the feature set {xi,yi},i=1,…, N,yi∈{-1,+1}, xi∈Rm. The function for linear discriminant in the
77
ω∙x+b=0, (5)
where ω is the weight vector, b is the classification threshold, and the feature set can be separated by using the hyperplane. The required classification line must have the following conditions to correctly classify all samples:
yi(ω∙xi+b)-1≥0, i=1, 2, …, n. (6)
Satisfying the above conditions can make the line have the farthest distance from the class boundary, that is, the obtained hyperplane can obtain the optimal classification effect.
Under the constraint of Equation (6), the formula is as follows:
2
(
2
)
1
=
1
2
(
)
. (7)Through the transformation, the problem of solving the optimal classification hyperplane can be expressed as a constrained optimization problem, that is, to solve the minimum problem of Equation (7); thus, the classification function can be obtained as follows:
1
( )
sgn((
)
)
sgn(
(
)
)
N i i i if x
x
b
a y x x
b
, (8)where ai is the Lagrangian coefficient corresponding to each sample in the binary problem and N is the number
of required SVM.
The above formula only solves the linearly separable feature set and a relaxation factor must be introduced on the left side in Equation (7) and a penalty factor C in the objective function on the right side for linearly inseparable data. In this manner, the problem of non-linear indivisibility can be transformed into a minimum problem: 1
1
(
)
( , )
2
N i iC
(
)
+
. (9)In the formula, the penalty factor C is a constant, which can control the penalty degree of the misclassified sample during classification. Thus, the proportion of the incorrect sample and the complexity of the algorithm is balanced. Under normal circumstances, C should not be very large; otherwise, it will affect the generalization ability of the classifier.
When a feature space cannot be linearly separable in the current low-dimensional space, a kernel function K(xi,
x) can be introduced to transform the original low-dimensional space data into a higher-dimensional space. For linear discrimination in space, the corresponding discriminant function can be expressed as follows:
78
1( )
sgn(
(
)
)
N i i i if x
a y K x x
b
. (10)2.4 Particle swarm optimization
PSO [19] is an algorithm for optimizing nonlinear continuous function and has the characteristics of easy implementation, fast convergence, and high precision. It has unique advantages in solving problems and has been studied and applied widely. Suppose a population in the N dimensional space has n particles and the position of the ith (i = 1,2,..., n) particles in the N dimensional space is a potential solution.
The flight speed is Vi
i1, i2,...,iN
. Individual extremum Pi
pi1,pi2,...,piN
is the optimal position calculated from all experienced locations of the individual and the global extremum of the population
1, 2,...,
g g g gN
P p p p is the optimal location for all particles in the group.
For the ith particle of the kth generation, the PSO algorithm calculates the velocity and position of the dth dimension of the (k+1)th generation according to the following formula:
1 1 () ( ) 2 () ( ) k k k k id id c rand pid xid c rand pgd xid , (11) 1 1 k k k id id id x x . (12)
In Equations (11) and (12), i=1,2,…,n, n is the total number of particles in the population; idk is the velocity of the dth dimension of the particle i of the kth generation; xidk is the position of the dth dimension of the kth generation particle i; pid is the best position pbest of the dth dimension of the particle i; pgd is the best position gbest
of the dth dimension; c1 and c2 are the acceleration factors; rand() is the number of random changes in the
interval [0, 1]; and ω is the inertia weighting factor. In addition, to avoid a blind search of particles, position Xi
and velocity Vi of the particles are limited to the intervals [Xmax,Xmax] and [Vmax, Vmax].
The PSO algorithm is used to determine the optimal parameters of the SVM using the following steps:
Step 1: Set the particle number of particle group, optimization algebra, acceleration factor, and other parameter values to initialize the position and velocity of each particle, where the initial position and velocity are uncertain.
Step 2: Evaluate the fitness value of each particle and calculate the fitness function value of each particle. Step 3: Compare the fitness value of each particle in the optimization process with the best position pbest. If the
fitness value is better than pbest,then fitness value is considered as the current best position pbest.
79
searched by the group particle. If the fitness value is better than gbest, then the fitness value of the particle is
taken as the optimal position of the current group and gbest is updated.
Step 5: Iteratively update the velocity and position of each particle according to Equations (11) and (12). Step 6: When the number of iterations or the fitness value meets the condition, optimization is no longer performed; otherwise, the second to fifth steps are repeated to continue searching for the optimal parameters. When the sixth step is completed, the optimal parameters are obtained. The optimal classification model can be obtained through training.
2.5 Genetic algorithm
GA is a random global search algorithm, which is mainly a random search target space. When using the GA to optimize the parameters of the SVM, the parameter to be optimized is first considered as an individual or a chromosome in the group. On this basis, each individual or chromosome is binary coded, and a primary population is generated randomly to achieve parameterization of the model. Mapping the points of the parameter space to the chromosomal space, realizing the mapping from phenotype to genotype, calculating the accuracy rate in the sense of CV by calculation, and evaluating each individual accordingly with the help of the operator of natural genetics perform multiple genetic manipulations of selection, crossover, and mutation on an individual can produce a population that represents a better solution set. The optimal individuals in the optimized group are searched to obtain the global optimal solution according to the global optimization method. 2.6 Grid search algorithm
GS, a method of parameter adjustment, is an exhaustive search method. It is the most commonly used technique for determining the optimal value of SVM parameters. The basic principle is to list different combinations of all parameters through the grid within the set parameter range to form a parameter table of all possibilities. Through loop traversal, the possibility of each set of parameters is tried, the maximum value in the array is found, and the corresponding set of best performing parameters is taken as the final result of the optimization. The initial value setting range and the step size of the adjustment parameters will generally affect the optimization results because GS calculates the results of all possible parameters. The search time-consuming problem should also be considered when setting the initial value range and the search step size because the GS method has a typical exhaustive search technique. If the data sample is large, much time is needed to perform GS. Thus, GS is more suitable for processing small sample data.
3.Results
The data used in this article are from the MIT-BIH arrhythmia database and PhysioNet’s LTAFDB. The data for both databases are taken from the human body and contain several common types of arrhythmia. The MIT-BIH arrhythmia database comprises 48 data sets, and each is an ECG signal of approximately 30 minutes. The LTAFDB database includes 84 data sets and each is an ECG signal of approximately 24 hours. When the ECG signal is collected, 1000-point data are intercepted as the data segment and the sampling frequency is 360 Hz. A
80
total of 360 sets of data are gathered and specific data sources are shown in Table 1.
Table 1: Dataset source
Category Database Recordings Training set Test set N MIT-BIH 100, 103, 105, 113, 123, and 215 30 30 PVC MIT-BIH 106, 119, 200, 203, 221, and 223 30 30
PAC MIT-BIH 207, 209, and 232 30 30
SB LFAFDB 03, 15, 24, 37, 38, and 74 30 30
VT LFAFDB 00, 22, 25, 119, and 204 30 30
AF LFAFDB 01, 25, 15, 74, 100, and 112 30 30
Total —— —— 180 180
3.1 Feature extraction
Before extracting the feature of the ECG signal, the extracted ECG data must be preprocessed to remove the influence of noise. The extracted 1000-point data were preprocessed by lifting wavelet transform and improving the semi-soft threshold. Frequency domain feature extraction and time-domain feature extraction were performed on the pre-processed ECG.
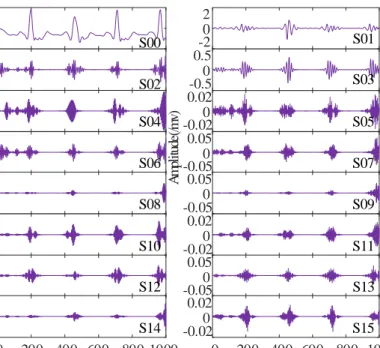
Four layers of wavelet packet decomposition were performed on the preprocessed 1000-point data, and the wavelet packet decomposition coefficients were extracted as frequency-domain features. First, the preprocessed 1000-point data were used to perform a scale wavelet packet decomposition, and the decomposition coefficients of the first layer, that is, the approximation coefficient and the detail coefficient, were obtained. The obtained coefficients were subjected further to wavelet packet decomposition to obtain wavelet packet coefficients of the second layer. Then, the coefficients of the second layer were decomposed further, the coefficients of the third layer were decomposed and the wavelet packet decomposition coefficients of the fourth layer were obtained. Figure 4 shows the decomposition coefficients of 16 wavelet packets obtained by decomposition. The obtained 16 wavelet coefficients can reflect the time–frequency information of the ECG signal, but the wavelet decomposition method does not have translation invariance. Therefore, more stable statistical features must be extracted. According to the 16 extracted wavelet coefficients, each coefficient was statistically analyzed, and its singular value, standard deviation, and maximum value were calculated. Finally, 48-dimensional frequency domain statistical features were obtained.
The type of ECG signal to be classified has evident characteristics in rhythm, and thus, time-domain features must be extracted for analysis. First, the pre-processed 1000-point data were cubed so that other waveforms can have smaller amplitudes, and the R peaks can have larger magnitudes. In this manner, the R peak can be detected more accurately. The slope of the 1000-point data was obtained. When the slope of a certain point exceeded the preset threshold, the point with the largest amplitude in the range of 20 points in the next point was
81
searched for. The point where the largest amplitude was found in the location where the R peak was located. The same method was used to search backward until the end of the 1000 points. The RR interval was calculated based on the detected R peak. The first two RR intervals were selected as the feature space to form a two-dimensional time-domain waveform feature matrix.
-0.050 0.05 -0.050 0.05 -0.050 0.05 -0.050 0.05 -0.020 0.02 -0.020 0.02 -0.050 0.05 -0.050 0.05 0 200 400 600 800 1000 -0.050 0.05 0 200 400 600 800 1000 -0.020 0.02 -0.020 0.02 -0.020 0.02 -0.10 0.1 -0.50 0.5 -20 2 -20 2 A m pl itu de (/m v) A m pl itu de (/m v) S02 S00 S04 S06 S08 S10 S01 S03 S05 S07 S09 S11 S13 S15 S12 S14
Figure 4: Wavelet packet decomposition coefficient.
The collected frequency domain statistical features and time-domain waveform features were combined into a 50-dimensional multi-domain feature. The same feature extraction was performed on the 360 sets of data and finally a 360×50-dimensional multi-domain feature space was obtained. The feature space was divided into a training set and a test set, which is a 180×50-dimensional training set and test set. The test set was used for classification diagnosis of ECG signals.
3.2 Classification diagnosis
The extracted ECG signal feature space was classified using an SVM, and a radial basis function was used as its kernel function. The SVM has two key influence parameters, namely, penalty factor C and kernel function parameter g. The values of these two parameters must be considered when classifying the ECG signals. The optimization process of the SVM parameters is indispensable. In this paper, three optimization methods, namely, PSO, GA and GS algorithm, are used to optimize the parameters of SVM.
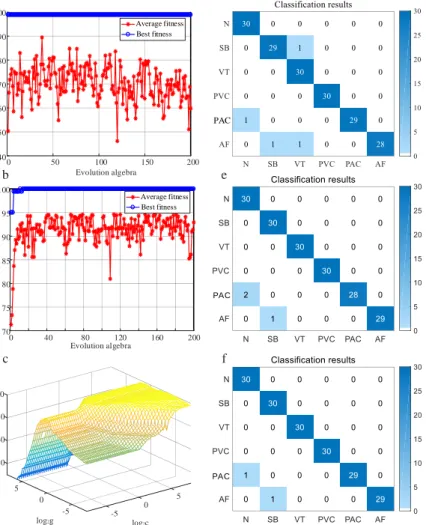
The SVM was trained in the pattern using the 180×50-dimensional training set, and the PSO algorithm was used to optimize the parameters. Figure 5a shows the result of optimizing the parameters using the PSO algorithm. The blue line with the "○" represents the best fitness, indicating the optimal solution for the particles in the population in the current situation. The red line with the "*" represents the average fitness, indicating that the particles are in the solution space. The average of the solutions was found after exercise. In optimization, the
82
PSO algorithm performed 200 iterations, the initial population of particles was 20, the cross-validation parameter was 3, the variation of the penalty factor C was 0.1–100, and the variation range of the kernel function parameter g was 0.01–1000. After many experiments, the optimal penalty parameter C was 2.2696, the optimal kernel parameter g was 1.1807, and the cross-validation accuracy was 98.89%.
Figure 5b shows the result of optimizing the parameters using the GA algorithm. The blue line with the "○" sign represents the best fitness, indicating the optimal solution found by the individual in the population in the current situation. The red line with the "*" represents the average fitness, indicating that the individual is in the solution space. The average of the solutions was found after exercise. In optimization, the GA performed 200 iterations, the maximum number of populations was 20, the cross-validation parameter was 5, the variation of the penalty factor C was 0–100, and the variation of the kernel function parameter g was 0–1000. After many experiments, the optimal penalty parameter C was 6.1206, the optimal kernel parameter g was 0.11597, and the cross-validation accuracy was 100%.
40 5 60 5 80 log2g 0 log2c 100 0 -5 -5 A c c u ra c y (% ) 0 40 80 120 160 200 Evolution algebra 70 75 80 85 90 95 100 F it n e ss Average fitness Best fitness 0 50 100 150 200 Evolution algebra 40 50 60 70 80 90 100 Average fitness Best fitness F it n e ss a d b e c f PAC PAC PAC
Figure 5: The results of optimization and classification. a. PSO optimization parameter process. b. GA optimization parameter process. c. GS optimization parameter process. d. Classification result of PSO-SVM. e.
Classification result of GA-SVM. f. Classification result of GS-SVM.
83
function parameter g are the plane coordinates, the cross-validation accuracy is three-dimensional coordinates, and the three-dimensional parameter optimization result is obtained. In optimization, the initial value of the penalty factor C and the kernel function parameter g ranged from −28~+28, and the search step size was 0.8. All possible combinations were matched by traversing the search. After many experiments, the optimal penalty parameter C was 3.0314, the kernel function parameter g was 0.13397, and the cross-validation accuracy was 100%. The performance of different optimization algorithms was compared by comparing the classification results of SVMs with different methods. This article reflects the results of the classification by counting true positives (TP), false positives (FP), true negatives (TN), and false negatives (FN). TP is the number of Xs that are correctly classified as X. FP is the number of Xs that are misclassified as Xs. TN is the number of non-Xs classified as non-X. FN is the number of non-Xs that are misclassified as non-non-Xs. The performance of the classifier is compared by calculating the sensitivity (SE), specificity (SP), positive predictive value (PPV), and accuracy (ACC) of the classifier. The specific calculation method is as follows:
100% TP SE TP FN (13) 100% TN SP TN FP (14) 100% TP PPV TP FP (15) Correct amount 100% Total ACC (16)
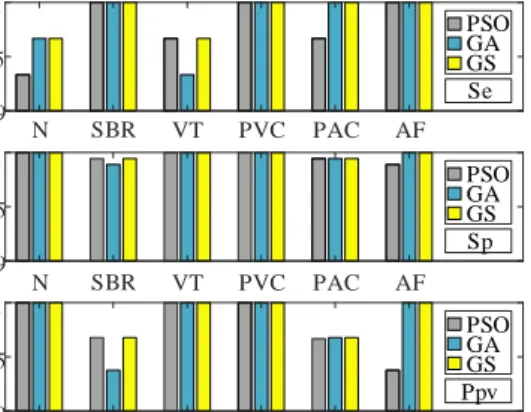
The three types of optimized SVMs are used to classify the prediction sets. The confusion matrix of the prediction results is shown in Figure 5 d–f. The different performances of the three classifiers can be obtained from the above equation. Figure 6 is a comparison chart of SE, SP, and PPV of various types of electrocardiograms. The average index parameters obtained are shown in Table 2.
0.9 0.95 1 0.9 0.95 1 0.9 0.95 1 N SBR VT PVC PAC AF N SBR VT PVC PAC AF N SBR VT PVC PAC AF PSO GA GS Se PSO GA GS Sp PSO GA GS Ppv
84
Table 2: Comparison of average indicators
Classifier Average SE Average SP Average PPV ACC
PSO-SVM 97.78% 99.63% 97.87% 97.78%
GA-SVM 98.33% 99.72% 98.42% 98.33%
GS-SVM 98.89% 99.81% 98.92% 98.89%
4.Discussion and Comparisons
Figure 6 and Table 2 show that the data used were from the ECG signals in the MIT-BIH and LTAFDB databases, but the proposed ECG signal classification processing method obtained a good classification result. The SVM optimized by the PSO algorithm achieved 97.78% ACC, 97.78% SE, 99.63% SP, and 97.87% PPV. Using the GA-optimized SVM achieved 98.33% ACC, 98.33% SE, 99.72% SP, and 98.42% PPV. The best classification results were obtained by using the GS algorithm to optimize SVM, achieving 98.89% ACC, 98.89% SE, 99.81% SP, and 98.92% PPV. The results of the proposed ECG recognition system were compared with those of other reported ECG classification methods. The comparison results in Table 3 show that the classifiers used in each paper are SVM. The types of ECGs classified in each paper and the extracted features are different. However, the classification accuracy of GS-SVM used in this paper is higher than that of other literature, indicating that the proposed method has higher classification accuracy.
Table 3: Comparison of classification results.
References Classifier Arrhythmia Classes ACC
Melagani and his
colleagues [19] PSOSVM N, PVC, PAC, RB, and LB 6 87.76% Li and his
colleagues [18] GASVM N, PVC, PAC, RB, and LB 5 97.78%
Martis and his
colleagues [15] LSSVM N, PVC, PAC, RB, and LB 5 93.48%
S. Chen [17] SVM Nsr, S, V, F, and Q 5 98.46%
Proposed PSO-SVM N, SB, VT, PVC, PAC, and AF 6 97.78%
Proposed GA-SVM N, SB, VT, PVC, PAC, and AF 6 98.33%
Proposed GS-SVM N, SB, VT, PVC, PAC, and AF 6 98.89%
5.Conclusions
A novel ECG recognition method based on multi-domain feature extraction using wavelet packet decomposition and slope threshold method and combined with SVM is proposed to classify six types of ECG heartbeats.
85
Although the data used are all from the database, the resulting classification results achieve good accuracy. The method proposed in this paper can provide a treatment method for the recognition of ECG signals and apply it to the recognition of common arrhythmias such as SB and VT. But there are still some limitations in this paper. Although we compared several optimization methods of SVM, we did not apply them to actual test experiments. Moreover, the data we use only from the database and cannot reflect individual differences in human ECG signals. In the future, we will use a large amount of clinical data to verify and improve the algorithm, and use actual experiments to test the algorithm. We will focus on the ECG signal classification algorithm for wearable automatic detection. The autonomous detection and identification of ECG signals can be realized with wearable ECG signal detection equipment to provide certain technical means to prevent heart disease.
Acknowledgements
This research was funded by the National Natural Science Foundation of China (No. 61675154), the Tianjin Key Research and Development Program (No. 19YFZCSY00180), the Tianjin Municipal Natural Science Foundation (No. 18JCYBJC29100, 18JCQNJC70800), the Tianjin Municipal Science and Technology Popularization Program (No. 18KPXMSF00050), the Tianjin Major Project for Civil-Military Integration of Science and Technology (No. 18ZXJMTG00260). J. D. Prades acknowledges the support from the Serra Hunter Program and the ICREA Academia Program.
References
[1] E. J. Benjamin, P. Muntner, A. Alonso, M. S. Bittencourt, C. W. Callaway, A. P. Carson, et al. ―Heart Disease and Stroke Statistics-2019 Update: A Report from the American Heart Association,‖ Circulation, vol. 139, pp. E56-E66, 2019.
[2] E. Di Angelantonio, S. Kaptoge, L. Pennells, D. De Bacquer, M. T. Cooney, M. Kavousi, et al. ―World Health Organization cardiovascular disease risk charts: revised models to estimate risk in 21 global regions,‖ Lancet Global Health, vol. 7, pp. E1332- E1345, 2019.
[3] H. U. Chung, B. H. Kim, J. Y. Lee, J. Lee, Z. Q. Xie, E. M. Ibler, et al, ―Binodal, wireless epidermal electronic systems with in-sensor analytics for neonatal intensive care,‖ Science, vol. 363, pp. 947-961, 2019.
[4] V. P. Rachim and W. Y. Chung. ―Wearable Noncontact Armband for Mobile ECG Monitoring System,‖ IEEE Transactions on Biomedical Circuits and Systems, vol. 10, pp. 1112-1118, 2016. [5] C. L. Herry, M. Frasch, A. J. Seely and H. T. Wu. ―Heart beat classification from single-lead ECG
using the synchrosqueezing transform,‖ Physiological Measurement, vol. 38, pp. 171-187, 2017. [6] G. Lenis, N. Pilia, T. Oesterlein, A. Luik, C. Schmitt and O. Dossel. ―P wave detection and delineation
in the ECG based on the phase free stationary wavelet transform and using intracardiac atrial electrograms as reference,‖ Biomedical Engineering-Biomedizinische Technik, vol. 61, pp. 37-56, 2016.
[7] A. Karimipour and M. R. Homaeinezhad. ―Real-time electrocardiogram P-QRS-T detection-delineation algorithm based on quality-supported analysis of characteristic templates,‖ Computers in Biology and Medicine, vol. 52, pp. 153-165, 2014.
86
[8] S. Santanu, K. Bhupen, B. Suresh and S. Sukanta. ―Multiresolution wavelet transform based feature extraction and ECG classification to detect cardiac abnormalities,‖ Measurement, vol. 108, pp. 55-66, 2017.
[9] H. Q. Li, X. F. Wang, L. Chen and E. B. Li. ―Denoising and R-Peak Detection of Electrocardiogram Signal Based on EMD and Improved Approximate Envelope,‖ Circuits Systems and Signal Processing, vol. 33, pp. 1261-1276, 2014.
[10]V. K. Sudarshan, U. R. Acharya, S. L. Oh, M. Adam, J. H. Tan, C. K. Chua, et al. ―Automated diagnosis of congestive heart failure using dual tree complex wavelet transform and statistical features extracted from 2 s of ECG signals,‖ Computers in Biology and Medicine, vol. 83, pp. 48-58, 2017. [11]Guler and E. D. Ubeyli. ―ECG beat classifier designed by combined neural network model,‖ Pattern
Recognition, vol. 38, pp. 199-208, 2005.
[12]A. S. Alvarado, C. Lakshminarayan and J. C. Principe. ―Time-based compression and classification of heartbeats,‖ Biomedical Engineering. IEEE Transactions on Biomedical Engineering, vol. 59, pp. 1641-1648, 2012.
[13]B. Venkatesan, P. Karthigaikumar and R. Varatharajan. ―A novel LMS algorithm for ECG signal preprocessing and KNN classifier based abnormality detectio,‖ Multimedia Tools and Applications, vol. 77, pp. 10365-10374, 2018.
[14]F. Charfi and A. Kraiem. ―Comparative study of ECG classification performance using decision tree algorithms,‖ International Journal of E-Health and Medical Communications, vol. 3, pp. 102-120, 2012.
[15]R. J. Martis, U. Acharya, R. K. Mandana and A. K. C. Ray. ―Cardiac decision making using higher order spectra,‖ Biomedical Signal Processing and Control, vol. 8, pp. 193–203, 2013.
[16]H. Q. Li, D. Y. Yuan, X. D. Ma, D. Y. Cui and L. Cao. ―Genetic algorithm for the optimization of features and neural networks in ECG signals classification,‖ Scientific Reports, vol. 7, pp. 41011, 2017. [17]S. Chen, W. Hua, Z. Li, J. Li and X. Gao. ―Heatbeat classification using projected and dynamic
features of ECG signal,‖ Biomedical Signal Processing and Control, vol. 31, pp. 165-173, 2017. [18]H. Q. Li, H. Liang, C. Y. Miao, L. Cao, X. L. Feng, C. X. Tang, et al. ―Novel ECG signal classification
based on KICA nonlinear feature extraction,‖ Circuits Systems and Signal Processing, vol. 35, pp. 1187–1197, 2016.
[19]F. Melgani and Y. Bazi. ―Classification of electrocardiogram signals with support vector machines and particle swarm optimization,‖ IEEE transactions on information technology in biomedicine, vol. 12, pp. 667–677, 2008.
6.Recommendations