R
ESEARCHA
RTICLEAutomated reporting from gel-based proteomics
experiments using the open source Proteios
database application
Fredrik Levander
1, Morten Krogh
2, Kristofer Wårell
1, Per Gärdén
2, Peter James
1and
Jari Häkkinen
21Protein Technology, Lund University, BMC D13, Lund, Sweden 2Department of Theoretical Physics, Lund University, Lund, Sweden
The assembly of data from different parts of proteomics workflow is often a major bottleneck in proteomics. Furthermore, there is an increasing demand for the publication of details about protein identifications due to the problems with false-positive and false-negative identifications. In this report, we describe how the open-source Proteios software has been expanded to automate the assembly of the different parts of a gel-based proteomics workflow. In Proteios it is possible to generate protein identification reports that contain all the information currently required by proteomics journals. It is also possible for the user to specify maximum allowed false positive ratios, and reports are automatically generated with the corresponding score cut-offs calculated. When protein identification is conducted using multiple search engines, the score thresholds that correlate to the predetermined error rate are also explicitly calculated for proteins that appear on the result lists of more than one search engine.
Received: October 24, 2006 Revised: December 4, 2006 Accepted: December 5, 2006
Keywords:
2-D PAGE / Protein identification / Reporting
1
Introduction
The diversity of experimental setups for proteomics is greater than ever, and vast amounts of data in different for-mats are generated, no matter which experimental workflow is used. In the classic 2-DE-based workflow, several steps are involved, each generating data with different formats. Gel analysis programs produce analysis data in one format, spot pick lists in another format, spot processing equipment pro-duce log files in their format, the mass spectrometers will return raw data in formats specific to the vendors, and the processed peak lists can be displayed in a variety of formats.
Finally, protein identification search engines return a variety of different report formats. Even though the experimental work is fast and at least partly automated, the process of putting together all data usually requires a lot of hands-on work. Now, there is an effort within the HUPO to standardise the data formats (PSIDEV, http://psidev.sourceforge.net), but until standards emerge the proteomics researcher will have to deal with all the different kinds of data formats.
Proteomics experiments, and protein identification in particular, are complex processes and the statistical relevance of results can be hard to assess. Therefore, a minimum amount of information about protein identification has been set as a requirement for publication in the major proteomics journals ([1], http://www.mcponline.org/misc/ParisReport_ final.shtml). In order to adequately report MS and MS/MS search results, a lot of information is required to be assem-bled, which is very time-consuming and tedious when done manually. Furthermore, the determination of false-positive ratios for identifications requires additional work.
Correspondence: Dr. Fredrik Levander, Protein Technology, Lund
University, BMC D13, 22184 Lund, Sweden
E-mail: [email protected] Fax:146-46-222-1495
In this report, we describe how the open-source Proteios database software ([2], http://www.proteios.org) has been expanded to overcome some of the problems described above. Automatic importers have been created and data is assembled from several steps of the gel-based workflow. Proteios allows the automatic generation of protein identifi-cation reports that contain the information required for publication of proteomics results. The format definition is flexible and can be adjusted to meet any future changes in the standards being defined. The user can set the acceptable error rates and the software automatically calculates corre-sponding search score cut-offs for single or multiple search engines.
2
Materials and methods
2.1 Proteios database application
Proteios is a Java application that communicates with a pro-teomics database using the Hibernate (http://www.hiberna-te.org) database abstraction interface. The major benefit of using Hibernate is that developers do not need to access the relational database tables directly as Hibernate automatically takes care of the mapping from Java objects to SQL state-ments. The use of Hibernate allows the user to select their relational database of choice, such as MySQL (http:// www.mysql.com), PostgreSQL (http://www.postgresql.org) or Oracle (http://www.oracle.com).
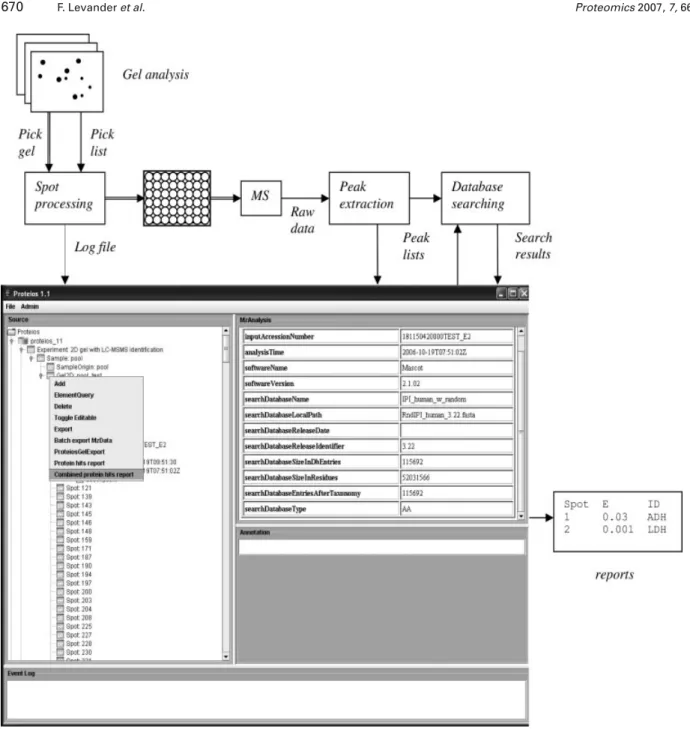
The graphical user interface of the Proteios application has been created as a database browser where the user can explore associated objects by simple mouse-clicking. Upon right clicking on an object, possibilities like import and report generation open up (Fig. 1).
2.2 Proteios database model
The original Proteios data model was built on the PEDRo model [3]. When mzData version 1.05 XML format for MS data (http://psidev.sourceforge.net/ms/) was released, the MS part of the Proteios data model was changed to closely resemble mzData. The major excep-tion is that the binary representaexcep-tion of spectra in mzData is replaced in the Proteios model with peak lists. Since the m/z and intensity of peaks are stored as binary data in the database, we find it more efficient to store the actual peaks as separate objects that can be extended with fields that are not present in the mzData peak list. Fur-thermore, fields for sample tracking have been added to the top mzData element. These fields contain tracking information of the MALDI target or microtitre plate from which the sample originated, as well as the position in the container.
For protein identification results the analysisXML format is currently being developed by the PSIDEV group (http:// psidev.sourceforge.net/proteomics-informatics/home.html).
In consequence, the protein identification part of Proteios is based on the structure of the alpha version of analysisXML and the top element is called MzAnalysis.
Proteins are referred to by life science identifiers (LSIDs) ([4], http://lsid.sourceforge.net/) and a separate LSID reso-lution service has been put up to provide protein sequences, rather than storing this information in the proteomics data-base. LSID is a scheme for naming and identifying data resources uniquely in distributed data stores.
2.3 Data import
For automation of data import, Proteios has been expanded with import tools for different parts of the gel-based prote-omics workflow as discussed below.
After gel spot excision, digestion and spotting, Spot Handling Workstation (SHW, GE Healthcare) log files are parsed by Proteios to generate a 2-D gel object, complete with gel spots, their coordinates on the gel, and the positions of the excised gel spots in the resulting microtitre plate and MALDI target plates. For manual spot-picking or other spot picking equipment, there are several options for submitting the cor-responding data into the database: (i) manual editing in the graphical user interface; (ii) generation and import of stand-ard Proteios xml files, which can be done by XSL transfor-mation (http://www.w3.org/TR/xslt) of spot-picker output files; (iii) implementation of a spot-handling equipment spe-cific importer as described in the software documentation.
After MS, peak lists of different formats can be imported in batch to Proteios. Since peak lists normally do not contain any information about the sample origin, file-naming con-ventions are needed to automatically associate the peak lists to the right gel spot or band. We have decided to name the data files such that the plate position is appended to the end of the filename. Peak lists are imported platewise and they are automatically inserted at the correct place in the Proteios database, together with links to the corresponding gel spot or gel band. The peak list formats that currently can be import-ed into Proteios are mzData 1.05, ProteinLynx Global Server 2.2 XML (PLGS, Waters), merged DTA files, Micromass PKL and PIUMS Pepex and Pepfil [5]. MzData, PLGS and PIUMS peak lists contain information about the processing parame-ters used for generation of the peak lists, and this informa-tion will be retained in the Proteios database, in mzData for-mat. When importing DTA and PKL files, standard instru-ment information is added from XML configuration files that the user can edit for their experimental setup.
Protein identification search results from MASCOT (http://www.matrixscience.com) and Tandem (http:// www.thegpm.org) can be imported in batch mode, and are parsed into a common format in the database. All search set-tings and search results are inserted into the database, and dependencies between peptide and protein identifications are kept. In order to get the correct linking of peptide matches to individual peak lists, the database searches should be per-formed with mzData-formatted peak lists.
mzData-for-Figure 1. Lab workflow and screenshot of Proteios application when right-clicking on a 2-D gel icon. In the right Proteios window the top
element of a database search is displayed. In the flow chart, thick lines represent sample flow. Thin line arrows represent data flow.
matted peak lists can be exported from Proteios, one gel at a time, in cases where the imported peak lists are in other for-mats.
PMF results from PIUMS can also be imported, and these are also converted into the standard Proteios format upon import. The search results, along with Pepex and Pepfil peak lists, are automatically imported for one MALDI target plate at a time, provided that they are placed in a workspace whose name starts with the name of the target plate. The PIUMS workspace importer parses target positions from file names during import.
2.4 Reports
The standard gel reports described in this work are inte-grated in the Proteios application. The report generation is executed from the graphical interface and works by obtain-ing the appropriate Java objects from the Proteios database through Hibernate. Result lists are built up in memory, and statistical calculations are performed on these lists. The results can be viewed in the graphical interface or exported as tab-separated lists that can be further analysed and formatted in spreadsheet software.
3
Results and discussion
3.1 Workflow
The extensions to Proteios that are described in the present work are aimed at providing a simple way for proteomics researchers to structure data from gel-based experiments. In practice, the users normally perform gel image analysis and generate pick lists before coming to Proteios. Instead of importing the pick lists into Proteios, the log files from the spot picker are imported, since these contain the data links between gel spots and MS samples (Fig. 1). The next step is to perform MS and the generation of peak lists using one of the available MS software packages. The peak lists are imported in batch into Proteios, and if the peak list files are in other formats than mzData, they are converted to mzData format upon import into Proteios. Finally, protein identifica-tion is performed batchwise using mzData-formatted peak lists and the search results are imported into Proteios. Asso-ciations between gel spots and peak lists, as well as between peak lists and peptide and protein identifications, are auto-matically generated when data is imported. Proteios then provides different default reports for the analysis and pre-sentation of data.
3.2 Basic gel report
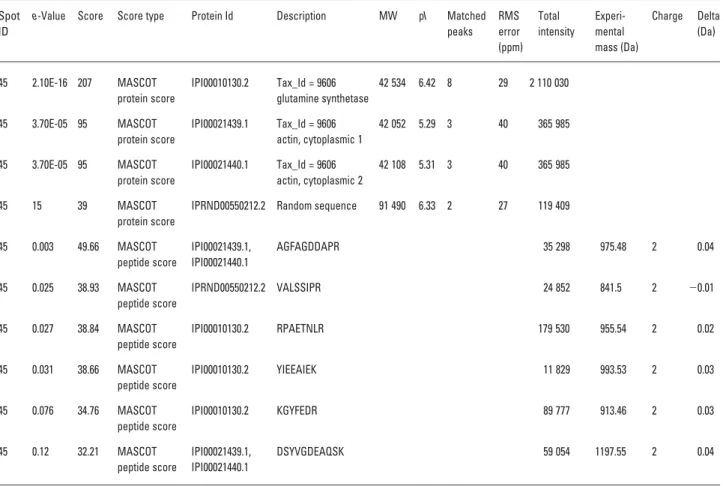
The basic gel report aims at linking protein identifications to gel spots. MS and MS/MS protein identification search results are included in the same report. The tabular report contains all the information that is currently required for publication in the major proteomics journals ([1], http:// www.mcponline.org/misc/ParisReport_final.shtml). For peptide fragment fingerprinting searches, identified pep-tides are given on one line each, with sequence, precursor and mass error information. Proteins are also separately presented on one line with the protein score, total number of peptides and root mean square mass error of the matched peptides (Table 1).
Especially when LC-MS/MS is used for gel spot protein identification, it is common to find several proteins in a gel spot. Most gel-based experiments aim at finding which pro-teins differ in concentration between two cell states and these differences are detected as changes in gel spot inten-sity. Most often, only differences in the most abundant pro-tein found in a spot can be detected since the less abundant ones are much lower in concentration, as discussed in [6]. For MS/MS peptide fragment fingerprinting searches, the total peak intensity of each peak list resulting in peptide
Table 1. Extract from one gel spot of a Protein Hits Report of LC-MS/MS search results
Spot ID
e-Value Score Score type Protein Id Description MW pI Matched peaks RMS error (ppm) Total intensity Experi-mental mass (Da) Charge Delta (Da) 45 2.10E-16 207 MASCOT protein score IPI00010130.2 Tax_Id = 9606 glutamine synthetase 42 534 6.42 8 29 2 110 030 45 3.70E-05 95 MASCOT protein score IPI00021439.1 Tax_Id = 9606 actin, cytoplasmic 1 42 052 5.29 3 40 365 985 45 3.70E-05 95 MASCOT protein score IPI00021440.1 Tax_Id = 9606 actin, cytoplasmic 2 42 108 5.31 3 40 365 985 45 15 39 MASCOT protein score
IPRND00550212.2 Random sequence 91 490 6.33 2 27 119 409
45 0.003 49.66 MASCOT peptide score IPI00021439.1, IPI00021440.1 AGFAGDDAPR 35 298 975.48 2 0.04 45 0.025 38.93 MASCOT peptide score IPRND00550212.2 VALSSIPR 24 852 841.5 2 20.01 45 0.027 38.84 MASCOT peptide score IPI00010130.2 RPAETNLR 179 530 955.54 2 0.02 45 0.031 38.66 MASCOT peptide score IPI00010130.2 YIEEAIEK 11 829 993.53 2 0.03 45 0.076 34.76 MASCOT peptide score IPI00010130.2 KGYFEDR 89 777 913.46 2 0.03 45 0.12 32.21 MASCOT peptide score IPI00021439.1, IPI00021440.1 DSYVGDEAQSK 59 054 1197.55 2 0.04
identification is calculated. The intensities are summed for proteins, and in this way one can get an idea about which of the proteins is the most abundant in the spot (Table 1). 3.3 Combined search report for multiple searches A popular way to estimate false-positive ratios of MS/MS database searches is to perform the search in a reverse sequence database and count the number of hits compared to the number of hits in the corresponding real (forward) database [7]. This approach has proven successful and straightforward to use [8] and eliminates some of the prob-lems with site-specific tuning that can be seen with other validation methods [9]. Several reports have shown the strength of using several search algorithms and consensus reports [8, 10–13] for identification. Here, we present a gen-eric method for combining search engine outputs. The method is illustrated using the Tandem and MASCOT tools, but it is applicable for any number of search engines. A combined database of forward and reverse protein sequences is created by adding the reverse of every forward protein at the end of the forward database. It is equally possible to add random sequences instead of reverse sequences if the search is to be conducted without enzyme specificity or as a PMF search, but here we choose to call the sequences ‘reverse’ for simplicity. A MASCOT and Tandem search is performed against the combined database for each of the gel spots with mzData-formatted peak lists.
The outputs from MASCOT and Tandem are treated as lists of pairs of a gel spot and a protein ID (forward or reverse) with a score. Only pairs with good scores are reported by MASCOT and Tandem. For a pair of a gel spot and a forward protein occurring in the output lists, there are three possibilities: it occurs exclusively in the MASCOT list, it occurs exclusively in the Tandem list or it occurs in both the lists. For each pair a p-value is calculated, where we define p as the probability for a result with this score or better to occur in the reverse database. If a pair occurs exclusively in the MASCOT list with a score M, the p-value of the pair is calculated as (Nreverse(M)11)/(Ntotal11) where Nreverse(M) is the number of hits in the reverse data-base with a higher MASCOT score than M (ignoring Tan-dem scores altogether), and Ntotal is the total number of pairs, which is equal to the product of the number of pro-teins in the reverse database and the number of gel spots. The added 1 is a pseudo count and makes the p-value con-servative. The corresponding p-values are calculated for pairs occurring exclusively in the Tandem list. For pairs that occur in both the MASCOT and Tandem list with scores M and T respectively, the p-value is calculated as (Nreverse(M, T)11)/(Ntotal11), where Nreverse(M, T) is the number of pairs that have reverse scores better than M in MASCOT and better than T in Tandem. In practice, Nreverse(M, T) is often zero and the pseudo count makes the p-value conservative. This procedure assigns a p-value to all reported pairs. The p-values are multiplied with a factor two,
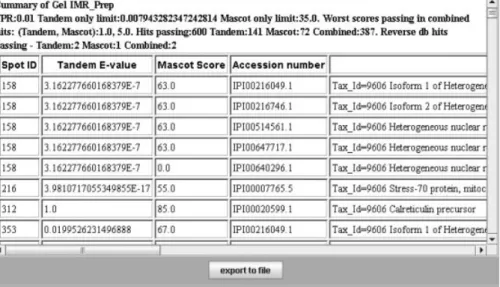
in order to account for the use of two search engines. Since there are Ntotalpossible pairs of peak lists and proteins in the forward database (the forward and reverse database have the same size), a correction for multiple hypothesis testing is needed. We have chosen to use the Benjamini–Hochberg formalism [14] for false discovery rates. It works by ranking all p-values in ascending order. Call the ranked p-values p_1, p_2, p_3 etc. The list of significant hits at the false dis-covery rate level alpha is given by the maximal i for which p_i6Ntotal/i is smaller than alpha. Since the p-values are given by counting in the reverse database, they are never extremely small, which implies that in order to get a nonempty list of hits, the false discovery level alpha should not be too small. In our datasets, a level of 0.01 seems to work well (Fig. 2). In general, the larger the database and number of gel spots are, the smaller the false discovery rate that can be chosen.
We have used this combined protein hits report for sev-eral data sets, and it is evident that the sensitivity of protein identification is greatly enhanced by combining the search results from two search engines, e.g. as shown in Fig. 2, and the sample database provided with the Proteios 1.1 package. Even in cases when either search engine reports many low-scoring reverse sequence hits, very few common reverse hits are found. Indeed, when MASCOT and Tandem where set to report as many hits as possible, which for MASCOT means that almost half of the reported proteins are reversed, less than one percent of the hits common to both engines were in the reverse database. Still, with the Benjamini–Hochberg approach we can safely generate protein hit lists where the estimated error rate is conservatively calculated.
Although it is becoming standard procedure to use sev-eral MS/MS search engines for shotgun proteomics experi-ments, few attempts have been published on how to combine the searches statistically. The commercial software Scaffold (http://www.proteomesoftware.com) and ProteinScape (Bruker Daltronics, [13]) have means to combine results with false-positive control, but of noncommercial alternatives, we are only aware of the procedure described by Keller et al. [12]. They used PeptideProphet [15] to assign uniform prob-abilities, instead of search scores, to the results from the dif-ferent search engines used. The peptide probabilities for each search engine were then recalculated using the results from the other search engines. Although their method seems to be effective, it is not clear how well the calculated error of the method agrees with the false-positive ratio as calculated by counting hits in a decoy database. This could easily be confirmed by using a database with a decoy part when performing the searches, which would further enhance the utility of their method. In comparison, our method works on any search score type without prior pre-processing of the search results. The method is compatible with PeptideProphet probabilities, and search engines that have several relevant output scores would probably benefit from such score reprocessing to get a better discriminating score. The drawback of our method is that very high scores are not rewarded, and one can end up with an empty protein
Figure 2. Screenshot of a report from combined searches. In the header some numbers are given for the report. FPR is the false positive
ratio selected by the user. Tandem only limit is the highest e-value allowed for hits that were only reported by Tandem. MASCOT only limit is the lowest score allowed for hits that were only reported by MASCOT. For hits that were reported by both search engines, the worst scores of any hit that passed the false-positive threshold are also reported, even if the actual score cut-offs are a function of the scores from both search engines. In the present example, 600 proteins were reported as significant, and of these, 387 were reported by both search engines. One hundred and forty-one proteins were reported by Tandem only and 72 proteins by MASCOT only. A total of five hits in the reverse database would have been reported using the calculated significance limits. As a comparison, by simple counting of hits in the reverse database, and by setting the score limits as tightly as possible in order to get less than 1% hits in the random database, the MAS-COT search would give 323 forward hits and three reverse hits with a score limit of 32, while the Tandem search would give 352 forward hits and three reverse hits with an e-value limit of 0.010. Our conservative statistical method yields slightly fewer positive hits for the individual searches, but the combined result returns significantly more hits, still at a conservative rate of false positives.
list if the dataset is small and the selected false discovery rate is low. However, for large datasets it is a robust approach with no specific assumptions regarding the experimental setup.
4
Concluding remarks
In summary, the Proteios software can help proteomics researchers with efficient data handling and especially in reporting of protein identifications. Although this report is focused on the 2-DE-based workflow, very little modifica-tion is needed for LC-MS-based workflows, since all data from protein identification using MASCOT or Tandem have been already imported into the database. There is only need for optimised reports for the particular work-flows. The open source nature of Proteios will also allow the users to add specific importers or reports according to their needs.
Proteios version 1.1 is available for download at http:// lev.thep.lu.se/trac/proteios1 free of charge (GPL licensed software). Some scripts for generation of databases with reverse sequences, automation of MASCOT export as XML, and Tandem batch searching are also available on the web-site.
The authors thank Swegene and the Knut and Alice Wallen-berg Foundation as well as the Stiftelsen för Strategisk Forskning funded CREATE Health Centre for financial support.
5
References
[1] Wilkins, M. R., Appel, R. D., Van Eyk, J. E., Chung, M. C. M. et al., Proteomics 2006, 6, 4–8.
[2] Gärdén, P., Alm, R., Häkkinen, J., Bioinformatics 2005, 21, 2085–2087.
[3] Taylor, C. F., Paton, N. W., Garwood, K. L., Kirby, P. D. et al., Nat. Biotechnol. 2003, 21, 247–254.
[4] Clark, T., Martin, S., Liefeld, T., Brief. Bioinform. 2004, 5, 59– 70.
[5] Samuelsson, J., Dalevi, D., Levander, F., Rögnvaldsson, T., Bioinformatics 2004, 20, 3628–3635.
[6] Hunsucker, S. W., Duncan, M. W., Proteomics 2006, 6, 1374– 1375.
[7] Peng, J. M., Elias, J. E., Thoreen, C. C., Licklider, L. J., Gygi, S. P., J. Proteome Res. 2003, 2, 43–50.
[8] Elias, J. E., Haas, W., Faherty, B. K., Gygi, S. P., Nat. Methods 2005, 2, 667–675.
[9] Cargile, B. J., Bundy, J. L., Stephenson, J. L., J. Proteome Res. 2004, 3, 1082–1085.
[10] Chamrad, D. C., Korting, G., Stuhler, K., Meyer, H. E. et al., Proteomics 2004, 4, 619–628.
[11] Kapp, E. A., Schutz, F., Connolly, L. M., Chakel, J. A. et al., Proteomics 2005, 5, 3475–3490.
[12] Keller, A., Eng, J., Zhang, N., Li, X.-J., Aebersold, R., Mol. Syst. Biol.2005, 1, msb4100024-E4100021–msb4100024-E4100028.
[13] Stephan, C., Reidegeld, K. A., Hamacher, M., van Wall, A. et al., Proteomics 2006, 6, 5015–5029.
[14] Benjamini, Y., Hochberg, Y., J. R. Stat. Soc. B 1995, 57, 289– 300.
[15] Keller, A., Nesvizhskii, A. I., Kolker, E., Aebersold, R., Anal. Chem. 2002, 74, 5383–5392.