GEOSPATIAL DATA EXPLORATION USING INTERACTIVE AND
INTELLIGENT CARTOGRAPHIC ANIMATIONS
OGAO P.J., & KRAAK, M-J.
Division of Geoinformatics, Cartography and Visualisation International Institute for Aerospace Surveys and Earth Sciences
P.O. Box 6, 7500AA, Enschede, The Netherlands Telephone +31 (0)53 4874 444, Fax: +31 (0)53 4874 335
{ogao, kraak}@itc.nl
ABSTRACT
At present, the use of cartographic animations in exploratory environments is characterized by a nature that is passive and that which is based on predetermined linear playback paths of the animation frames. By this, the animations are pre-designed to run with little or no interference from the viewers and only along specific predetermined story lines. Partly, the reason for this passivity that also translates into low levels of interactivity is the fact that during playback, each scene is viewed as a single graphic image whose content therein cannot be disintegrated into the individual geospatial features that it encompasses. This limits the geospatial features, their properties and the behaviors that the scenes can support and also reduces the level of interaction that a user can have with the individual geospatial features. For cartographic animations to be effective tools, their design should focus on developing interactive functionality that can present and analyze data, facilitate experimentation with different combinations of data, and forecast future scenarios during run-time. To geo-scientists, interactive tools are necessary for manipulating the images on display and its associated data sets. They similarly can reduce the geo-scientist's interpretative and judgmental workload during exploratory tasks. In this paper we outline an approach in cartographic animation design that enhances the level of interaction between user and the geospatial features embedded within the animation frames. We do this by giving more autonomy to the geospatial features in a way that their individual characteristics can be steered and tracked and their relationship to other features ascertained. This we do by incorporating an inference mechanism within an animated geospatial object thereby enabling an animation to autonomously make decisions and respond to the user and other geospatial object's actions during run-time. We demonstrate this functionality in a prototype that utilizes meteorological data sets to dynamically characterize and track weather patterns and resolve conflict situations during exploratory tasks.
Keywords: interactive, intelligent, cartographic animation, cognitive modeling INTRODUCTION
Exploratory cartographic environments enable geo-scientists to explore raw data creatively, in any combination and at any scale using highly interactive tools (MacEachren and Kraak, (1997)). These tools facilitate the exploration process of searching for patterns, developing questions and hypothesis in anticipation that seeing or finding these patterns will invoke and stimulate insight into the data or
phenomena. Central to the nature of tools used in this environment are the words dynamic and interactive.
Dynamic maps are those that change during viewing and can take the form of either animations, interactive maps, or a combination of the two. Interactivity enables users to adapt to, and control the contents and format of the display.
One of the tools suitable for use in this environment and which is increasingly being used to represent the earth's dynamic phenomena is the cartographic animation. Cartographic animation is a visualization technique in which an illusion of change is created by rapidly displaying a series of individual states of a scene. The changes are attributed to those of spatial data's component of location, attribute and time. Their real power, of course, is to show the interrelations among these three components. For the user of a cartographic animation it is important to have tools available that allow for interaction while viewing the animation (Monmonier & Gluck, 1994). This will help users to gain understanding of complex problem solving tasks by interacting with the displayed images. However, most animated maps at present are passive, in that they are pre-designed to run with little or no interference from the viewers. Partly, the reason for this low level of interactivity can be attributed to the fact that, when viewing the conventional key-frame cartographic animation, each scene is viewed as a single graphic image, whose content therein
can not be disintegrated into the individual spatial features that it encompasses. This limits both the objects, properties and behaviors they support and reduces the level of interaction that a user can have with the individual map features. Also contributing to this passive nature is the inappropriateness of effecting interactivity using the conventional methods. Here, the animation's dynamic nature renders some of these methods unsuitable thus calling for more intuitive and effective methods yet to be developed. For cartographic animations to be effective tools, their design should focus on developing interactive functionality that can present and analyze data, facilitate experimentation with different combinations of data, and forecast future scenarios.
CARTOGRAPHIC ANIMATION CREATION TECHNIQUES
One of the earliest and commonly used methods for creating cartographic animation was the frame-based
animation technique. Here a series of individual maps or images are assembled and viewed sequentially
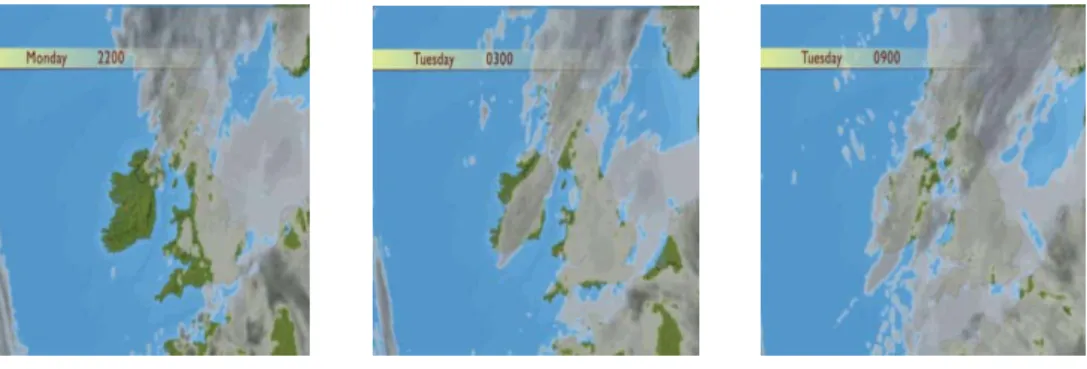
and in quick succession. The maps are viewed in a predetermined linear sequence (Figure 1). Being
predetermined also implies that their sequence of display is fixed and thus they normally are characterized as being passive animations - in that they are pre-designed to run with little or no interference from the viewers.
Monday 2200Hrs Tuesday 0300Hrs Tuesday 0900Hrs
Figure 1. Sequences of still Infra-Red Meteosat Images of UK. Animating the images reveals the changes in cloud cover through time (BBC weather center, URL 1).
Overcoming the fixed linear, predetermined animation paths that is prevalent in frame-based animations, can be achieved by giving the user tools that enable one to choose frames from amongst stored images and defining the path that the animation should follow. Alternatively images can be retrieved directly from the database computationally by having the user define the animation path and the system computes and fills in the appropriate images. This is a common technique when visualizing 3-D spatial data using Virtual Reality Modeling Language (VRML). By using VRML browsers, viewers can walk-through, fly-by the virtual world wherever and whenever they opt to. In both these cases the computation and data transfer demands are quite high.
More flexible non-linear descriptions of animation frames confines animation not just to one path of view, but also loops and branches. The ability to change what path an animation take during run-time allows great scope for interactivity. By this an animator just defines a lot of interpolating splines, and at run-time the system determines which one is used. However, this can be very time-consuming, since to make the animation feel very responsive the animator will need to define an awful lot of different segments of animation. What we need are new motion synthesis tools that are responsive in that they allow an animator to describe a range of possible movements concisely. This requires the development of new motion synthesis tools that allow the animation to respond to the user. Thus parallel to this, there ought to be development in interface options that allow for users to specify their queries and the animations response parameters. This in essence will also determine the systems processing requirements. Real-time response is computationally involving and thus requires computers with a high processing
speed. Developers need to determine the optimal means by which changes within the animations are noticed whilst at the same time supporting interactivity, user goals and actions. Dynamic query abilities that specifies queries and enables the visualization of their results by accessing the database and providing a real-time feedback to the user's queries is crucial (Ahlberg and Shneiderman, 1994). Such query interfaces are faster, easier, more pleasant and less error prone than other query interfaces.
One reason for the low level of interaction when dealing with frame based animations is that in these animations, each frame is viewed as a graphic image in its entirety as opposed to individual features with each having a more or less autonomous behavior (Huizing and Barenbrug, 1997). This has the effect of limiting the level of user involvement in controlling the animation during run time. Perhaps, the use of animations where each graphic element is stored not as an image, but as a mathematical expression that describes its size, shape, position, and other attributes in relation to other objects and physical laws will suffice as a valid design approach. Such animations should find use in simulation and modeling tasks in spatio-temporal processes.
COGNITIVE BASIS FOR VISUAL INTERACTIVITY
Adding interactivity to visualization helps overcome some of the inherent hurdles common in static displays by allowing multiple and related visualization options to be available. In animations, this should significantly improve expert user's ability to understand data, perceive trends, and visualize real or imaginary objects (Foley et al, (1990), Dibiase et al, (1994)). Typical tools that interactivity brings along include selection, transformation, query, navigation, orientation, multi-scale views, re-expression, linked views and animation (Kraak, (1998), Dix and Ellis (1998), Peterson, (1995), Shepherd (1994) and Cartwright (1996)). Interactive visualization tools can be used to steer processes, track changes and identify features that change as a result of variation in certain parameters in both real-time, modeled or simulated processes (MacEachren, 1995).
Interactivity is important in data visualization as a means for both exploring the information contained on the display and extending links to the data behind the display. An area that has been listed amongst the International Cartographic Association's Commission on Visualization (IcaVis) research agenda is on the
need to explore ways by which animations can be linked to the database (URL 2). This is because the
current status of the animation environment inhibits query processes to the database from within the animation (Ogao, 1999). This link will enable an interactive visualization environment and visual data access that has a progressive real-time refinement of the displayed image. Interactive query processes and feedback capability will enable users to confirm, reject or steer evolving hypothesis. With interactive animations, the user has the power to control the views both spatially and temporally.
Visual problem solving tasks are iterative perceptual processes by which users formulate queries and use interactive tools to invoke actions and feedback (Tweedie, 1995). Problems can be reformulated in order to give rise to a different view of the same data. Users may also extract a new data set, or form a new specification of the problem, since either the initial one has been solved or its dimensions changed, and may require a new conscious plan altogether.
A typical scene in visual problem solving commences with a user extracting information from the visual product through an observation process that acknowledges the spatial representations intended, e.g. "an object of type B is present", that "the river is to the left of the railway line". Beyond this, users engage in a visual reasoning process, where inferences are made from current information and background knowledge by explicit use of knowledge and inference rules. They are able to iteratively reason about the objects that they perceive and to add or relate it to already existing knowledge. A simulation process might follow where a future state of the configuration and the corresponding perceptual observation are further
represented. In figure 2, we highlight the view that image formation is not an end to the visualization
process rather a starting point to an iterative process of knowledge seeking. The user actions might be perceptually motivated, backed by concepts already known to the geo-scientist. The user actions in such
an environment is characterized by exploratory observation or movement through the space (Tweedie, 1995).
Internal perceptual experience of user
Preposition describing actions Action directed to the
displayed image Action directed to the database Perception Memory Prepositions from perception Prepositions from memory New knowledge Database User goals Action
Figure 2. The basis of image interaction in cartographic visualization environments
The context under which this study is undertaken is signified by the user's need to engage the image on display in specific actions that may be directly addressed to the representation on display or the database. In essence what is needed are prepositions that describe the user's intended actions, an aspect that counts a lot in tool design for interactive visualization.
MODES OF INTERACTION IN CARTOGRAPHIC ANIMATION
The dynamic nature of cartographic animations makes it difficult to perform spatial analysis tasks and to effect user control of the animation during playback. In general, there are two conventional ways of employing interactivity between the viewer and the display. These are by; direct and indirect manipulations (Thomas and Demczuk, (1999), Beier, (1994)). A third form of interaction which has hardly been used with animations, but which this paper forwards to use in order to counter the animation's fugitive nature is one that involves the interaction between the represented autonomous graphic features (animation frames) with each other. We will here briefly outline the general concepts behind direct and indirect interactions and in the next section detail on interactivity between autonomous spatial objects which utilize an inference mechanisms embedded within the animation frames, thereby enabling them to make decisions during runtime.
Direct manipulations are characterized by: immediate feedback to actions, incremental changes, and reversible effects (Shneiderman, 1983). When applied appropriately they give the illusion that users are directly interacting with the spatial features on display. Features can be selected, dragged to a new position, rotated, stretched to make it larger etc. The manipulation is simple to use and easy to understand since, the user's focus and attention is directed towards the visual changes as they occur. Crucial to this type of interaction is the ability to give feedback in real-time which is much dependant on the rate at which computations are performed and images displayed. Whereas direct manipulations are more intuitively preferred, they fail when it comes to actions that require a greater precision or when dealing with hidden features in the display. An example of such an action may involve a user transforming a displayed feature by a specified angle of rotation or moving a symbol to align it with another. These actions can be implemented by using commands either through use of buttons, toolbars or command
scripts. Examples of such interactions are the mouse over and click-on (Peterson, 1999).
Indirect manipulations perform transformations of the displayed graphical objects through command menus and buttons. The most common tools by which users indirectly interact with the animation is
through the media player controls; play, pause, fast forward/rewind buttons and to some extents through active legends and sliders. The functionality mainly addresses the interrelationships between the temporal, location and attributes of the spatial phenomena. Other examples involve using the brushing and focussing techniques (Monmonier, (1990), Harrower and MacEachren, (1998)). Brushing is a high-interaction technique for analyzing multivariate data and was first applied in scatterplot matrices. By this technique it is possible to link the displayed map to a slide scale so that changes in a data set are viewed geographically, chronologically or in attribute. As such, the user gets an overview of the relation amongst geographic objects based on location, attributes and time. Applying the linked brushing concept into the temporal realm allows users to recognize specific periods during temporal cycles. Temporal focussing reinforces the linear characteristic of time and is used here to adjust the start and end dates of the animation.
INTERACTIVE SPATIAL FEATURES
So far cartographic animation in geo-spatial applications have focussed on visualizing historical data. Maps, images or data previously recorded have featured more frequently into these dynamic displays. Lately there has been an increased interest to "visualize the future". Manipulating data sets behind the map representation is one sure way of gaining understanding of the future. This is seen in environmental processes as: in climate change, pollution, land degradation, desertification and deforestation, among others. These processes exhibit characteristics typical of spatio-temporal processes that are representative of the dynamic earth processes. Basic processes that depict the appearance and disappearance of entities and those processes involving movements and trajectories can easily be depicted in temporal cartographic animations. Interest here is in the individual patterns, trends and anomalies that characterize these processes. It is quite practical to animate individual layers, and even to overlay separate layers by
synchronizing the animation's time line.
Showing relationships between different spatio-temporal entities can similarly be enhanced using temporal cartographic animation. But the nature of the animation has to take a different form, since some relationships or interactions between spatial features or entities do give rise to subsequent new entities, as
seen with diffusion processes (figure 3) where a transfer of characteristics between spatial entities takes
place (Claramunt, 1995). For example, a production process involves the creation of new spatial entities from the actions of one or more entities of different natures. Where the parent entity is of the same nature as the newly created entities, then a reproduction process arises. At times, a transmitter entity does modify the characteristics of a receiver entity resulting in a transmission process. These processes are typical of spatio-temporal phenomena that characterize geo-spatial applications.
Diffusion processes y x t1 y x t2 y x t1 y x t2 y x t1 y x t2
Production Reproduction Transmission
Figure 3. Functional relationship between entities (Source: Claramunt, 1995)
One way of effecting this capability in cartographic animations is by embedding an inference mechanism in the animation frames to depict the autonomous and interactive behavior of a specific spatial attribute or phenomena being represented. When animating these phenomena or similar ones, it is important to visually distinguish between the agent(s) provoking the change and those that are being modified as a result of their action. In normal cases with cartographic animations, unless records exists showing the result of say a production process, the task of interpreting the cause and effects are left to the domain expert. This can be a burden in terms of increasing the users memory workload and at times may deviate
ones exploratory pursuits to less important tasks. With imbued domain knowledge in the spatial features, appropriate frames that are in synchrony with the animation can be called or created to objectively depict the scenario at hand. One way of imbuing intelligence in animations is by utilizing a cognitive modeling approach as outlined below.
A cognitive modeling approach
Behavioral animation takes into account the relationship between each feature and others. The features are self-animating characters that react appropriately to perceived environmental stimuli. More elaborate animations that are based on cognitive modeling can govern what a animated object knows, how the knowledge is acquired, and how it can be used to plan actions (Funge et al, 1999). Such models may be beneficial in complex interdisciplinary tasks where variables may influence one another, as is the case of urban studies, and environmental monitoring (Ogao, 1999). These animations are intelligent as they can make decision during runtime and effect an immediate response. With intelligent animations, features within animations are created on the fly and in synchrony with the other existing features. No longer are viewers confined to one path of view, but loops and branches with new occurrences. This loops and branches will represent the varying user tasks and/or queries that viewers want to pursue.
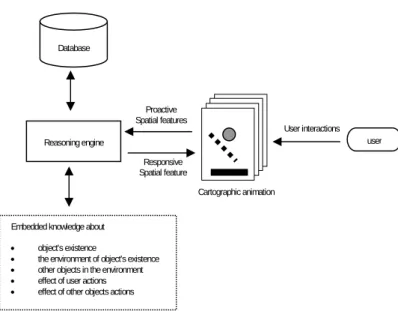
Figure 4 illustrates the concept of cognitive modeling for intelligent animations. The main thrust of the concept is to imbue spatial features with knowledge about: their behavior (existence state, movement, and trajectory), their behavior in relation to those of other features within the environment (proactive), and knowledge about how the features ought to behave and respond when acted upon by the user and other feature (responsive). Embedding these knowledge in cartographic animations increases direct user interactions and spatial data analysis tasks.
Database
Figure 4. Cognitive modeling for imbued intelligence in cartographic animations A case in meteorology
Typical meteorological examples may include tracking down a tornado forming process, where, changes in wind direction and an increase in wind speed with increasing height creates an invisible horizontal spinning effect on the lower atmosphere. Each of these entities: wind speed, wind direction, thunderstorms can be animated separately and, or superimposed over each other to study their inter-relationships. When animating this process, unless there exist frames depicting the already formed tornado, it will take a domain expert's eye to detect the formation and the existence of the tornado. With historical or recorded data, this doesn't pose much of a problem. It only becomes crucial when dealing
Embedded knowledge about
object's existence
the environment of object's existence
other objects in the environment
effect of user actions
effect of other objects actions
User interactions user Responsive Spatial feature Proactive Spatial features Reasoning engine Cartographic animation
with forecasts prediction. In such a case, the animation is expected have knowledge about the effects of interacting with other independent entities and the appropriate actions that result out of the interaction. A specific example is that of building up on the phenomena of a storm. The basic building up phenomena for a storm are rain and wind. Of these, the phenomena of rain arises when the weather attributes of temperature, humidity and pressure combine under certain conditions or constraints.
Previously recorded frames of the weather attributes can be used to create animations that depict the storm phenomena. Thus by animating individual frames underlying attribute patterns can be identified. The use of a composite frame that consist of transparently overlaid weather attributes can similarly play the same role. The common controlling factor in these displays is on temporally synchronizing the individual weather attributes.
In exploratory tasks that involve weather forecast predictions, and where one only has the weather attributes (temperature, pressure, humidity) to start with, it becomes difficult to say pinpoint the occurrence of a storm phenomena. But with an inference mechanism embedded within the weather attributes, and with knowledge about the specific conditions or constraining factors (threshold attribute values, location, time) then the storm formation process can be automated and likewise animated during the process. Embedded within the inference mechanism are properties that: allow an attribute frame to autonomously control its own actions and internal state, interact with other attributes and, or user when conditions are appropriate or when acted upon, and be able to understand their environment and be able to respond to any changes that may take place in it.
CONCLUSIONS
We have ascertained the place and usefulness of interactivity in visual products, specifically on how interactivity improves a user's functional performance during visual exploration of spatial data. We have also reviewed the conventional frame based animations techniques and highlighted how its nature inhibits interactivity. Interactivity increases as the spatial features represented within the frames become more autonomous. In this state the feature's individual characteristics can be steered and tracked and its relationship and effect to other features can be ascertained. Embedding an inference mechanism within an animation plays a major role in modeling and simulation processes of the future states of spatio-temporal phenomena. Adding domain knowledge to animations relieves expert users of low level tasks that can at times be distracting and constrained by the dynamic nature of the animations. This lessens the chance of overloading the users working memory and leaves them to concentrate on higher level issues in problem solving and decision making. It similarly ensures that novice users understand and make better
judgements of the patterns, trends and anomalies that they perceive, by depicting cause and effect scenes.
Future research efforts should be able to clarify on the additional processing demands that result from using animations, both in terms of memory overload and the possible strain on the human visual system that may arise when interacting with dynamic sequences of complex graphic images involving simultaneous variation on several parameters.
REFERENCES
Ahlberg, C., and Shneiderman, B. (1994).Visual Information Seeking: Tight coupling of dynamic query filters with starfield displays. ACM CHI '94 Conference Proceedings, Boston, MA; 313-317.
Beier, E. Tcl meets 3D - Interpretative access to object-oriented graphics. Proceedings: Tcl/Tk Workshop '94, 1994.
Cartwright, W., 1996, New media and it's application to the production of map products: In Computers and Geosciences;.23(4), 447-456.
Claramunt, C. (1995). Managing Time in GIS: An event-oriented approach. In Recent Advances in Temporal Databases, Clifford J. and Tuzhilin A. Eds, Springer-Verlog, 23-42.
Dibiase, D., Reeves, C., MacEachren, A.M., von Wyss, M., Krygier, J.B., Sloan, J.L., and Detweiler, M.C. (1994). Multivariate display of geographic data: applications in earth system sciences. MacEachren, A.M., and Taylor, D.R.F., eds., Visualization in Modern Cartography: Pergamon, Oxford; 287-312.
Dix, A. and Ellis, G. (1998). Starting simple - adding value to static visualisation through simple interaction. In proceedings of Advanced Visual Interfaces -AVI' 98, Castello, Cinquecentesco, L'Aquila, Italy. (eds) Eds. T. Catarci, M. F. Costabile, G. Santucci
and L. Tarantino. L'Aquila, Italy, ACM Press; pp. 124-134.
Foley, J., van Dam, A., Feiner, S. and Hughes, J. (1990) , Computer Graphics - Principles and Practice, Addison Wesley.
Funge, J., Tu, X., and Terzopoulos, D., (1999). Cognitive Modeling: Knowledge, Reasoning and Planning for Intelligent
Characters, Proceedings of SIGGRAPH 99, Los Angeles, CA.
Harrower, M., and A. M. MacEachren (1998). "Exploratory Data Analysis and map animation: Using temporal brushing and focusing to facilitate learning about global weather." Paper presented at the International Cartographic Association Commission on Visualization Workshop, Warsaw, Poland, May 21-23, 1998; published on the Commission web site at: www.geovista.psu.edu/VisEarth/papers.html.
Huizing, C. and Barenbrug, B. (1997). Interactive animation needs components. Leavens, G.T. and Sitaraman, M. (eds). In the proceedings of foundations of component-based system workshop, Zurich, Switzerland.
Kraak, M.J. (1998). Exploratory Cartography : Maps as tools for discovery, Inaugural address, ITC JournalThe Netherlands.
MacEachren A.M. and Kraak M.J. (1997) Exploratory cartographic visualization: advancing the agenda. Computers and Geosciences, 23( 4);335-344.
Monmonier, M. (1990) Strategies for the visualization of geographic time-series data. Cartographica 27;30-45.
Monmonier, M. and Gluck, M. (1994). Focus groups for design improvement in dynamic cartography. In Cartography and Geographic Information Systems,21(1);37-47.
Ogao, P.J. (1999). Visualization of Urban Growth Using Temporal Cartographic: Animation: A proposed case study of Nairobi, Kenya. Proceedings of the 19th International Cartographic Conference, Ottawa;138-144.
Peterson, M. P., 1995, Interactive and animated cartography: Prentice Hall, Englewood Cliffs, New Jersey, 257 p.
Peterson, M.P. (1999). Active legends for interactive cartographic animation. International journal for Geographical Information Science, special issue on Visual Exploration of Spatial Data. 13(4)
Shepherd, I.D.H., 1995, Putting time on the map: Dynamic displays in data visualization and GIS: Fisher, P.F., ed., In Innovations in GIS 2: Taylor & Francis, London;169-187.
Shneiderman, B. (1983). Direct Manipulation : A step beyond programming languages. IEEE computer;57-69.
Thomas, B. H. and Demczuk, V. (1999). Evaluation of Animation Effects to Improve Indirect Manipulation. In Technical Report
ACRC-99-005. Advanced Computing Research Centre School of Computer and Information Science, University of South Australia. Tweedie, L., (1995). Interactive visualization artificats : how can abstractions inform design? In people and computers x,
Proceedings of the HCI'95 conference, Huddersfield. M.A.R., Kirby, A.J. Dix, and J.E. Finlay (eds); 247-265.
URL's
URL 1 BBC Weather centre
http://www.bbc.co.uk/weather/satellite.shtml
URL 2 ICAVis Website