Let there be daylight? Assessing actual daylighting performance of a
Let there be daylight? Assessing actual daylighting performance of a
classroom in use
classroom in use
PLEASE CITE THE PUBLISHED VERSION PUBLISHER
BEHAVE 2016
VERSION
AM (Accepted Manuscript)
PUBLISHER STATEMENT
This work is made available according to the conditions of the Creative Commons Attribution-NonCommercial-NoDerivatives 4.0 International (CC BY-NC-ND 4.0) licence. Full details of this licence are available at:
https://creativecommons.org/licenses/by-nc-nd/4.0/
LICENCE
CC BY-NC-ND 4.0
REPOSITORY RECORD
Drosou, Nafsika, Victoria Haines, John Mardaljevic, and Eleonora Brembilla. 2019. “Let There Be Daylight? Assessing Actual Daylighting Performance of a Classroom in Use”. figshare.
LET THERE BE DAYLIGHT?
ASSESSING ACTUAL DAYLIGHTING PERFORMANCE OF A
CLASSROOM IN USE
Nafsika Drosou1*, Victoria Haines2, John Mardaljevic1 and Eleonora Brembilla1
1: School of Civil and Building Engineering Loughborough University
Loughborough LE1 3TU, UK
e-mail: [email protected], [email protected], [email protected] 2: Loughborough Design School
Loughborough University Loughborough LE1 3TU, UK e-mail: [email protected]
Keywords: daylight, schools, real world research, user behaviour, High Dynamic Range imaging, lighting energy
Abstract
Daylight is a non-depleting energy source with the potential to reduce building energy consumption and contribute to the health and wellbeing of building occupants. The increased reliance on daylight simulation tools, for the prediction of indoor daylighting performance, calls for sound benchmarking based on data from actual spaces in-use. However, due to practicalities such data are limited especially in the case of classrooms. The mixed method study presented here took a user-centred approach to investigate the relationship between three aspects of evidence collected from the real world: monitored illumination data; observed user interactions with the space and its systems (visual display technologies, electric lights, blinds); and user subjective responses. A UK classroom was used as a case study and was monitored for three months between September and December. High Dynamic Range (HDR) imaging was the technique used to provide (at a 10-minute interval) physical measurements of the luminous environment and data on the actions users took to maintain or improve visual comfort. A questionnaire
(n=117) recorded the students’ subjective responses to the luminous environment.
Findings from the combined study of these datasets lead to a deeper understanding of the occupants’ current visual needs and their perception of daylight, which is necessary for the development of realistic daylighting performance – and subsequently whole-building energy predictions.
2
1. INTRODUCTION
Daylight is a non-depleting energy source with the potential to reduce lighting energy and contribute to the health and wellbeing of building occupants. In an effort to improve daylighting performance on the way towards energy efficient schools, in 2013 the UK Education Funding Agency (EFA) made climate-based daylight modelling (CBDM) a mandatory requirement for the evaluation of designs submitted to the £6bn Priority Schools Building Programme [1]. On the one hand, this move signals the increased reliance on daylight simulation tools and metrics that involve year round performance. However, it amplifies the recorded need for actual daylighting performance data of occupied spaces [2, 3, 4, 5], which are to form the basis for sound benchmarking and possibly even the validation of simulation predictions.
As both actual and simulated performance outcomes are affected by building user behaviour (such as user interaction with blinds and choice of user-models as simulation input), it follows that evidence of the users’ subjective responses and actions to maintain or improve visual comfort are equally essential for these predictions to represent real world performance of classrooms in use. The stakes for agreement are high due to the twofold impact of daylight on building energy consumption, in terms of the lighting energy demand and the indirect effect on thermal performance.
Classrooms pose an interesting case. The variability that characterises the conditions to which daylight is sensitive (i.e. climate, season, time of day, location) also features in the occupants’ visual needs. Not only do various tasks with different light requirements take place at close time spans, but visual tasks in schools have also changed significantly over the last decade with the advancement of a variety of Visual Display Technologies (VDT). Furthermore, any kind of monitoring in the busy environment of a school is faced with many practicalities such as lack of space for equipment installation, interference with and security of sensors, and low tolerance to any form of class disruption.
The mixed method study presented in this paper overcomes many of these obstacles and, for a UK classroom, relates monitored illumination data to observed user interactions with the classroom and its systems (VDTs, electric lights, blinds). Monitoring of luminous quantities is achieved by means of a technique based on High Dynamic Range (HDR) imaging [6]. Moreover, the study is supplemented by self-reported subjective assessments of daylight by student occupants who completed a questionnaire on numerous occasions (n=117). Findings from the combined study of these datasets are leading to a deeper understanding of the occupants’ current visual needs and their perception of daylight in real world classrooms in use. This is key for the evaluation of daylight metrics that quantify and qualify daylight indoors in a manner that is in accord with the human experience of daylight. Thus setting the foundation for user-centred benchmarks and, ultimately, the development of evidence based user-models for simulation tools in order for their predictions to be realistic.
3
2. LITERATURE REVIEW
Previous research on real-world daylighting performance has focused primarily on that attributed to the building structure and its architectural elements [7, 8], while user perception of light has mostly been studied in controlled environments (i.e. laboratories) under artificial light [9, 10, 11]. The studies that have tackled actual operational daylighting performance, as shaped by the users’ interaction with the building or its systems, with user subjective responses usually only covered in office buildings [3, 12, 13].
In education environments daylight research has been altogether rather more sparse [4, 5] and due to the change in teaching methods (e.g VDTs, smartboards, tablets, etc.), elements of these studies no longer apply. Apart from the practical difficulties of monitoring daylight levels in occupied classrooms, in contrast to air temperature and CO2 levels
which are continuously monitored by building management systems in modern school buildings, there is essentially no routine collection of any measure that relates to the luminous environment, i.e. luminance or illuminance [14]. Thus, a gap is identified in our knowledge of what the current visual needs of modern classrooms are; how occupants satisfy them, in the context of interacting with the design and the available systems; and what the motivations at the centre of these actions are.
3. METHODOLOGY
This study covers the period between the fall equinox (September 23) and the northern hemisphere winter solstice (December 21) of 2015. This section describes the acquisition and development of three datasets: measurements of luminance (brightness); observed occupant behaviour in terms of classroom occupancy, use of VDTs, electric lights and blinds; and, students’ self-reported subjective evaluations of the luminous environment.
3.1. Case study classroom
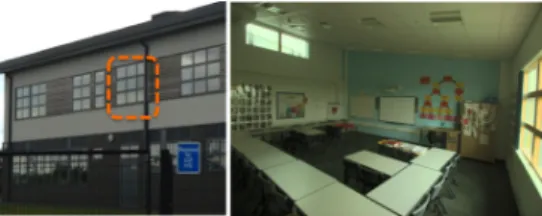
The research setting comprised a secondary school classroom in the East Midlands region of the UK (coordinates: 52º 45’N and 0º 53’W) referred to in this study as M5 (Fig. 1). The selection of this classroom was based on the consensus among teachers on which they thought was one of the best daylit classrooms of the school, in order to provide a starting point for investigating the range of factors at play in characterising the daylighting performance of a space. A short survey sent by email to all 36 teachers facilitated the
selection. The survey resulted in a 50% participation rate (nt=18) and produced a small se-
4
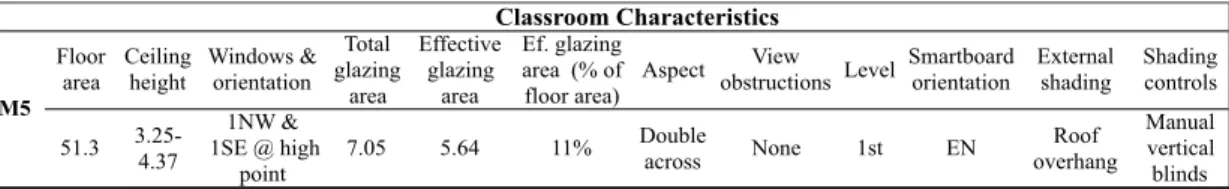
lection of ‘worse’ and ‘best’ characterised classrooms, from which M5 was chosen as best daylit for its classroom design characteristics (Table 1) and function i.e. where sit-down weekly rotating classes were held (studio, laboratory and workshop spaces were excluded). The subjects taught in this space were social and political science, as well as psychology.
Table 1: Case study characteristics
Floor area Ceiling height Windows & orientation Total glazing area Effective glazing area Ef. glazing area (% of floor area)
Aspect obstructionsView Level Smartboard orientation External shading Shading controls 51.3 3.25-4.37 1NW & 1SE @ high point 7.05 5.64 11% Double across None 1st EN Roof overhang Manual vertical blinds Classroom Characteristics M5
Throughout the monitoring period, classes were held daily from 9:00am to 3:30pm except for the week of October 19-25 (half term holiday). The classroom was double aspect on opposite walls (North and South), the South window being a clerestory (a window high above eye level, that serves to admit light into the space without adding view to the exterior). The room presented a slanted ceiling that allowed for a height higher than normal at the South side of the room, where the clerestory window was situated.
The electric lights were on the ceiling and were operated manually by means of two light switches; one for the three light fixtures closest to the smartboard (an interactive whiteboard with integrated projector) and another for all other fixtures (the one closest to the North window was defective and not operational). A motion sensor caused the lights to automatically switch off when no motion was detected for about 20 minutes. Both windows were fitted with blue manual vertical blinds and a smartboard was used as the main focal point of teaching. Before commencement of the study, ethics considerations were addressed and approval was granted by school stakeholders and the authors’ university.
3.2. Luminous environment monitoring
HDR imaging has been used in numerous lighting and daylighting studies over the last decade as a means of making physical measurements of the luminous environment. HDR images contain a measure of luminance at each pixel enabling the association with a person’s subjective assessment of brightness in a scene. The monitoring setup consists of a camera, a wide-angle lens and a processor for automating the image capture and storage, as well as items that secure the equipment into place and prevent damage and interference (Fig. 2). The
5
complete methodology followed by the current study is described in detail in Drosou et al. [15]. During the monitoring period, an HDR image was taken every 10 minutes from 8:00 to 15:50 daily (including weekends). This resulted in 4320 HDR images taken between 8:00 on September 23 and 15:50 on December 21. External solar radiation data were collected by means of a BF5 Sunshine Sensor by Delta-T, located on the roof of a building about 12km West of the school.
3.3. Behaviour monitoring
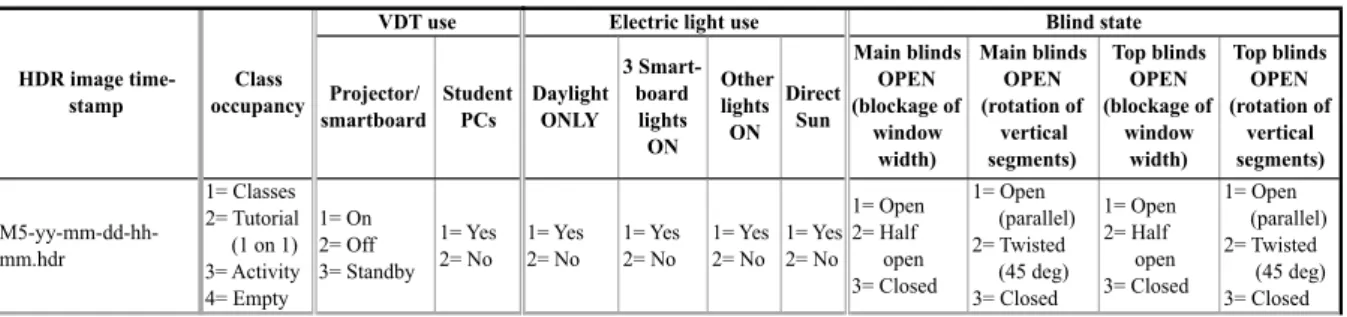
The 4320 HDR images were viewed manually to identify the results of user behaviour (use of the VDT, lights and blinds) over the three month monitoring period, with a 10-minute resolution. Data derived from observation of each image were used to populate a matrix with the format shown in Table 2, in order to facilitate statistical analysis of the compiled behaviour data.
Table 2: Matrix for coding observed user behaviour data from HDR images
Projector/ smartboard Student PCs M5-yy-mm-dd-hh-mm.hdr 1= Classes 2= Tutorial (1 on 1) 3= Activity 4= Empty 1= On 2= Off 3= Standby 1= Yes 2= No VDT use Class occupancy HDR image time-stamp Daylight ONLY 3 Smart-board lights ON Other lights ON Direct Sun Main blinds OPEN (blockage of window width) Main blinds OPEN (rotation of vertical segments) Top blinds OPEN (blockage of window width) Top blinds OPEN (rotation of vertical segments) 1= Yes 2= No 1= Yes 2= No 1= Yes 2= No 1= Yes 2= No 1= Open 2= Half open 3= Closed 1= Open (parallel) 2= Twisted (45 deg) 3= Closed 1= Open 2= Half open 3= Closed 1= Open (parallel) 2= Twisted (45 deg) 3= Closed Blind state Electric light use
Class occupancy and VDT use were divided into modes in order to differentiate classroom activities according to the visual needs associated with them. The state of electric lights and blinds, as a result of their use, was also recorded, to identify the occupants’ actions to maintain or improve visual comfort. Regarding the former, the presence of direct sunlight indoors was also noted along with the modes concerning the electric light controls and configuration. For the manual vertical blinds, the choice of modes reflected the option to open/close them across the horizontal span of the window, as well as to rotate each of the blinds segments.
3.4. Self-reported subjective responses
A one-page questionnaire addressed to the students who regularly used the case study classroom was developed and distributed by the teachers during class hours. Teachers were consulted in order for the questionnaire language to be suitable to the students’ age (16-18yrs old). The questionnaire included: general demographic questions; present position in the classroom; questions on general lighting conditions, view, light reflection issues and ability to work with specific surfaces (smartboard, laptop screen, desk).
In an effort to record the students’ subjective responses to the luminous environment as it is shaped by their real-world needs, the teachers were instructed not to alter the state of electric lights nor blinds solely for the completion of the questionnaire. For each classroom the
6
questionnaire was completed eight times from October 6 to December 3, 2015. The total
sample for the classroom was n=117 (nmin=9 and nmax=19 for the eight sub-samples).
4. MAIN RESULTS
The results of the study are presented in this section as follows: 1) luminance mapping for the duration of the monitored period and luminance percentiles of the front wall during the completion of the questionnaire, 2) patterns that characterise the visual needs of classroom users (occupancy and VDT use) and patterns of occupant behaviour (electric light and blinds use), 3) average rating of the general light level of the classroom during the questionnaire completion.
4.1. HDR measurements
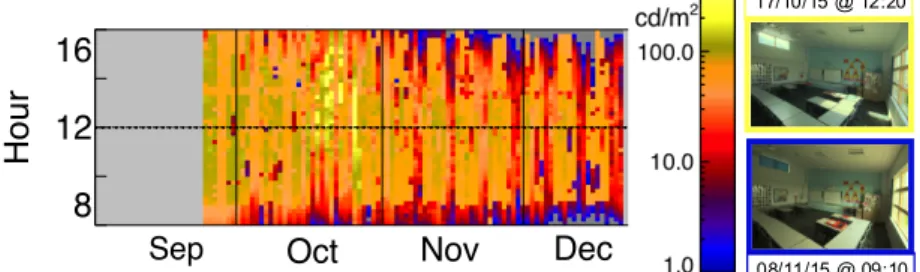
The set-up successfully captured and recorded all 4320 HDR images. Luminance data from the images were analysed with the IDL® programming code. Figure 3 presents the average luminance value of each entire HDR image in a ‘temporal map’ i.e. graphed as the occurrence during the day (vertical) against the day number (horizontal). Also depicted in the figure are HDR images that serve as examples of the luminous environment for the maximum (yellow) and minimum (blue) average luminance values. The primarily north daylit first floor classroom did not receive direct sunlight from the main window. As suggested by the image of Figure 3 with the yellow border, ingress of direct sunlight was due to the south clerestory window.
17/10/15 @ 12:20
08/11/15 @ 09:10
M1 Average pixel HDR luminance 2015
Jan Feb Mar Apr May Jun Jul Aug Sep Oct Nov Dec
2015 0 4 8 12 16 20 24 Hour cd/m2 1.0 10.0 100.0
M5 Average pixel HDR luminance 2015
Sep Oct Nov Dec
2015 8 10 12 14 16 Hour cd/m2 1.0 10.0 100.0
M1 Average pixel HDR luminance 2015
Jan Feb Mar Apr May Jun Jul Aug Sep Oct Nov Dec 2015 0 4 8 12 16 20 24 Hour cd/m2 1.0 10.0 100.0
M1 Average pixel HDR luminance 2015
Jan Feb Mar Apr May Jun Jul Aug Sep Oct Nov Dec
2015 0 4 8 12 16 20 24 Hour cd/m2 1.0 10.0 100.0
M1 Average pixel HDR luminance 2015
Jan Feb Mar Apr May Jun Jul Aug Sep Oct Nov Dec
2015 0 4 8 12 16 20 24 Hour cd/m2 1.0 10.0 100.0
M1 Average pixel HDR luminance 2015
Jan Feb Mar Apr May Jun Jul Aug Sep Oct Nov Dec
2015 0 4 8 12 16 20 24 Hour cd/m2 1.0 10.0 100.0
Figure 3: Temporal map of monitored luminance data with examples of HDR images representing the brightest (yellow) and darkest (blue) graph colours.
The physical measure of luminance closely relates to the human perception of brightness
[16]. Human visual comfort and how it relates to the luminous environment is not yet
fully understood, particularly so for predominantly daylit spaces [17]. However, it has been concluded for studies in a controlled environment that “luminance-based metrics were more capable than illuminance-based metrics for fitting the range of subjective responses to questionnaire items pertaining to visual preference” [18]. Visual comfort can depend on either or both of relative and absolute levels of luminance in a scene in addition to directional factors. A first step to quantifying particulars of the luminous environment (as ‘seen’ by the camera) is to delineate specific key surfaces in the space, and then extract percentile profiles of the luminance extracted from the HDR image. Various
7
metrics can then be calculated in order to associate measured luminance to users’ subjective responses [18].
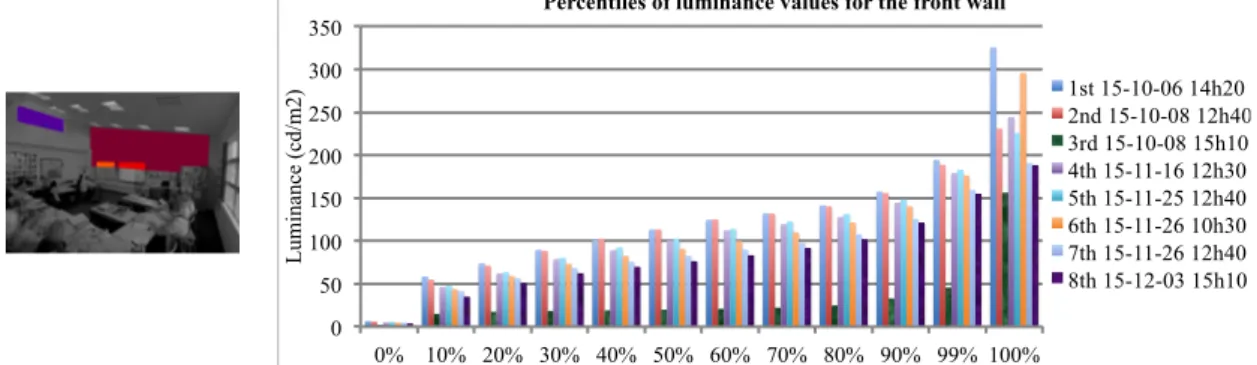
For the image shown in Figure 4, the key areas shaded in colour are: the two whiteboards (i.e. task focus areas); the background wall area; and, the clerestory window area. Decile values of the luminance in each area covering the range 10% to 100% were determined from the HDR image. The first stage of the evaluation presented here concerns only the luminance profiles for the front wall from HDR images taken during each of the eight times the questionnaire was completed. Note, the 0% and 100% values of the graph of Figure 4 are the minimum and maximum pixel luminance respectively for each HDR image. Additionally, the 99% percentile value was included since a significant difference between values at 99% and 100% indicates that very high luminance pixels occupy a very small proportion of the overall image..
The lowest luminance values occurred the third time the questionnaire was completed, which was the only among the eight not utilising any electric lights, while the second lowest value (eighth) at the time of the lowest recorded external illuminance. Also, examining the average luminance from HDR images when the classroom was lit solely by daylight and with regard to the corresponding external illuminance levels, it was found that instances with clear blue skies and a high component of external direct sunlight caused the average luminance to be high, although the general brightness of the indoor scene was less than that produced under a slightly dull sky.
R1 Lum 10 100 1000 10000 0 50 100 150 200 250 300 350 0% 10% 20% 30% 40% 50% 60% 70% 80% 90% 99% 100% L um ina nc e (c d/ m 2)
Percentiles of luminance values for the front wall
1st 15-10-06 14h20 2nd 15-10-08 12h40 3rd 15-10-08 15h10 4th 15-11-16 12h30 5th 15-11-25 12h40 6th 15-11-26 10h30 7th 15-11-26 12h40 8th 15-12-03 15h10
Figure 4: Average luminance of four key surface areas in false colour (left image) and graph of luminance value percentiles for the background front wall (maroon area) for the 8 occurrences of the questionnaire completion.
4.2. User interaction with the classroom and its systems
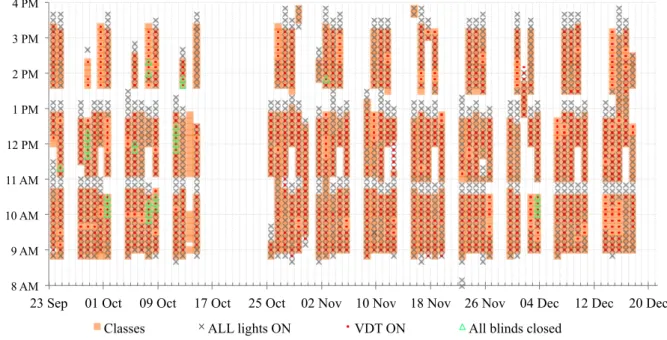
The extraction of behaviour data from each HDR image resulted in Figure 5. Tutorials, occupants in transition (before and after class), projector on standby mode, laptop as well as individual window blinds and electric light switch use, took place less than 4% of the monitoring duration, so for presentation purposes were grouped together under their respective category (classes, VDT use, blinds and electric lights). Classes were held 35 % of the monitored time. VDTs were used for 81% of teaching hours. Of this, projector use accounted for 96% (on standby mode another 3%) and laptop use 1%. Electric lights remained on for 38% of the monitored time and 86% of teaching hours. As Figure 5
8 8 AM 9 AM 10 AM 11 AM 12 PM 1 PM 2 PM 3 PM 4 PM
23 Sep 01 Oct 09 Oct 17 Oct 25 Oct 02 Nov 10 Nov 18 Nov 26 Nov 04 Dec 12 Dec 20 Dec
Classes ALL lights ON VDT ON All blinds closed
Figure 5: Temporal map of occupancy, VDT, blinds and light use
suggests, lights were never turned off manually, but occupants relied on the automatic switch-off instead. Additionally, in most cases (97%) both light switches were switched on. During VDT use, electric lights were on for all but 16% of the time.
The top window blinds were shut throughout the monitored period except for October 15 (8:00) to 26 (11:00), during which no classes were held between October 16-25. In this period these blinds were rotated open, allowing direct sunlight to enter the space and a small part of the sky to be captured in the HDR scene. However, even when these blinds were completely closed, direct sunlight around the perimeter of the blinds struck through and appeared as spots reflecting on the desks at the far back of the classroom. The blinds of the main window were open for all but 2% of teaching hours (indicated in green in Fig 5); during this 2% of the time, all blinds were shut and the projector was on, along with all electric lights. Table 3 shows the state of the systems for the eight HDR images captured during the questionnaire completions.
Table 3: State of projector, electric lights and blinds during the eight questionnaire completion occurrences. Questionnaire
completion Date & time
Projector/ smartboard 3 Smart-board lights Other lights Main blinds (across window) Main blinds (blinds rotation) Top blinds (across window) Top blinds (blinds rotation) 1st 06/10/2015 14:25 2nd 08/10/2015 12:45 3rd 08/10/2015 15:20 4th 16/11/2015 12:35 5th 25/11/2015 12:50 6th 26/11/2015 10:40 7th 26/11/2015 12:50 8th 03/12/2015 15:20 on off on on on on off off on on on on off off on on on on on on on on on on
open open closed closed open open closed closed open open closed closed open open closed closed open open closed closed open open closed closed open open closed closed open open closed closed
9
4.3. Reported visual perception of classroom
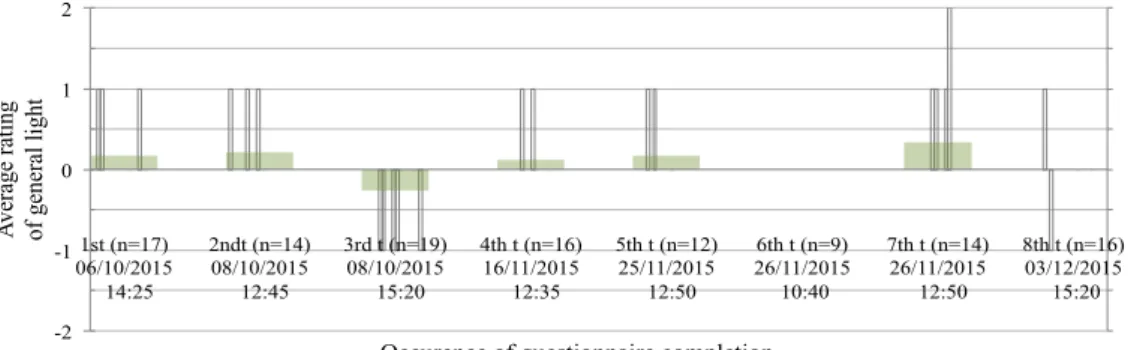
The students’ answers to the questionnaire (n=117) resulted in a 93% agreement that the view was ‘good enough’ and not distracting (90%). In terms of visibility within the classroom, 87% found that the teacher’s facial expressions were ‘very clearly visible’, while 82% that the general light level in the classroom during the questionnaire completion was ‘just about right’ for reading and writing. On the latter, out of the remaining 18%, 13% (n=15) of respondents answered that the light levels were ‘a bit too much’ and 5% (n=6) that it was ‘a bit too little’. Figure 6 presents the same data as average ratings of responses for every time the questionnaire was completed with the corresponding sample size. Positive ratings involve the notion that light levels were more than adequate, which was the case for five of the eight times the questionnaire was completed. Zero ratings pertain to users finding the general light ‘just about right’. Note that the only negative average rating occurred during the third time the questionnaire was completed, which was also the only time electric lights were not in use. Interestingly and although it did not result in a negative average rating, the single other negative opinion occurred at the eighth questionnaire completion, at the lowest recorded external illuminance value. -2 -1 0 1 2 1st (n=17) 06/10/2015 14:25 2ndt (n=14) 08/10/2015 12:45 3rd t (n=19) 08/10/2015 15:20 4th t (n=16) 16/11/2015 12:35 5th t (n=12) 25/11/2015 12:50 6th t (n=9) 26/11/2015 10:40 7th t (n=14) 26/11/2015 12:50 8th t (n=16) 03/12/2015 15:20 A ve ra ge ra ting of ge ne ra l l ight
Occurence of questionnaire completion
Figure 6: Average rating (green) of users’ opinion on the general light level of the classroom while completing the questionnaire. The positive averages pertain to too much light and the black lines to individual responses.
5. DISCUSSION
Efforts to reduce energy demand in buildings are accompanied by the underlying risk of compromising the occupants’ health and wellbeing. The use of metrics that have the potential to be benchmarked against occupant satisfaction could prevent compromises in visual comfort and maximise the physiological and psychological benefits of daylight. This becomes especially important in the case of children and teenagers who spend a large part of their life in classrooms and are at various stages of their development. Luminance-based metrics are user-centred and simple in that the relevant concepts are experiential (i.e. brightness contrast) and can be calculated with basic statistics. Furthermore they rely on data from HDR imaging which has proven robust in the current study (data retrieved for every one of the 4320 remote HDR captures that were programmed) as well as others of longer duration [15,18].
10
consider the third occurrence of the questionnaire completion. The electric lights were off, the projector was in use (Table 2) and the luminance levels (Figure 4) were low (10%=16
cd/m2, 50%=20 cd/m2, 99%=56 cd/m2). These conditions received the lowest average
rating from the students (Fig. 6) and it was the only occurrence among the questionnaire completions where the occupants found the general amount of light to be ‘a bit too little’ (-0.26, n=19). However, no relationship can be found between projector use (off during 2nd, 7th, 8th occurrence) and the occupants’ perception of light; during these times when the projector was not in use, the electric lights were on and the occupants’ average opinion ranged from ‘good enough’ (0, n=9) to ‘a bit too much’ (+0.33, n=14).
Further work needs to be undertaken in order to explore the different ways in which elements of the existing datasets can be combined. Integrating the quantitative and qualitative information from this classroom may enable the identification of behaviour triggers and a better understanding of their nature, whether it is attributed to individual preferences, group dynamics or teaching methods. Along these lines, it is interesting to note the closing of the top window blinds (opened during the one-week fall-break by maintenance staff) from viewing the HDR images of October 26 at 11:00 and 11:10. The first HDR image shows an empty classroom during the break with direct sunlight through open blinds affecting a third of the desks and chairs. The next image is that of on-going teaching with use of the projector and the blinds completely shut. These blinds were never opened again until the end of the monitoring period in December.
All around, besides the modest cost of equipment that comprised the monitoring set-up, the methodology followed was also highly time consuming due to the transformation of observed behaviour data from each HDR image into spreadsheet form, so that it could then be statistically analysed. This limits the amount of data that can be reasonably analysed, thus limiting the duration of study and number of classrooms involved. Furthermore, securing and maintaining the buy-in of the range of school stakeholders from the Head Teacher to the cleaners and the students’ guardians took considerable time and effort. The subtlety required by ethics and privacy issues added another degree of difficulty to managing the communication aspect of such a project. Limitations common to mixed method projects, as outlined in Johnson and Onwuegbuzie [19], also apply to this work.
6. CONCLUSIONS AND RECOMMENDATIONS
This work has taken a multidisciplinary approach to the assessment of daylighting performance of an occupied UK classroom over three months. Analysis of the three datasets comprising measurements of indoor vertical luminance, user behaviour observations in terms of VDT, blinds and electric light use, as well as students’ self-reported subjective responses has identified extensive use of VDT equipment and electric lights during teaching hours. It has also revealed the reliance of occupants on the automatic switch-off function of the electric lights. With regard to blinds use, the data has shown that once regular classroom users closed the clerestory blinds these remained closed until a person external to the class changed their state.
11
The majority of classroom students rated the general light levels of the classroom as adequate over eight separate occasions of variable lighting conditions. However, opinions expressing that light levels were inadequate occurred only when the electric lights were not in use on a dull day. For the cases where electric lights were on, an absolute relationship could not be established between the state of the projector nor the levels of external illuminance and the subjective responses reported.
The method used has been successful in recording the luminous environment in a classroom and people’s periodic subjective responses to it, despite the intensive nature of the approach. Long-term data from actual classrooms in-use can provide a unique insight into how user actions affect daylighting performance and the motivation behind their actions. This will benefit the development of realistic daylighting, and effectively, energy performance predictions for schools. Further work is being undertaken by the authors in order to expand monitoring to classrooms with a range of building characteristics and to integrate the findings of the three datasets at greater depth.
ACKNOWLEDGEMENTS
Ms. Drosou acknowledges funding support from the EPSRC LoLo Doctoral Training Centre in Energy Demand and the involvement of the case study school; Dr Haines and Professor Mardaljevic acknowledge the support of Loughborough University and Ms. Brembilla that of EPSRC and industrial partner Arup (London, UK).
REFERENCES
[1] EFA (Education Funding Agency), “EFA daylight design guide”, Retrieved from
https://www.gov.uk/government/uploads/system/uploads/attachment_data/file/388373/ EFA_Daylight_design_guide.pdf, (2014).
[2] J. Mardaljevic, Climate-based daylight modelling and its discontents, CIBSE
Technical Symposium, 2015, London, UK, (2015), pp. 1–12.
[3] K. Konis, “Effective daylighting: evaluating daylighting performance in the san
francisco federal building from the perspective of building occupants”, Indoor Environmental Quality (IEQ), Center for the Built Environment, Center for Environmental Design Research, UC Berkeley, (2012).
[4] W. Wu and E. Ng, “A review of the development of daylighting in schools”, Lighting
Research and Technology, Vol. 35(2), pp. 111–125, (2003).
[5] K. Parpairi, N. Baker, K. Steemers, R. Compagnon, “The luminance differences index:
a new indicator of user preferences in daylit spaces”, Lighting Research and
Technology, Vol. 34(1), pp. 53–68, (2002).
[6] M. Inanici, “Evaluation of high dynamic range photography as a luminance data
acquisition system”, Lighting Research and Technology, Vol. 38(2), pp. 123–136,
(2006).
[7] M. Winterbottom and A. Wilkins, “Lighting And Discomfort In The Classroom”,
Journal of Environmental Psychology, Vol. 29(1), pp. 63–75, (2009).
12
photometry in scholastic environment”, Energy and Buildings, Vol. 43(10), pp. 2843– 2849, (2011).
[9] K. G. Van Den Wymelenberg, M. N. Inanici, P. W. Johnson, “The effect of luminance
distribution patterns on occupant preference in a daylit office environment”, Leukos, Vol. 7(2), pp. 103-122, (2010).
[10] P.R. Boyce, J.A. Veitch, G.R. Newsham, C.CJones, J. Heerwagen, M. Myer, C.M.
Hunter, “Occupant use of switching and dimming controls in offices”, Lighting
Research and Technology, Vol. 38(4), pp. 358-376, (2006).
[11] J.A. Veitch and G.R. Newsham, “Preferred luminous conditions in open-plan offices:
Research and practice recommendations”, Lighting Research and Technology, Vol. 32, pp. 199-212, (2000).
[12] J. Day, J. Theodorson, K. Van Den Wymelenberg, “Understanding controls, behaviors
and satisfaction in the daylit perimeter office: a daylight design case study”, Journal of Interior Design, Vol. 37(1), pp.17–34, (2012).
[13] A. Galasiu and J. Veitch, “Occupant preferences and satisfaction with the luminous environment and control systems in daylit offices: a literature review”, Energy and Buildings, Vol. 38(7), pp. 728–742, (2006).
[14] J. Mardaljevic, E. Brembilla, N. Drosou, Illuminance-proxy high dynamic range
imaging : a simple method to measure surface reflectance, 28th International Commission on Illumination (CIE) Session 2015, Manchester, UK, (2015), pp. 363– 372.
[15] N. Drosou, E. Brembilla, J. Mardaljevic, V. Haines, Reality bites: measuring actual daylighting performance in classrooms, PLEA 2016 Cities, Buildings, People: Towards Regenerative Environments, LA, USA, (2016).
[16] C. Cuttle, “Brightness, lightness, and providing a preconceived appearance to the interior”, Lighting Research and Technology, Vol. 36(3), pp. 201-214, (2004).
[17] W.K. Osterhaus, “Discomfort glare assessment and prevention for daylight
applications in office environments”, Solar Energy, Vol. 79(2), pp. 140-158, (2005).
[18] K. G. Van Den Wymelenberg and M. N. Inanici, “Evaluating a new suite of
luminance-based design metrics for predicting human visual comfort in offices with daylight”, Leukos, Vol. 12(3), pp.113–138, (2016).
[19] R. Johnson and A. Onwuegbuzie, “Mixed methods research: a research paradigm