An Evaluation of Accelerated Learning
in the CMU Open Learning Initiative Course “Logic & Proofs”
Christian D. Schunn & Mellisa M. Patchan Learning Research and Development Center University of Pittsburgh May 31, 2009Table of Contents EXECUTIVE SUMMARY ... 3 THE TYPICAL INTRODUCTION TO SYMBOLIC LOGIC COURSE ... 4 SYLLABI ANALYSIS... 4 Sampling of Universities ... 4 Coding Syllabi... 5 SURVEY ANALYSES... 5 Participants... 5 Survey ... 5 RESULTS... 5 Syllabi Analyses ... 5 Survey Analyses ... 7 SUMMARY...10 IN CLASS VS. ONLINE IN LARGE COURSE STUDIES ...11 PARTICIPANTS...11 Fall 2007...11 Spring 2008...11 RESULTS...13 SUMMARY...13 SAME TIME/MORE CONTENT IN A COMMUNITY COLLEGE ...15
CONTEXT & PARTICIPANTS...15
ATTRITION RATES...15
TIME ON TASK...15
PERFORMANCE ON MIDTERM EXAMS...16
FINAL EXAM PERFORMANCE...16
SUMMARY...16
ACCELERATION FOR COMMUTER STUDENTS WITH OPTIONAL RECITATION SESSIONS ...18
CONTENT LEARNING RESULTS...18
ATTENDANCE...18
SUMMARY...19
SAME TIME/MORE CONTENT WITH HYBRID INSTRUCTION IN A UNIVERSITY...20
CONTEXT & PARTICIPANTS...20
TIME ON TASK...21
PERFORMANCE ON FINAL EXAM...21
SUMMARY...22
REFERENCES ...23
Executive Summary
CMU’s Open Learning Initiative seeks to combine expertise in the cognitive science of learning with disciplinary instructional expertise and human computer interaction to produce online learning environments that can broadly improve instruction. The course Logic & Proofs (L&P) is one such course, developed under the stewardship of Wilfried Sieg from the Philosophy Department of Carnegie Mellon University. The current report describes evaluations of L&P, specifically testing the hypothesis that use of L&P in a hybrid instructional mode (online instruction combined with reduced and strategically targeted face‐to‐face instruction) can lead to accelerated learning, either in the form of more content learning within the same amount of student time or the same content learning within a shorter time period of student time. Before beginning the evaluation experiment, we conducted a context analysis to determine the real market of the Logic & Proofs course: what kinds of universities tended to teach this overall course, what content tended be covered, and what kinds of tools for proof construction were already being used. Overall, L&P‐like content is taught in a majority of universities in the US, but with some variation by university type. Further, L&P contains some content that many courses did not cover. Thus, the applicability of the course is high, and the opportunities for acceleration via more content coverage also exist. The evaluations were conducted in two phases. First, two evaluations were conducted at a large public tier‐one institution, showing that face‐to‐face instruction produced equivalent learning outcomes to online‐only instruction. In addition, online instruction appeared to result in a much lowered attrition rate, providing efficiencies for students of another form. Second, an evaluation was conducted of accelerated learning was conducted at three institutions, each representing different types of institutions, using different forms of acceleration and evaluation logics suited to the context (e.g., random assignment to condition vs. natural experiment, more content in equal time vs. equal content in less time). One study found students at a community college were able to learn significantly more content and some content to higher performance levels using hybrid instruction compared with face‐to‐face instruction. A second study found that commuter students at a regional campus of a public university signing up for online instruction were resistant to participating in hybrid instruction and there was not a clear associated between amount of hybrid instruction and student learning. The third study found that traditional students from primarily computer science and engineering backgrounds at a national university actually showed small but significant declines in exam performance with hybrid instruction relative to face‐to‐face instruction.The Typical Introduction to Symbolic Logic Course
In order to provide a comprehensive description of the typical introduction to symbolic logic course, we examined the courses in two steps: 1) we systematically examined course syllabi and 2) we broadly surveyed those who taught symbolic logic courses.Syllabi Analysis
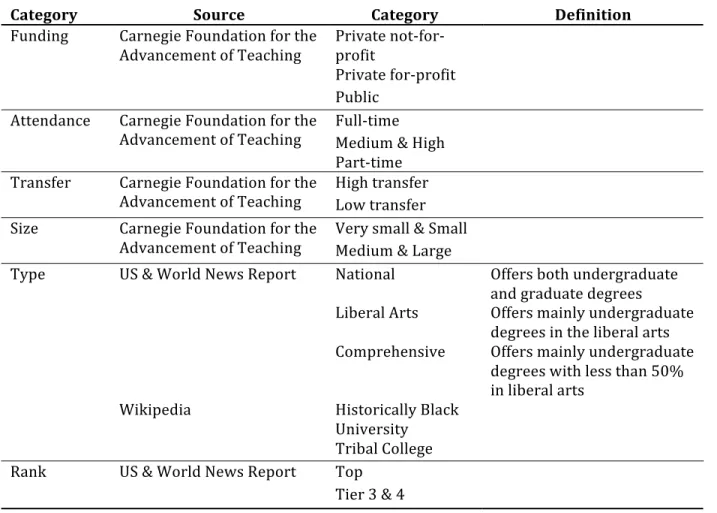
Sampling of Universities A list of universities in the United States was compiled using the database from the Carnegie Foundation for the Advancement of Teaching, US & World News Report’s America’s Best Colleges, and Wikipedia. Additional information about each school was also recorded (see Table 1). A random sample of 40 of each type of university (i.e. National, Liberal Arts, Comprehensive, HBU, and 2‐year universities) and all nine of the Tribal Colleges was collected. A total of 209 US universities were examined.Table 1. Additional information collected on each school.
Category Source Category Definition
Funding Private not‐for‐ profit Private for‐profit Carnegie Foundation for the Advancement of Teaching Public Attendance Full‐time Carnegie Foundation for the Advancement of Teaching Medium & High Part‐time Transfer High transfer Carnegie Foundation for the Advancement of Teaching Low transfer Size Very small & Small Carnegie Foundation for the Advancement of Teaching Medium & Large
Type National Offers both undergraduate
and graduate degrees Liberal Arts Offers mainly undergraduate degrees in the liberal arts US & World News Report Comprehensive Offers mainly undergraduate degrees with less than 50% in liberal arts Wikipedia Historically Black University Tribal College Rank Top US & World News Report Tier 3 & 4
Coding Syllabi For each of the 209 universities, the university website was visited to see if the university had a philosophy department and offered a symbolic logic course. Of the 114 universities that offered symbolic logic, 64 syllabi were collected either by being posted on a website or by communication with the instructor. The book, topics covered, and type of assignments were recorded using information contained in the syllabus.
Survey Analyses
Participants Members of the Association for Symbolic Logic were recruited to complete the online survey. This association is an international organization with over 1500 members from over 60 different countries. The majority of the members (52%) reside in the United States. Responses were collected from 199 participants from 39 different countries. Over half of the responders were from a philosophy department, 28% were from a mathematics department, and 13% were from a computer science department. The remaining participants were from other departments. Survey The survey consisted of 26 questions divided into four main sections. The main focus of the survey was to determine how symbolic logic courses were being taught and whether technological tools were being used. The first section asked for general information about the responder (e.g., institution name, department, country) and about the course (e.g., who offers the course, how often it is offered, how many students take it, what major and level are the typical students). The second section focused on the course specifics, such as the primary textbook and topics covered. The final question in this section asked whether educational software was used. Based on the response, the next section focused on either why educational software was not used or how the educational software was being used. The last section focused on future educational software use. If the responder indicated that he or she would be consider using a fully‐computer‐based and highly interactive course, they were directed to a final follow‐up question about how they would likely use this type of course.Results
Syllabi Analyses To begin our analyses, we wanted to know how many universities offered a symbolic logic course through the philosophy department. In order to provide an accurate estimate, we first determined how many universities offered the course from our random sample. Out of 209 universities, 55% (or more specifically 114 universities) offered a symbolic logic course. Because the percentage of universities offering the course differed depending on the type of university, we calculated a weighted estimate of universities offering symbolic logic: 1258 universities (see Table 2).Table 2. Estimated number of universities offering symbolic logic
2year Comp. HBU
Liberal
Arts National Tribal Total
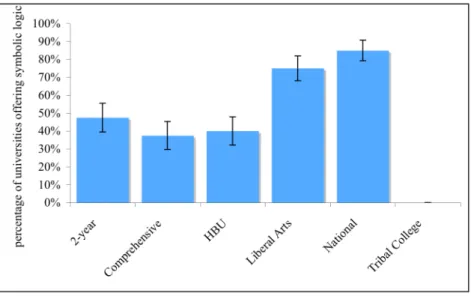
# of schools 1618 277 83 199 239 9 2425 Percentage of schools offering symbolic logic 48% 38% 40% 75% 85% 0% 55% Estimated # of schools offering symbolic logic 769 104 33 149 203 0 1258 We were also interested in what variables might predict whether the universities offered a symbolic logic course (i.e., type, level, funding, attendance, transfer, size, and rank). The Liberal Arts and National universities were more likely to offer a symbolic logic than the 2‐ year, Comprehensive, and HBU universities (see Figure 1). The public universities were more likely to offer a symbolic logic course than the private, not‐for‐profit universities, who were more likely to offer it than the private, for‐profit universities. Universities that have mostly full‐time students were more likely to offer a symbolic logic course than universities that have mostly part‐time students. Medium and large universities were more likely to offer the course than small and very small universities. Top‐tier universities were more likely to offer the course than tier 3 and 4 universities. There were no differences in level (i.e., 2‐year versus 4‐year) or transfer rates (i.e., high transfer rates versus low transfer rates).
Figure 1. Frequency of offering symbolic logic by different type of universities
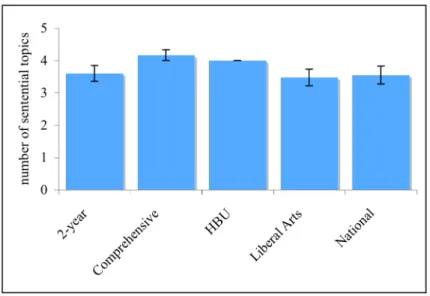
Next, the syllabi were coded to see which topics were covered. Nine of the syllabi did not include a schedule or list of topics to be covered, so they were excluded from the analyses. There were 12 possible topics of interest. Five of these topics pertained to sentential logic (i.e., syntax, symbolization, semantics, derivations, and Metamathematics), and seven of
these topics concerned predicate logic (i.e., syntax, symbolization, semantics, derivations, identity, functions, and Metamathematics). Overall, there were no differences between the types of universities in the number of topics they covered (M=7.3, SD=2.3). However, the types of universities did differ in the number of sentential logic topics covered (see Figure 2). The Comprehensive universities covered more sentential logic topics (M=4.2, SD=0.4) than any other type of university, and the HBU universities covered the second most sentential logic topics (M=4.0, SD=0). There were no differences in the number of predicate logic topics covered (M=3.6, SD=1.8).
Figure 2. Number of sentential topics covered by type of university
Finally, we examined which books were used to teach symbolic logic. Twenty‐five different books were found. Three instructors chose to not use a book, but instead to distribute their own notes. The most popular book was “A Concise Introduction to Logic” by Hurley, which was used by 13 courses. Other books used in multiple courses included: “The Logic Book” by Bergman, Moor, and Nelson (6 courses), “Language, Proof, and Logic” by Barwise and Etchemendy (5 courses), and “Introduction to Logic” by Copi and Cohen (5 courses). Survey Analyses While the intention of the survey was to determine how symbolic logic courses were being taught and whether technological tools were being used, the focus of the current analysis is to just provide a comprehensive description of the typical course. Therefore, we will only be reporting results from the first half of the survey. The first section of the survey focused on general aspects of the course (e.g., who offers the course, how often it is offered, who takes it). The second section focused on the course specifics, such as the primary textbook and topics covered. Who offers the course? According to our participants, the department most likely to offer a symbolic logic course is the philosophy course (53%). Other departments that typically offer the course include the mathematics (28%) and computer science (13%).
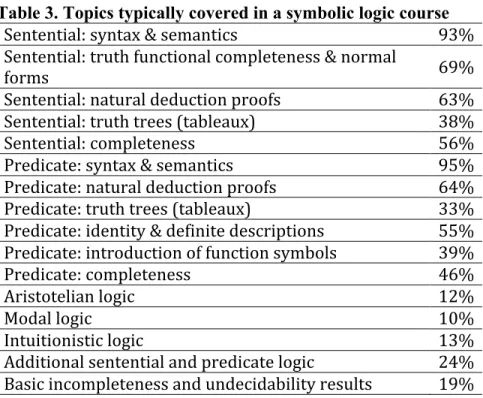
How often is the course offered? The participants had the option to choose between every semester/quarter, once every year, once every two years, or less often. Typically (63%), the symbolic logic courses are offered once a year. Less frequently, the course is offered every semester (26%) and every two years (9%). Who takes the course? In order to better understand who takes the course, we asked participants how many students typically take the course, what major are they, and what level are they. The average number of students taking a symbolic logic course is 68 (SD=83), which suggests that tens of thousands of students in the US are taking a course in symbolic logic each semester. There was a large range of responses, from as little as 2 students to as much as 550 students. Not surprisingly, most of the students taking this course were majoring in philosophy (63%), computer science (50%), or math (45%). Other majors include humanities (26%), social sciences (17%), engineering (10%), natural science (8%), and business (5%). Students are most likely to be juniors (51%). However, students at all levels take the class (sophomores 40%; freshman 39%; seniors 35%; and graduate students 7%). Textbooks: Out of the 97 participants who reported their textbook, almost 60 different textbooks were mentioned. Fourteen participants stated that they did not use a textbook, and nine of those participants used their own notes instead. The most popular textbooks used was Barwise & Etchemendy’s “Language, Proof, and Logic” (11 participants), Enderton’s “A Mathematical Introduction to Logic” (7 participants), and Bergmann, Moor, & Nelson’s “The Logic Book” (5 participants). Topics Covered: Participants indicated many different topics that they typically cover in their symbolic logic class (see Table 3).
Table 3. Topics typically covered in a symbolic logic course
Sentential: syntax & semantics 93% Sentential: truth functional completeness & normal forms 69% Sentential: natural deduction proofs 63% Sentential: truth trees (tableaux) 38% Sentential: completeness 56% Predicate: syntax & semantics 95% Predicate: natural deduction proofs 64% Predicate: truth trees (tableaux) 33% Predicate: identity & definite descriptions 55% Predicate: introduction of function symbols 39% Predicate: completeness 46% Aristotelian logic 12% Modal logic 10% Intuitionistic logic 13% Additional sentential and predicate logic 24% Basic incompleteness and undecidability results 19%
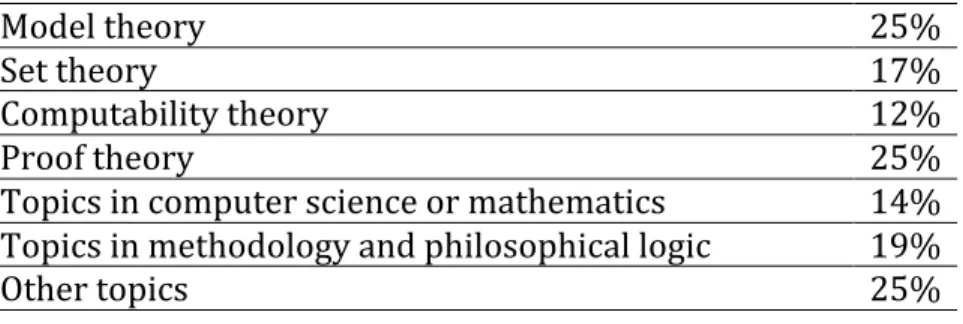
Model theory 25% Set theory 17% Computability theory 12% Proof theory 25% Topics in computer science or mathematics 14% Topics in methodology and philosophical logic 19% Other topics 25% Topic Wish List: Finally, we also asked participants whether they wished they could cover additional topics. Only half of the participants responded that they would like to cover additional topics. These additional topics were categorized into one of nine different groups: 1) Additional sentential and predicate logic, 2) Basic incompleteness and undecidability results, 3) Model theory, 4) Set theory, 5) Computability theory, 6) Proof theory, 7) Topics in computer science or mathematics, 8) Topics in methodology and philosophical logic, and 9) Other topics (see Table 4).
Table 4. Topics wish list
Additional sentential and predicate logic 12% Basic incompleteness and undecidability results 18% Model theory 8% Set theory 4% Computability theory 11% Proof theory 16% Topics in computer science or mathematics 7% Topics in methodology and philosophical logic 23% Other topics 12% Difficulties in Teaching: Participants described many difficulties that they have encountered while teaching these materials. The most common difficulties included ‘a diverse student background with a wide range of abilities’ (16%), ‘students have weak mathematical/ logical background’ (15%), and ‘students are not motivated and do not come prepared’ (15%). Some of the participants indicated that certain topics are specifically difficulty, such as formal reasoning (e.g., natural deduction, proofs) and formal language (e.g., symbolization, translations). Use of Educational Software: Most of the participants (81%) said they did not use educational software in this type of course. Many reasons were given, but the most popular explanations included ‘software is not useful—don’t like the software—don’t need the software’ (28%) and ‘no time to learn the software—it distracts from the materials’ (15%). Several participants indicated that they would be willing to use the software if certain conditions were met, such as ‘if the software could handle specific functions like SAT solvers, proofs, and models’ (18%), ‘software was easy to learn’ (11%), and ‘if there were teaching assistants and labs’ (11%).
Those who do use educational software indicated which software they used. The most common software used were the ones included with the Barwise & Etchmendy book (Tarski’s World, Fitch, and Boole), which were used by 22% of the participants. There seemed to be three main uses of the software: assessment (62%), demonstrations/ examples (29%), and optional practice (9%). While almost 30% of the participants indicated that they had no problems with the software, some participants indicated a couple difficulties that they have using the software, such as ‘students don’t like it because it was too easy or they didn’t get enough feedback’ (29%), ‘there were technical problems with the software’ (24%) and ‘it eliminates thinking’ (18%). The participants who already use educational software were asked whether they would consider using a fully computer‐based and highly interactive software. Approximately 40% of the participants said they would consider it under certain circumstances: as a replacement for a standard textbook (62%), as the basis for enriched instruction (55%), as the basis for individualized instruction (43%), and as a full replacement for a lecture course (18%).
Summary
We found that symbolic logic, while not universally taught, is frequently taught at all types of universities except tribal colleges, and thus we wished to explore hybrid instruction in a range of university types. Further, the total pool of universities teaching a symbolic logic course is well over 1000. The most common setting for teaching symbolic logic was in a philosophy department, and thus we selected philosophy departments as our setting for experimentation. There seemed to be general opportunities for accelerated learning via more content coverage as the survey suggested that a number of topics found in the L&P course were not always taught. Further, a significant proportion of instructors seemed open to the use of a tool like L&P as a replacement of an existing textbook.In Class Vs. Online in Large Course Studies
In Fall 2007 and Spring 2008, studies were conducted comparing students purely using L&P with no face‐to‐face component against students in a traditional face‐to‐face class. Both studies involved the same class and same instructor. The university was a large top‐ tier public research institution with a high proportion of English‐as‐a‐Second Language learners. The instructor was a full‐time lecturer, with significant research experience in symbolic logic, significant teaching experience with symbolic logic, and significant experience with various tools for online instruction. The class was traditionally a very large class, and thus included a number of simple online tools embedded into the face‐to‐face class (e.g., online quizzes). Both sections had access to TAs for help with exams and homework.Participants
Fall 2007Condition Online Inclass
Starting course 50 57 Finishing course 45 43 % retention rate 90% 75% A new section of the course was created shortly before the beginning of the semester, producing fewer that typical students in the course. Students volunteered for in‐class versus online instruction during the first week of class. A pretest including demographics was given to assess pre‐existing differences between students in each condition. Critically, there was no difference between the performance on pretest of the OLI students (M=8.7, SD=3.2, N=45) and the In‐class students (M=9.1, SD=2.8, N=49). On all demographic dimensions, there were at most minor differences (i.e., 10% or less) between sections (i.e., gender, year, GPA, major, prior experience with logic courses, prior experience with formal proofs, prior experience with web‐based or programming environments). There was a higher attrition rate in the in‐class condition, likely producing a performance bias in that condition. Spring 2008
Condition Online Inclass
Starting course 84 259
Finishing course 83 105
Topics/Schedule for Fall 2007 and Spring 2008
Week Inclass Online Differences
1 Introduction to course &
reasoning validity Introduction to course & reasoning validity 2 Quantifier free logic:
symbolization and semantics Sentential logic: syntax and symbolization online delays covering iff 3 Quantifier free logic: formal
syntax and logical concepts Sentential logic: semantics (truth functions and logical concepts) online covers truth trees one week earlier Midterm 1 Symbolization NOT, AND, OR, IF...THEN, IFF sentential logic. Syntax. Truth‐table semantics. Concepts validity, logical true, logical false, logical indeterminate 4 Quantifier free logic: semantic
tableau Sentential logic: derivations/proofs
5 Quantifier free logic: derivations/proofs with sentential connectives Sentential logic: derivations with indirect rules 6 Quantifier free logic: proof strategies Sentential logic: strategies and derived rules online adds derived rules Midterm 2 truth trees / tableau and derivations NOT, AND, OR, IF...THEN, IFF. 7 Predicate logic: syntax of quantification Sentential logic: metatheory online adds metatheory 8 Predicate logic: translations of
quantification Predicate logic without quantifiers: syntax and translations of quantification
9 Predicate logic: quantification
semantic tableau Predicate logic (with quantifiers): syntax and translations of quantification, truth trees Midterm 3 derivations NOT, AND, OR, IF...THEN, IFF, symbolization, syntax, semantics, tableau ALL, EXISTS predicate logic 10 Predicate logic: quantification semantic tableau cont. Predicate logic: derivations 11 Predicate logic: derivations Predicate logic: derivations with strategies and derived rules online adds derived rules 12 Predicate logic: derivations with
strategies Predicate logic: identity (numeric quanifiers, definite descriptions, and derivations with truth trees) 13 Predicate logic: identity (semantic tableau and derivations with identity) Predicate logic: function symbols online adds function symbols Final Exam Comprehensive
Students registered for face‐to‐face versus online instruction courses, with additional recruiting for the online course taking part just prior to the beginning of the semester from students enrolled in the in‐class course. The lecture course was much larger than in the prior semester, reflecting more typical enrollments in this course at this university. Interestingly, attrition in the online course was almost non‐existent, whereas the in‐class condition had very high attrition (although at typical levels for this large, rigorous course). This differential attrition rate likely produces very significant performance biases in favor of the in‐class condition. The same pre‐test was administered. There was no significant difference between Online (M=10.8, SD=4.7, N=65) and the In‐class students (M=10.4, SD=4.5, N=83) on the pre‐test. There were also no demographic differences greater than 10% between conditions.
Results
In both semesters, students had three exams during the semester, one cumulative final exam, and weekly surveys regarding time spent attending lecture, reading material, getting TA help, doing homework on the computer, and doing practice exam questions. The exams were conservatively selected based on prior exams from the inclass section, producing a likely minor bias towards the inclass section. Some questions were modified for the online section to reflect minor differences in logic notations used in the two sections.Semester Fall 2007 Spring 2008
Condition Online Inclass Online Inclass
Exam 1 68% 69% 72% 70% Exam 2 44% 55% 55% 60% Exam 3 55% 58% 54% 54% Final Exam 63% 62% 62% 65% Total time 8 hrs/wk 7 hrs/wk 8 hrs/wk 9 hrs/wk In the fall, there were no significant differences between sections on any of the exams, although a trend towards better performance in the inclass condition on exam 2. Online students reported slightly higher total time on the course, primarily reflecting large spikes in time on task in weeks 5, 6, 8, and 9. These moments reflect the beginning of more difficult proof constructions. As a result of these reported spikes in effort, the homework content was adjusted for the following semester. In the spring, there were again no significant differences between sections on any of the exams, although there was the same trend towards better performance in the inclass condition on exam 2. This time the online condition reported more total time per week in the weekly surveys, although the difference was not statistically significant.
Summary
The results of these two studies suggest that similar learning outcomes can be obtained in this kind of setting from a pure online course as from a primarily face‐to‐face instruction course with roughly equivalent time‐on‐task. Note however that this comparison is conservative because there were much higher attrition rates in the face‐to‐face instructioncase. Further, although we did not have random assignment to condition, the huge differences in attrition rate are strongly suggested of an important retention rate benefit of the L&P course over the existing traditional instruction model. Large lecture courses with rigorous content (as can be seen by the relatively low exam performance across the board) are frequently subject to high attrition rates, and thus this retention rate benefit could be a very important result for improving the efficiency of university education.
Same Time/More Content in a Community College
The first accelerated learning study involved trying to cover significantly more content in a community college context. As would commonly be the case in the community college context, the instructor had a high load (4 courses/semester) of moderate enrollment courses (25 to 30), no research experience with symbolic logic, a modest teaching experience with symbolic logic, and little experience with online tools in instruction. The existing course typically covered less than half of the L&P full course: it included only sentential logic and with relatively little inclusion of full proofs even within sentential logic. The instructor’s goal for the current study was to cover as much of the full L&P course as possible in a hybrid instruction mode: one lecuture per week, with students experience primary instruction through online instruction and practice. Student performance on the shared content would be compared against prior semester performance on exams derived from previous semester exams (3 sections from the prior semester, n=85 students, against 3 sections of the current semester, n=85 students).
Context & Participants
Participants included students registered for one of three sections of an Introduction to Symbolic Logic course offered at a midwestern U.S. community college (see Table 5 for background information—i.e., gender, year, major, GPA, current course load, reason for taking course, goal grade, and computer experience). The majority of the participants had not experienced
formal/symbolic logic, history of logic, or rigourous proofs. Only 30% of the participants took a single course that had formal/symbolic logic—11% took more than one of these courses. Only 17% of the participants took a course with history of logic—1% took more than one of these courses. Only 15% of the participants took a course with rigorous proofs—8% took more than one of these courses. Overall, the participants did not do well on the pretest (M = .31; SD = 1.59; range 1 to 8 out of 16). They only got 4% of the statement questions correct (SD = 0.36; range 0 to 1 out of 5), 15% of the argument questions correct (SD = 1.00; range 0 to 4 out of 4), 64% of the equivalence questions correct (SD = 1.08; range 0 to 5 out of 5), and none of the proof questions correct (out of 2).
Attrition Rates
The community college produced an analysis of the attrition rate between the two semesters in question. The analysis compared the seats attrition from tenth day to end of term. Tenth day seats are based on total grades excluding X, while end of term seats are based on total grades (excluding X) minus Ws and N, following the college’s internal definition of attrition. The attrition rates for both prior and current courses were identical at ‐8.2%.Time on Task
Participants in the current semester were asked to rate the workload, difficulty, and amount of material covered in this course compared to other classes that they are taking. A 5-point scale (-2 to 2) was used, with negative numbers indicating less than other classes and positive numbers indicating more than other classes. A one sample t-test was used to compare the average
(workload = -0.18; difficulty = 0.25; amount of material = 0.16) on each of the possible ratings against 0 (same as other courses). The averages were only not significantly different from 0,
indicating that the workload, difficulty, and amount of material was the same as in other classes. Further, while difficulty and amount of material might have trended towards being higher than average, workload (critical for an accelerated learning study) trended towards lower than average.
Performance on Midterm Exams
The prior semester had three midterm exams and an optional final exam, while the current semester only had one midterm exam (basically the content of the prior midterm 1) and one required final exam (including content from prior midterms 2 and 3 plus new content not previously covered). The current semester performed at considerably higher levels on their midterm (M = 81%; SD = 15) than those who took the comporable first midterm exam in the prior semester (M = 69%; SD = 20), t(155)=4.24, p<.0001, Cohen’s D=0.7.
Final Exam Performance
The prior semester did not have a required final exam, so the final exam for the current (fall 2008) semester was created from the second and third midterm from the spring semester. Additional questions were also included that covered new material that was not covered in the prior semsester. This material included being able to reflect and explain strategies used to solve a proof, constructing a truth tree, and translations using predicate logic. The two sections were analyzed separately. There were no significant differences between the spring semester’s performance (M=75%, SD=26) and the fall semester’s performance (M=72%, SD=16) on material that was covered by both semesters, t(150)=‐0.72, p=.47. The fall semester did fairly well on the extra questions (M = 78%; SD = 18).Summary
In a community college context, accelerated learning was achieved using hybrid instruction: some of the previously covered content was learned to greater levels and considerable additional, more advanced content was also learned. This gain in content learned took place over the same semester time, without creating an atypically high workload course and without any rise in the course attrition rate.Table 5. Background information for the Community College Acceleration Study Gender 34 male; 28 female
Year 19 freshmen; 29 sophomores; 12 junior; 0 seniors; 1 5th year or above Major
GPA
Current
Course Load 1 one course; 2 two courses; 3 three courses; 2 four courses; 39 five courses; 15 six courses Reason for
Taking Course
18 meets the university requirement; 17 thinks the subject is interesting; 14 major requirement;
6 covers skills I want to develop; 4 fits well into schedule;
1 expect the course to be challenging; 1 hear the teacher was good;
1 prerequisite
Goal Grade 50 A; 9 B; 3 no goal grade Computer
Experience 15 commented on a blog/wiki 13 used educational software 27 worked with spreadsheets 3 worked with statistical packages 4 proficient in computer programming
Acceleration for commuter students with optional recitation sessions
In many regional campuses of public institutions in the US, a large proportion of the students prefer online instruction because it allows them to work and/or care for family members while attending college. In this context, it is difficult to require hybrid instruction. This study examined whether the relatively amount of hybrid instruction would allow students to cover more content within the semester. At this university, L&P had been used in online only format for a number of years, although the current instructor was new to teaching this course. As in prior semesters of the L&P course in this context, students were allowed to complete the course at their own pace. Additionally, grades focused on content coverage rather than the more typical degree of mastery: The more that students completed, the higher the grade they would be assigned (assuming minimal levels of proficiency were met on each section in the final exam). Throughout the semester, optional recitation sessions were offered to help the students complete the work in a timely fashion. It was predicted that if students took advantage of the recitation sessions, then they would likely complete more material.Content Learning Results
For each student, we calculated amount of material learned by students as the number of chapters for which they received a passing grade in the final exam. Unlike what was hypothesized, there was not a significant relationship between number of recitations attended and amount of material completed (r=.1, p > .4).Attendance
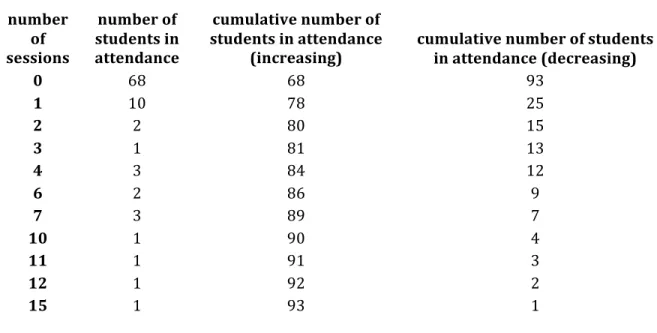
One clear problem with this study, however, is that the majority of the students did not attend any of the recitation sessions, and only a couple of students were regular attendees (see Table 6). Based on the distributions, cutoffs for a grouping variable seemed to be those who did not attend any sessions (N = 23), those who attended one to three session (N = 2), and those who attended four or more sessions (N = 11).1 However, analyses of exam performance involving these groups were not significant either (p > .6), although there was a slight trend for the zero session group to do less well than the other two groups. Increases in final grades were offered as incentive to attend the recitation sessions. If students attended six or more sessions, then they would receive a bump in their final grade (i.e., B‐ would be increased to a B). If students attended twelve or more sessions, then they would receive two bumps in their final grade (i.e., B‐ would be increased to a B+). Considering these cutoffs, four groups were created: those who did not attend any sessions (N = 23), those who attended at less than six sessions (N = 4), those who attended at least six sessions but less than 12 (N = 7), and those who attended 12 or more sessions (N = 2). Again, there were no significant differences between these conditions (p > .6)1 Total N for this analysis is less than the amount indicated in the table. There was some loss due to students not taking the final exam.
Table 6. Distribution of attendance at the recitation sessions. number of sessions number of students in attendance cumulative number of students in attendance
(increasing) cumulative number of students in attendance (decreasing)
0 68 68 93 1 10 78 25 2 2 80 15 3 1 81 13 4 3 84 12 6 2 86 9 7 3 89 7 10 1 90 4 11 1 91 3 12 1 92 2 15 1 93 1
Summary
Even with a grade incentive for attending recitation sections, students in this university context were unlikely to do so. The small amount of attendence in hybrid instruction was not clearly associated with increases in amount of material learned. Insufficent students completed the pre‐test for us to assess whether recitation attendence was correlated with weaker performance. However, that remains a clear possible explanation for why recitation attendence was not correlated with better course performance.Same Time/More Content with Hybrid Instruction in a University
The context with the highest likelihood of teaching symbolic logic is the national university. Relative to the community college context, the instructors are likely to be more familiar with symbolic logic content, their students are more likely to be already be learning some of the more advanced content found in L&P, and the instructors have lower teacher loads but perhaps larger classes. However, there are some opportunities for covering more content using L&P than with the existing course as the survey of courses did find that not all of L&P content was typically covered. Further, in this context students, students were previously attending traditional symbolic logic classes, and thus hybrid instruction is possible. The particular content that was not previously found in the studied context involve some aspects of metamathematics and strategic elements of proof construction.Context & Participants
Participants included students registered for an Introduction to Symbolic Logic course offered at a 4th tier university. Two‐thirds of these students were sophmores from computer science or engineering backgrounds, and thus were relatively well matched to learning this kind of content (e.g., half the students had prior experience with rigorous proofs). Students were offered an opportunity to participate in this study. Out of the total of 81 (63 male) registered students, 31 students volunteered (22 male). The volunteers were randomly assigned to one of two conditions: face‐to‐face (N = 10) or hybrid (N = 21). The 50 non‐volunteers were completed the same work as the face‐to‐face participants. The first analyses compared the background and prior knowledge of the volunteers (i.e., collapsing the face‐to‐face and hybrid conditions) to the non‐volunteers. There were very few differences between the two conditions. The volunteers outperformed the non‐ volunteers on the prior knowledge portion of the pretest (volunteers: M = 10.1, SD = 2.1; non‐volunteers: M = 8.9, SD = 2.5; t(79) = ‐2.2, p = .03)—especially on the statements questions (volunteers: M = 3.1, SD = 1.1; non‐volunteers: M = 2.6, SD = 1.3; t(79) = ‐2.1, p = .04). The volunteers only had slightly more rigorous proof classes than the non‐volunteers (volunteers: M = 0.7, SD = 1.1; non‐volunteers: M = 0.3, SD = 0.6; t(79) = ‐1.9, p = .07). There were no significant differences for knowledge questions involving arguments, equivalence, or proofs, gender, year in school, major, total courses currently taking, overall grade point average, computer experience, and how many previous formal logic and history of logic courses they took. Because there were so few differences between the volunteers and non‐volunteers, the non‐volunteers and face‐to‐face students were collapsed for all the remaining analyses. There were not even marginally significant differences in background and prior knowledge between the resulting face‐to‐face students and hybrid student groups.Time on Task
At the end of the semester, students completed a survey about the course workload. Six students’ surveys were not included in the analysis: three could not be identified from the initial class roster, two did not provide names, and one did not complete half the survey. Overall, there were no differences in the total time on task between the face‐to‐face students (M = 14.1, SD = 6.4) and the hybrid students (M = 11.1, SD = 3.0), t(55) = 1.6, p = .11. Not surprisingly, the face‐to‐face students (M = 1.9, SD = 0.8) spent more time in lecture than the hybrid students (M = 0.5, SD = 0.7), t(55) = 5.5, p < .0001). They also spent more time on their homework (face‐to‐face: M = 3.0, SD = 1.3; hybrid: M = 1.9, SD = 0.5; t(55) = 2.9, p = .01). However, the hybrid students spent more time in recitation (face‐to‐ face: M = 1.5, SD = 0.8; hybrid: M = 2.1, SD = 1.0; t(54) = ‐2.2, p =.03). Students were also asked four questions about their perceptions of the course (i.e., how interesting was the course compared to other courses; how helpful was the recitation compared to other courses; how difficult was the material covered in this course compared to other courses; how likely are you to take a follow‐up course that builds on this materials). They were to rate the questions on a scale of 1 (not at all) to 5 (very much/likely). There were no differences between the three conditions.Performance on Final Exam
All students took the same final exam, which covered the following topics: Symbolization into RL (multiple‐choice); Translation from PL (multiple‐choice); Other Questions (multiple‐choice); Symbolization (short‐answer); Translation (short‐answer); Other Questions (short‐answer); Derivation Justifications; Derivation Violations; Truth Table Method; Derivation; Tree Method; Translation & Tree/Derivation. Each of these topcis were analyzed separately. Three students’ exams were not included in the analyses because they could not be identified on initial the class roster. Two versions of the test were distributed within each group. The only difference between the two versions was the order in which the questions were presented. There was no significant differences in performance between the two versions (version 1: M = 43.0, SD = 14.7; version 2: M = 47.5, SD = 14.2; t(60) = ‐1.2, p > .2) and thus the two versions were collapsed for the remaining analyses. Overall, the face‐to‐face students (M = 47.6, SD = 13.2) outperformed the hybrid students (M = 37.3, SD = 16.6) on the final exam, t(60) = 2.4, p = .02). They did better on the short‐ answer symbolization questions (face‐to‐face: M = 3.5, SD = 1.9; hybrid: M = 2.2, SD = 2.0; t(60) = 2.2, p = .03), the derivation violation questions (face‐to‐face: M = 2.5, SD = 0.9; hybrid: M = 1.4, SD = 1.4; t(60) = 3.2, p = .001), the truth table method questions (face‐to‐ face: M = 3.8, SD = 1.6; hybrid: M = 2.7, SD = 2.3; t(60) = 2.0, p = .05), and the derivation questions (face‐to‐face: M = 15.6, SD = 7.5; hybrid: M = 10.4, SD = 8.1; t(60) = 2.2, p = .03). The hybrid students did slightly better on the multiple‐choice symbolization questions (face‐to‐face: M = 2.3, SD = 1.7; hybrid: M = 3.2, SD = 1.8; t(60) = ‐1.7, p = .10).Summary
In this context, there was no apparent test performance benefit for hybrid instruction over traditional face‐to‐face instruction. One might argue that better performance would have resulted from hybrid instruction had the instructor and TA had more familiarity with the L&P system. Good hybrid instruction involves instructors learning how to make sense of feedback the system provides on student learning and then providing targetted instruction. It is possible that the instructor and TA continued to use old instructional styles in the new context. However, the results do suggest that gains may not be found immediately on the switch to this kind of hybrid instruction in this kind of context (content knowledgeable instructors working with relatively strong students).Acknowledgements
We would like to acknowledge the tireless contributions of Wilfried Sieg. This evaluation effort was a major undertaking that could not have been done without in‐depth input from him at every step of the way. In addition, Dawn McGlauglin, Davin Lafon, Leslie Burkholder, Rebecca Thall, Dave Beisecker, and Victoria Rogers provided considerable help along the way.References
Carnegie Foundation for the Advancement of Teaching (http://www.carnegiefoundation.org/) US & World News Reports America’s Best Colleges
(http://www.usnews.com/usnews/edu/college/rankings/rankindex_brief.php) Wikipedia
(http://en.wikipedia.org/wiki/List_of_historically_black_colleges_of_the_United_Stat es)