Manuscript Number: RESS-D-15-00346
A Safety-Critical Decision Support System
Evaluation Using Situation Awareness and
Workload Measures
Mohsen Naderpour1,*, Jie Lu1,2, Guangquan Zhang2 1Global Big Data Technologies Centre, Faculty of Engineering and IT, University of Technology Sydney (UTS)
2
Centre for Quantum Computation & Intelligent Systems, Faculty of Engineering and IT, University of Technology Sydney (UTS)
Abstract:
To ensure the safety of operations in safety-critical systems, it is necessary to maintain operators’ situation awareness (SA) at a high level. A situation awareness support system (SASS) has therefore been developed to handle uncertain situations [1]. This paper aims to systematically evaluate the enhancement of SA in SASS by applying a multi-perspective approach. The approach consists of two SA metrics, SAGAT and SART, and one workload metric, NASA-TLX. The first two metrics are used for the direct objective and subjective measurement of SA, while the third is used to estimate operator workload. The approach is applied in a safety-critical environment called residue treater, located at a chemical plant in which a poor human-system interface reduced the operator’s SA and caused one of the worst accidents in US history. A counterbalanced within-subjects experiment is performed using a virtual environment interface with and without the support of SASS. The results indicate that SASS improves operators’ SA, and specifically has benefits for SA levels 2 and 3. In addition, it is concluded that SASS reduces operator workload, although further investigations in different environments with a larger number of participants have been suggested.
Keywords: Situation awareness, Situation awareness measurement, System evaluation, Decision support systems, Safety-critical systems.
*
Corresponding author, Tel:+61 2 9514 2644
E-mail addresses: [email protected] (M.Naderpour), [email protected] (J.Lu), [email protected] (G. Zhang)
1 Introduction
Many high-hazard industries have focused on a range of contributing factors to industrial accidents in an attempt to reduce the accident rate as much as possible, in the wake of several high impact disasters such as those at Bhopal, Three Mile Island and Chernobyl. Most industrial accidents typically occur after a chain of organizational failures and human error, of which the share of human-factor causes is estimated to be 70–80% [2, 3]. Among the human-factor causes, the ability of operators to understand what is going on their worksite environment is a critical element in preventing accidents. This cognitive ability is referred to as situation awareness (SA) and indicates a high level of awareness of task and environmental conditions, as well as an ability to predict how conditions may change in the near future and understand how situations will develop [3]. To date, several SA models such as Taylor [4], Endsley [5], Adams et al. [6], and Bendy and Meister [7] have been developed; of these, Endsley’s model has received the most attention from the human factor community. Endsley’s three-level model describes SA as ―the perception of the elements in the environment within a volume of time and space, the comprehension of their meaning and the projection of their status in the near future‖. It introduces SA as a state of knowledge in the human mind that has three levels: (1) The perception of relevant elements in the environment; (2)The comprehension of the meaning of these elements in respect of goals; and (3) The projection of the state of these elements in the near future [5].
The three-level model of SA has been used as a justification for structuring computer-supported SA systems in a variety of domains, such as maritime security [8, 9], military services [10-13], the aviation domain [14] and business intelligence systems [15]. We have recently developed a cognition-driven decision support system called the situation awareness support system (SASS) to manage abnormal situations in safety-critical environments [1]. SASS consists of four major elements: 1) a situation data collection unit that takes into account online conditions based on monitoring systems to provide the current state of the observable variables; 2) a situation assessment unit that uses the capabilities of dynamic Bayesian networks (DBN) to model operators’ mental models about abnormal situations, and a fuzzy logic system to resemble operators’ thinking when individuals are confronted with these abnormal situations; 3) a situation recovery unit that provides a basis for decision-making to reduce the risk level of situations; and 4) a human-computer interface.
The system has been partially validated by a sensitivity analysis technique carried out to evaluate the situation models. The aim of this paper is to fully and systematically evaluate the performance of SASS based on SA measures. SA measures determine the degree to which design concepts and new technologies improve or degrade an operator’s SA [16]; they are
therefore a critical part of any system and procedural design process, and such evaluation efforts ensure that new systems, procedures or interfaces improve SA rather than degrade it.
Attempts to measure SA unfortunately encounter difficulties, due to the lack of a universally accepted SA model. Measures of SA, in general, try to infer SA from other factors that are easier to assess (i.e. indirect measures), or attempt to obtain it directly. Indirect measures approach the issue by inferring how much SA an operator has acquired by assessing the cognitive processes that contribute to the development and maintenance of SA, or by assessing relevant aspects of performance in relation to the interaction between operators and systems. Behavioral, performance and process measures may thus be relied on to make these assessments; however, because the quality of decision making and task execution, independent of SA, may be influenced by many factors, the use of indirect measures alone to assess SA are not recommended [17]. Unlike indirect measures, direct metrics try to measure SA by comparing operators’ responses with real world situations, or by asking an expert to assess the quality of operators’ SA during a specific time interval. Endsley believes that workload assessment, human/system performance analysis, and objective SA measurements are the best ways to evaluate system design [17]. Endsley et al. use SAGAT1, which is a direct objective technique, and SART2, which is a direct subjective technique, to assess the SA of air traffic controllers, using a traditional air traffic control (ATC) display and an enhanced ATC display [18]. They then compare the sensitivity and validity of both techniques with the results of a real-time probe approach. The results show that the online probe approach and SART are not sensitive to changes in conditions, whereas the SAGAT scores are sensitive to interface changes. In another study, Endsley et al. utilize SAGAT and SART in the assessment of fighter pilots’ SA. Because there is no correlation between measures, they conclude that the objective SA assessment by SAGAT is not related to the subjective SA assessment by SART [19]. Salmon et al. also utilize SAGAT and SART to assess participants’ SA during a military planning task [20]. They conclude that different SA measures assess different aspects of SA. The literature review reveals that the majority of SA measurement applications are limited to aviation and military domains, and their usefulness in evaluating safety-critical decision support systems has not been studied sufficiently.
In this paper, a multi-perspective approach considering three SA metrics is utilized to evaluate the suitability of SASS. The approach includes two direct SA measures, i.e. SAGAT and SART, and one workload measure called NASA-TLX3 which is a multi-dimensional scale
1
Situation Awareness Global Assessment Technique 2 Situation Awareness Rating Technique
to estimate operator workload. The evaluation process of SASS is conducted with the participation of ten operators in a counterbalanced within-subjects design.
The paper is organized as follows. The background of this research related to measuring SA is presented in Section 2. Section 3 briefly describes the elements of SASS. The description of a residue treater at a chemical plant, which is used for the SASS evaluation, is provided in Section 4. The multi-perspective evaluation approach is introduced in Section 5. Lastly, the conclusion and future works are outlined in Section 6.
2 Measuring Situation Awareness
More than thirty different approaches to SA measurement have been identified and can be generally categorized as belonging to one of two groups: direct measures and indirect measures. Direct measures can also be grouped into subjective and objective metrics. This section reviews the common direct measures of SA.
2.1 Subjective Measures
Subjective SA assessment requires the quality of operators’ SA to be rated, either by operators themselves or by an expert observer during a specified period. The rating results can then be utilized to compare the quality of SA in various systems. This kind of measure can be broken down into the following two groups:
Self-rating techniques assess the confidence of participants in their SA. In these techniques, participants use a rating scale to provide a subjective rating of their perceived SA. The self-rating techniques are quick, easy, and low cost, and as they are administered post-trial, they are non-intrusive. However, there are several problems associated with the post-trial data collection of SA because there is a correlation between SA and performance. In addition, there are a number of issues in respect of their sensitivity [20]. SART, based on Taylor’s SA theory [4], is a self-rating technique which, at the conclusion of an operation, is administered to participants who subjectively rate their SA based on a 10-dimensional bipolar scale. The participants’ ratings on each of the 10 items are combined to form a rating for each of the three major categories, namely understanding, attention demand, and attention supply. An overall rating is then generated. Although SART can effectively provide information about participants’ confidence in their SA, it can be influenced by performance outcome. In other words, a person may rate his/her SA higher when the task is performed successfully and a positive outcome is achieved. SART can also be influenced by memory decay when assessment is conducted at the end of the event. More importantly, participants may not accurately assess their own SA because they do not know what they do not know [21]. The use of SART applications has mostly been reported in the domain of air traffic control [21,
22]. Another self-rating approach is the SA-SWORD1 in which operators evaluate systems by comparative analysis using a nine-point scale. Each level of the scale represents an operator’s estimation of the amount of SA that is provided by each system. Further evaluation studies are needed to prove the effectiveness and accuracy of SA-SWORD [17].
Observer rating approaches involve the observation of participants during task performance by subject matter experts (SMEs) who then rate the participants’ SA. Typically, the SA ratings are based on pre-defined observable SA-related behaviors exhibited by participants during task performance. Observer rating techniques have several advantages. They can be used during real-time activities and have no impact on the task being performed. However, greater scientific review is necessary because their validity is inconclusive [20]. The SABARS2 is an observer rating approach that has been developed to assess infantry SA in field training exercises [23]. The SARS3 represents another observer rating technique that consists of 31 behavioral elements in eight categories. Pilots use a six-point scale to complete the SARS measure for themselves and others in their units by rating each element [24]. The usefulness of SARS is very limited because it only considers a particular type of aircraft, flight skill and mission, and is therefore not easy to use in other domains.
2.2 Objective Measures
Objective SA assessment is achieved by conducting a direct comparison between operators’ SA and reality. This comparison is either made offline or is conducted online/in real time during a process of querying operators about certain aspects of an environment and determining the accuracy of responses by comparing them with reality. The objective techniques fall into the following two categories:
Freeze probe techniques administer online SA queries during a freeze in the simulation environment of tasks under analysis. The simulation is frozen and suspended at randomly selected times; user interfaces are then blanked, and the operator is asked to quickly answer questions about his or her current understanding of the situation. An overall SA score is calculated at the end of the trial by comparing the participant’s responses with the actual state of the system at the time of the freeze [20]. Freeze probe techniques do not suffer from issues associated with collecting SA data post-trial; they measure SA via the information in working memory because operators do not have access to displays when they answer the questions [25]. The most popular freeze probe technique is SAGAT, which was developed by Endsley to assess pilots’ SA [18]. The application of SAGAT can be found in air traffic control [26],
1
Situation Awareness-Subjective Workload Dominance Technique 2 Situation Awareness Behavioral Rating Scale
commercial and military aviation [27], nuclear power plants [28], and simulated air traffic management [25].
Real-time probe techniques, unlike freeze probe techniques, include the online administration of SA queries with no freezing of the operation. The queries are developed by SMEs prior to the task, or during task performance, and administered as the participant performs the task. Response content and response time are used to measure the participant’s SA. Because there is no task freeze in this assessment, the level of intrusiveness of these techniques is lower than that of freeze probe approaches [17]. The SPAM1 is a real-time probe technique which was specifically developed to assess air traffic controllers’ SA [29]. It is based on the theory that operators who have good SA respond to the probes more quickly because they know where to look to find a particular piece of information in the environment. Questions are concurrently asked of operators while they are performing activities and have full access to their displays, and response time is considered as a measure of operators’ SA.
3 The Situation Awareness Support System
The situation awareness support system, or SASS, has been developed according to the practice of design research [30] proposed for the development of information systems, and is based on an SA-oriented design process [31] established to guide the development of SA support systems. The SA-oriented design process consists of SA considerations, including SA requirements analysis, SA-oriented design principles to enhance SA, and SA measurement to evaluate the design. The SASS requirements were determined by goal-directed task analysis (GDTA), as summarized in Table 1, and the SASS model was developed as shown in Figure 1 [1].
3.1 The Knowledge-Base
A situation is defined as a collection of objects that have relationships with one another and the environment, and a hazardous situation is defined as a circumstance that exists immediately before harm is produced by the hazard. Therefore, a hazardous situation is defined as an abnormal situation if its risk is not acceptable [1]. A combination of cognitive engineering procedures and hazard identification methods is carried out to discover hazardous situations. Analysis of written materials and documentation, observation of operator performance, expert elicitation and formal questionnaires may help with this determination [31]. In many safety-critical systems, hazardous situations have been foreseen during the design and implementation phases, and various models have been developed to identify them. The identified situations, which are modeled based on Bayesian networks, as described in [32], establish the
base of SASS. The knowledge-base is verified in a participatory environment to ensure that the breadth of issues is identified.
Table 1: Safety goals, decisions and SA requirement Goal: Eliminate or reduce the risks to a level that is as low as reasonably practicable
Subgoal 1: Determine the risks
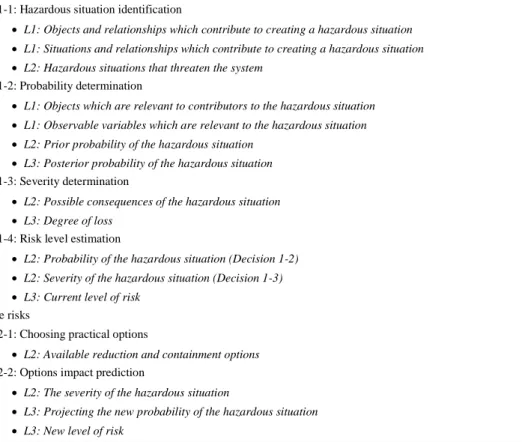
Decision 1-1: Hazardous situation identification
L1: Objects and relationships which contribute to creating a hazardous situation
L1: Situations and relationships which contribute to creating a hazardous situation
L2: Hazardous situations that threaten the system
Decision 1-2: Probability determination
L1: Objects which are relevant to contributors to the hazardous situation
L1: Observable variables which are relevant to the hazardous situation
L2: Prior probability of the hazardous situation
L3: Posterior probability of the hazardous situation
Decision 1-3: Severity determination
L2: Possible consequences of the hazardous situation
L3: Degree of loss
Decision 1-4: Risk level estimation
L2: Probability of the hazardous situation (Decision 1-2)
L2: Severity of the hazardous situation (Decision 1-3)
L3: Current level of risk
Subgoal 2: Reduce the risks
Decision 2-1: Choosing practical options
L2: Available reduction and containment options
Decision 2-2: Options impact prediction
L2: The severity of the hazardous situation
L3: Projecting the new probability of the hazardous situation
L3: New level of risk
L3= Projection of SA; L2= Comprehension of SA; L1= Perception of SA.
3.2 The Situation Data Collection Unit
Observable variables in the environment are obtained from field sensors by the situation data collection unit, based on SCADA1 systems. As the observable variables extracted from sensors are continuous, a discretization process is conducted to prepare them for use as evidence in DBN-based models.
3.3 The Situation Assessment Unit
The situation assessment unit generates an assessment level of risk for every situation and shows whether or not the risk level is acceptable. According to the proposed modeling method, a DBN-based situational network provides the prior and posterior probabilities of a situation, the situation's severity is calculated by a consequence severity matrix, and a fuzzy logic system (FLS) is then utilized to estimate the situational risk level.
3.4 The Situation Recovery Unit
1
The situation recovery unit provides a basis for operator decision-making to recover the situation if its estimated risk is unacceptable. The DBN-based situational network simulates the impact of risk recovery decisions for the situation, and the situation assessment unit estimates the new risk level. The aim is to eliminate the risk level of situations, or reduce it to an acceptable level.
Figure 1: The situation awareness support system model [1].
3.5 The Human-Computer Interface
The SASS graphical user interface (GUI) was developed based on the capabilities of Object Oriented BNs (OOBNs). As modeling the situational network in many safety-critical systems has a number of variables that lead to complex models, OOBNs that comprise both instance nodes and usual nodes were used to develop the interface. A complex BN can be decentralized using OOBNs as a hierarchy of sub-networks with desired levels of abstraction that facilitate the construction of the model and allow communication between the sub-networks to be performed more effectively. In addition, the prototype triggers an alarm for every situation that has a risk level in excess of ―tolerable not acceptable‖.
4 Intended Safety-Critical Environment
On 28 August 2008, a runaway chemical reaction occurred at a methomyl production unit in Institute, West Virginia, USA. Highly flammable solvent sprayed from a 4,500 gallon pressure vessel known as a residue treater and immediately ignited, killing two employees and injuring eight firefighters and contractors. The intense fire burned for more than four hours, more than 40,000 residents were evacuated to shelter-in-place for over three hours, and the highway was closed for many hours because of smoke disruption to traffic [33]. The investigation report shows that deviation from the written start-up procedures and bypassing critical safety devices were the contributing factors to the runaway chemical reaction and loss of containment of the
flammable and toxic chemicals. A poor process mimic screen of the new DCS1, which could not provide adequate SA for the board operator, was another important contributing factor [34].
4.1 Plant Description
Methomyl is classified as a carbamate insecticide and is a white crystalline solid with a slight sulfurous odor. It is usually produced from methyl isocyanate (MIC). MIC can cause a highly exothermic reaction if mixed with water, therefore it needs to be stored in stainless steel or glass containers at temperatures below 40 °C. The production process of methomyl, as illustrated in Figure 2, starts with the production of methylthioacetaldoxime (MSAO) by reacting chloroacetaldoxime with sodium methyl mercaptide. The MSAO then reacts with MIC to produce methomyl. The crystallizers remove excess MIC from the methomyl-solvent solution by adding an anti-solvent that causes the methomyl to crystallize. Lastly, a centrifuge separates the crystallized methomyl from the solvents. The methomyl cake is dried, packaged and moved to the warehouse. The liquid residue in the centrifuge contains very small quantities of methomyl and other impurities [34].
Figure 2: Methomyl synthesis process flow [34].
As can be seen from Figure 3, the solvent recovery flasher separates the solvents and recycles them to the beginning of the process. The accumulated liquid in the bottom of the flasher, called ―flasher bottoms‖, includes unvaporized solvents and impurities containing up to 22 percent methomyl. The flasher bottoms are used as fuel in the facility’s steam boilers after the methomyl concentration has been reduced to less than 0.5 percent by weight. This rate is essential for environmental and processing considerations [34].
1
DCS is a dedicated system used to control manufacturing processes; it is connected to sensors and actuators and uses set-point controls to control process variables
Figure 3: Methomyl centrifuge and solvent recovery process flow [34].
The incoming flasher bottoms are diluted in a 4500-gallon pressure vessel (50 psig is the maximum allowable operating pressure) called a residue treater, as shown in Figure 4. The concentration of methomyl in the flasher bottom stream will be below 0.5 percent by weight if the residue treater is operated at a high enough temperature, with sufficient residence time, to decompose the content. An auxiliary fuel tank is used to store the solvent and residual waste material and subsequently transfer them to the facility’s steam boiler, where they will be used as fuel. Toxic and flammable vapor generated in the methomyl decomposition reaction is removed when it exits through the vent condenser to the process vent system [34].
Figure 4: Residue treater piping system layout [34].
Two kinds of operation for a residue treater can be considered: Startup and Routine. During startup, the residue treater is manually pre-filled with solvent to a minimum level of 30 percent. This means that the operation will not start at a lower level. The solvent is heated by steam that
flows through the heater. When the liquid temperature has increased to set-point limit, the steam flow valve is closed, recirculation flow is redirected from the heater to the cooler, and routine operation is started. In this study, routine operation is considered in the modeling of situations.
4.2 Observable Variables
There are several transmitters in the environment that provide the online condition for the residue treater. Discrete states of the observable variables are determined in terms of operation and safety set-points, as shown in Table 2:
Liquid level: A level transmitter indicates the residue treater liquid level (L). The routine operation is not started at a level lower than 30 percent, and the maximum permissible level of liquid is 50 percent. The value range of the liquid level variable is divided into three states: Low, Normal and High.
Recirculation flow: During the operation, a pump provides a steady state of recirculation, and a flow transmitter measures the flow of liquid through the recirculation pipeline. The measurement is converted to electrical signals and sent to the DCS by the flow transmitter. This allows operators to visualize the amount of liquid being transferred through the cooling cycle during routine operation. The value range of recirculation flow (F) is divided into three states: Very Low, Low, and Normal.
Temperature: The content of the residue treater should be maintained around 135°C to decompose the incoming methomyl quickly and prevent the accumulation of methomyl at an unsafe concentration inside the residue treater. A temperature transmitter measures the residue treater temperature (T). The temperature value range is divided into three states: Low, Normal, and High.
Pressure: The maximum allowable operating pressure of the residue treater is 50 psig, but it is normally operated at 20 psig. A pressure transmitter indicates the residue treater pressure (P). The pressure value range is divided into three states: Normal, High, and Very High.
Table 2: Safety set-points of observable variables.
Observable variable States Definition
Liquid Level (L) Low Normal High Recirculation Flow (F) Very low Low Normal Temperature (T) Low Normal High Pressure (P) Normal High Very high
4.3 Situation Models
Several possible hazardous situations in the environment are determined as follows [33]: Situation of vent condenser failure (SVC)
Situation of high liquid level (SHL) Situation of abnormal recirculation (SAR) Situation of high pressure (SHP)
Situation of high temperature (SHT)
Situation of high concentration of methomyl (SHC) Situation of runaway reaction (SRR)
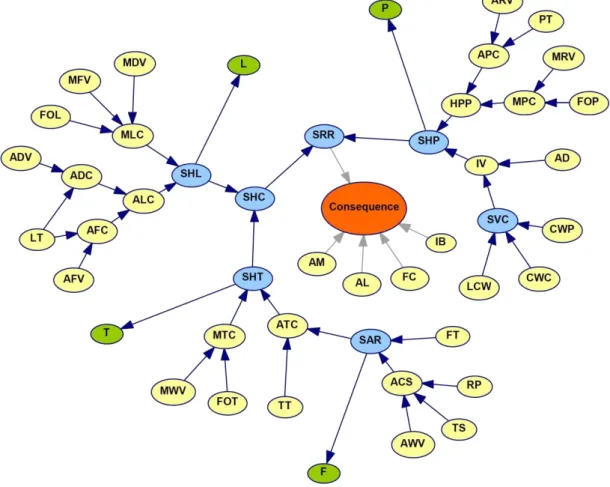
The description of situation objects is presented in Table 3, and the conditional probability tables (CPTs) of focal objects that represent the situations and the CPTs of other objects are determined according to our proposed method, as described in [35]. The possible consequences are determined as shown in Table 4, based on the method described in [32]. A situational network is then developed as shown in Figure 5.
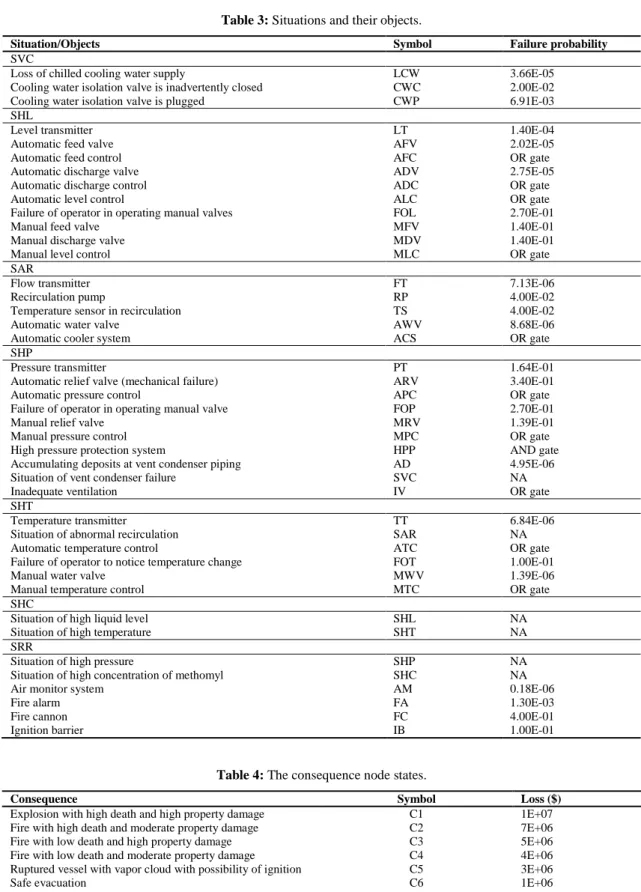
Table 3: Situations and their objects.
Situation/Objects Symbol Failure probability
SVC
Loss of chilled cooling water supply LCW 3.66E-05
Cooling water isolation valve is inadvertently closed CWC 2.00E-02 Cooling water isolation valve is plugged CWP 6.91E-03 SHL
Level transmitter LT 1.40E-04
Automatic feed valve AFV 2.02E-05
Automatic feed control AFC OR gate
Automatic discharge valve ADV 2.75E-05
Automatic discharge control ADC OR gate
Automatic level control ALC OR gate
Failure of operator in operating manual valves FOL 2.70E-01
Manual feed valve MFV 1.40E-01
Manual discharge valve MDV 1.40E-01
Manual level control MLC OR gate
SAR
Flow transmitter FT 7.13E-06
Recirculation pump RP 4.00E-02
Temperature sensor in recirculation TS 4.00E-02
Automatic water valve AWV 8.68E-06
Automatic cooler system ACS OR gate
SHP
Pressure transmitter PT 1.64E-01
Automatic relief valve (mechanical failure) ARV 3.40E-01
Automatic pressure control APC OR gate
Failure of operator in operating manual valve FOP 2.70E-01
Manual relief valve MRV 1.39E-01
Manual pressure control MPC OR gate
High pressure protection system HPP AND gate
Accumulating deposits at vent condenser piping AD 4.95E-06
Situation of vent condenser failure SVC NA
Inadequate ventilation IV OR gate
SHT
Temperature transmitter TT 6.84E-06
Situation of abnormal recirculation SAR NA
Automatic temperature control ATC OR gate
Failure of operator to notice temperature change FOT 1.00E-01
Manual water valve MWV 1.39E-06
Manual temperature control MTC OR gate
SHC
Situation of high liquid level SHL NA
Situation of high temperature SHT NA
SRR
Situation of high pressure SHP NA
Situation of high concentration of methomyl SHC NA
Air monitor system AM 0.18E-06
Fire alarm FA 1.30E-03
Fire cannon FC 4.00E-01
Ignition barrier IB 1.00E-01
Table 4: The consequence node states.
Consequence Symbol Loss ($)
Explosion with high death and high property damage C1 1E+07 Fire with high death and moderate property damage C2 7E+06 Fire with low death and high property damage C3 5E+06 Fire with low death and moderate property damage C4 4E+06 Ruptured vessel with vapor cloud with possibility of ignition C5 3E+06
Safe evacuation C6 1E+06
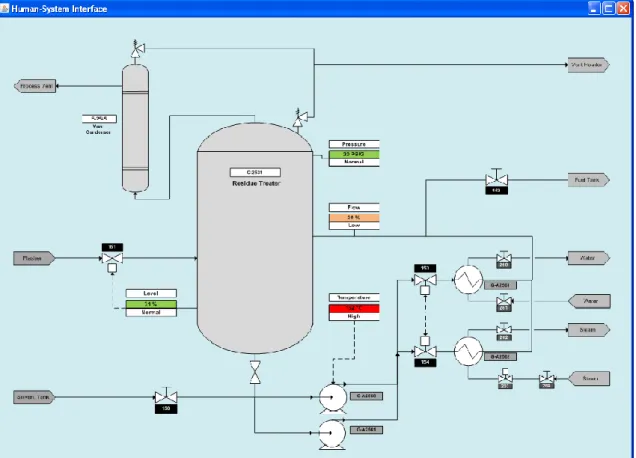
4.4 Virtual Environment Interface
The virtual environment interface, shown in Figure 6, displays the necessary information for operators to monitor the operation of the residue treater unit and manipulate the components. The virtual environment enables an operator to experience the nominal and critical plant conditions and to learn how to control the plant, prevent accidents, manage emergencies, and improve maintenance. This environment provides a basis for personnel to experience risky situations without paying the consequences (e.g., compromising production, endangering plant personnel and the surrounding population, contaminating the environment, jeopardizing relationships with local authorities, or increasing insurance premiums). In addition, as experienced during the VIRTHUALIS project [36, 37], the rehearsal of specific events allows process understanding to be improved through testing a number of occurrences that will fortunately not usually take place during the lifetime of the plant, and which cannot therefore be learned and experienced on the job. The other advantage of the virtual environment is that by presenting abnormal situations, decision-makers are able to measure human capabilities that cannot be measured in the field.
In the intended virtual environment, flow directions are indicated by vertical and horizontal lines between components. Instantaneous values, i.e. pressure, flow rate, liquid level and temperature, are displayed as gauge values adjacent to their respective components. If the values exceed high or low limits, the system triggers an alarm and indicates to the user that flashing values are values that have fallen outside their allowable range. By mouse-clicking any component, the user interface provides a pop-up window that presents the available options, such as deactivating the alarm or turning the system pumps on and off, as well as offering maintenance suggestions.
4.5 The SASS Interface
The human-computer interface of SASS is shown in Figure 7. Modeling the situational network for the residue treater led to complex models, and OOBNs were therefore used to develop the SASS interface. Mouse-clicking any situation in the interface opens a pop-up window that contains the related sub-network, including contributing objects, their failure probability, and the most probable explanation for the hazardous situation.
Figure 6: The virtual environment interface.
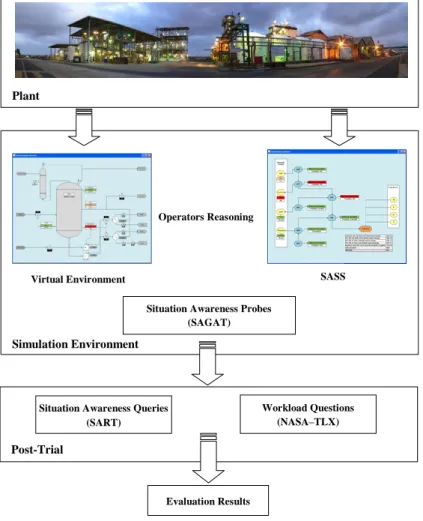
5 A Multi-Perspective Evaluation Approach
Our multi-perspective evaluation approach, illustrated in Figure 8, consists of SAGAT, SART and NASA-TLX metrics to measure different aspects of operators’ SA. SAGAT assesses SA by comparing the real-time conditions of the environment with the probe answers reported by the operator. Operator-in-the-loop simulation exercises are managed by a personal computer that employs the design concepts of interest; in our case, the virtual environment interface alone in one monitor and the SASS interface in an adjacent monitor. The simulation activity is suspended at randomly selected intervals, the displays are blanked, and queries are administered to the participant. Data collected by the computer are used to score the participant’s responses as correct or incorrect based on what was actually happening in the scenario at that time.
SART assesses SA by asking operators to rate the quality of their SA during a specified
period. This rating is then used to compare the quality of SA when the virtual user interface is used alone and when it is used with SASS. SART is inexpensive, easy to perform, simple to analyze, and employable without the need to disrupt performance, however it may include
Simulation Environment
Virtual Environment
Operators Reasoning
Situation Awareness Probes (SAGAT)
Plant
Simulation Environment
Figure 8: A multi-perspective evaluation approach.
SASS
Post-Trial
Situation Awareness Queries (SART)
Workload Questions (NASA–TLX)
inaccuracies due to operator self-reporting. Therefore, the use of SART in conjunction with SAGAT can engender confidence that the levels of operator SA provided are accurate.
In addition to SAGAT and SART, the approach includes NASA-TLX to represent the workload of operators who are managing situations with both systems. To perform this assessment, operators answer the NASA-TLX questionnaire after each scenario. The results are used to determine which aspects of the work contribute the most to the operators’ perceived workload. Computerized SART and NASA-TLX questionnaires are administered once per scenario post-trial using a laptop.
5.1 Participants
Ten operators with good experience (M=5.40 yrs, SD=1.42) and currently involved in the operation of an oil refinery served as participants. All participants were made familiar with the simulation software and features of SASS used in the present study. Based on observed values, the operators had to identify abnormal situations and the actions required to address those abnormal situations. The test participants were introduced to the characteristics of abnormal situations in the environment before the evaluation.
5.2 Experiments
A within-subjects design, also called a repeated-measures design, was considered due to the number of participants. The same group of subjects participated in two treatments.
5.2.1 Scenarios Development
To prepare for a routine operation, the vessel is filled with solvent and heated. Methomyl is added to the residue treater and a normal recirculation loop flow is activated to mix the concentrated methomyl feed with preheated solvent in the residue treater. The operator opens the feed control valve and begins feeding flasher bottoms into the vessel. At normal flow rate, it takes approximately 10 minutes to fill the residue treater to 50 percent, the normal operating level. The recirculation pump is then started. Two 40-min counterbalanced scenarios are defined. In Scenario 1, the residue treater liquid level reaches approximately 51 percent after 17 minutes and the temperature ranges between 130 and 135°C. The pressure is 22 psig. The temperature begins to rise steadily about 2 degrees per minute when the recirculation flow suddenly drops to zero after 30 minutes. In less than three minutes, the temperature is at 147°C, the highest safe operating limit. Table 5 shows the timeline of Scenario 1.
Table 5: Scenario 1 timeline. Time into
scenario (min) Event
00:00 Scenario is started 05:00 Level reaches 30%.
07:00 Flow is steady at normal rate and temperature is about 130°C.
09:00 Automatic feed valve is opened and flasher bottoms are introduced into the vessel. 17:00 Level reaches 51% and the pressure is 22 psig.
18:00 Automatic feed valve is closed.
23:00 The temperature begins to rise steadily about 2 degrees per minute. 30:00 The recirculation flow suddenly drops to zero.
31:00 The temperature is at 147 °C, the highest safe operating limit.
31:00 The risk level of SAR increases from acceptable to tolerable not acceptable. 32:00 The risk level of SHP is steady and acceptable.
32:00 The risk level of SHT and SHC increases from acceptable to tolerable not acceptable. 37:00 The risk level of SRR remains acceptable.
39:00 Scenario is ended.
Gases that have evolved from the methomyl decomposition reaction pass through the vent condenser to the flare system. The gas flow carries trace amounts of solid material into the vent system where they are deposited on the surface of the pipe. Over time, the accumulating deposits will choke the flow and cause the pressure of the residue treater to climb. In Scenario 2, the residue treater liquid level reaches approximately 50 percent after 10 minutes and the temperature is 130°C. The pressure begins to rise sharply when the vent condenser pipeline is blocked. Table 6 shows the timeline of Scenario 2.
Table 6: Scenario 2 timeline. Time into
scenario (min) Event
00:00 Scenario is started
04:00 Flow is steady at normal rate.
05:00 Automatic feed valve is opened and flasher bottoms are introduced into the vessel. 10:00 Level reaches 50%, temperature is 130°C, and automatic feed valve is closed. 15:00 Vent condenser piping is blocked by accumulating deposits.
17:00 Pressure is starting to rise sharply.
19:00 The pressure is at 25 psig, in the high state of its safe operating limit. 22:00 The risk level of SVC increases from acceptable to tolerable not acceptable. 25:00 The risk level of SHC remains acceptable.
25:00 The risk level of SHP increases from acceptable to tolerable not acceptable. 36:00 The risk level of SRR remains acceptable.
39:00 Scenario is ended.
5.2.2 Within-Subjects Design
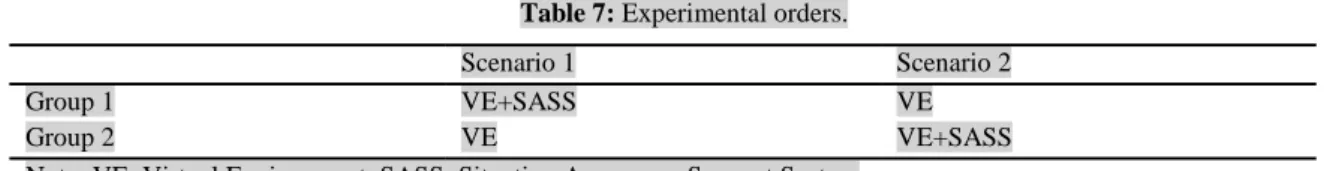
The within-subjects design has the advantage of having high statistical power and a reduction in the error variance associated with individual differences. However, a fundamental disadvantage of the within-subjects design is the phenomenon of ―practice effects‖, which are caused by the practice and growing experience of the participants as they move through the sequence of conditions. This effect is due to the participants’ growing familiarity with the procedures. To control for this effect, the order in which the scenarios are presented to the participants needs to be randomly determined or counterbalanced. Counterbalancing was therefore performed by randomly placing participants in two groups and presenting conditions to each group in a different order, as shown in Table 7.
Table 7: Experimental orders.
Scenario 1 Scenario 2
Group 1 VE+SASS VE
Group 2 VE VE+SASS
Note: VE: Virtual Environment, SASS: Situation Awareness Support System
5.3 Objective Measurement
Situation awareness was first measured by applying SAGAT. The operators executed the experimental scenarios using the virtual environment user interface with or without SASS, as ordered in Table 7. Five freezes occurred at randomly selected intervals and could not be predicted by the operators. At the time of the freeze, the displays were blanked and the simulations were suspended. Each freeze lasted approximately two minutes. The 13 questions summarized in Table 8 were derived from the GDTA results shown in Table 1 and were asked in the first trial, and the questions summarized in Table 9 were administered in the second trial.
Table 8: Probe questions for Scenario 1. Time into
scenario (min) SA
level Question
07:00 Level 1 What is the current level of temperature? (Low, Normal, High) 07:00 Level 1 What is the current level of flow? (Very low, Low, Normal) 18:00 Level 1 Climbing, decreasing, or steady: Which is correct for liquid level? 24:00 Level 2 Which abnormal situation threatens the unit? (SHL, SVC, SAR)
24:00 Level 2 What is the most probable explanation? (Failure of the recirculation pump, Failure of cooling water isolation valve, Failure of automatic level control)
24:00 Level 3 What is the current level of risk of the abnormal situation? (Acceptable, Tolerable acceptable, Tolerable not acceptable, Not acceptable)
31:00 Level 1 Climbing, decreasing, or steady: Which is correct for temperature? 31:00 Level 2 Which abnormal situations threaten the unit? (SHT, SHC, SRR) 31:00 Level 2 What are the best actions for reduction or containment of risk?
31:00 Level 3 What will be the level of risk? (Acceptable, Tolerable acceptable, Tolerable not acceptable, Not acceptable)
32:00 Level 3 What are the risk levels of SHT and SHC? (Acceptable, Tolerable acceptable, Tolerable not acceptable, Not acceptable)
32:00 Level 2 What are the best actions for reduction or containment of risk? (Temperature transmitter, Manual water valve, Automatic feed valve)
32:00 Level 3 Is SRR abnormal? (Yes, No)
Table 9: Probe questions for Scenario 2. Time into
scenario (min) SA
level Question
10:00 Level 1 What is the current level of temperature? (Low, Normal, High) 10:00 Level 1 What is the current level of pressure? (Very low, Low, Normal) 17:00 Level 1 Climbing, decreasing, or steady: Which is correct for pressure? 17:00 Level 2 Which abnormal situation threatens the unit? (SVC, SHT, SAR)
17:00 Level 2 What is the most probable explanation? (Failure of the recirculation pump, Failure of cooling water isolation valve, Failure of automatic level control)
22:00 Level 3 What is the current level of risk of the abnormal situation? (Acceptable, Tolerable acceptable, Tolerable not acceptable, Not acceptable)
25:00 Level 1 Climbing, decreasing, or steady: Which is correct for temperature? 25:00 Level 2 Which abnormal situations threaten the unit? (SHT, SHC, SRR) 25:00 Level 2 What are the best actions for reduction or containment of risk?
25:00 Level 3 What will be the level of risk? (Acceptable, Tolerable acceptable, Tolerable not acceptable, Not acceptable)
33:00 Level 3 What are the risk levels of SHT and SHC? (Acceptable, Tolerable acceptable, Tolerable not acceptable, Not acceptable)
33:00 Level 2 What are the best actions for reduction or containment of risk? (Loss of chilled cooling water supply, Cooling water isolation valve is inadvertently closed)
The responses to all the queries were collected at each stop via an online questionnaire system adjacent to the operator’s station. All responses were scored as 1 for a correct answer and 0 for an incorrect answer. The total SAGAT scores were calculated by summing all the correct responses for each participant, giving a possible total score of 13. Table 10 shows the SAGAT scores under different systems.
Table 10: The SAGAT scores under different systems.
System SA level
Perception Comprehension Projection Overall
M SD M SD M SD M SD
VE 3.10 0.76 0.60 0.48 0.80 0.17 4.50 2.27
VE+SASS 3.80 0.17 4.50 0.27 3.30 0.45 11.60 1.37
The mean total SAGAT score without using SASS is 4.50 (SD =2.27). The highest total SAGAT score is 7 and the lowest score is 3. The mean overall SAGAT score for level 1 SA probes is 3.10 (SD = 0.76) while it is 0.60 (SD = 0.48) and 0.80 (SD =0.17) for levels 2 and 3, respectively. As can be seen, the SAGAT scores for levels 2 and 3 are much lower in comparison to level 1.The mean total SAGAT score with the support of SASS is 11.60 (SD
=1.37). The highest total SAGAT score is 13 and the lowest SAGAT score is 9. The SAGAT score decomposition corresponding to SA levels is 3.80 (SD = 0.17) for level 1, 4.50 (SD = 0.27) for level 2, and 3.30 (SD = 0.45) for level 3. Analysis of variance (ANOVA) shows that the SAGAT rating of SA is significantly higher with the support of SASS than without
F(1,18)=137.90 p<0.001. The results particularly indicate the improvement of SA in levels 2 and 3 with the support of SASS.
5.4 Subjective Measurement
Situation awareness was also measured using SART. The SART questionnaire required participants to use a 1-7 scale (1=Low and 7=High) and to rate 10 factors (shown in Table 11) in three categories: understanding of the situation, demand on attention resources, and supply of attention resources. Responses to the SART questions (shown in Table 12) resulted in a score for each of the three major factors, as well as an overall score for SA. The overall SART score was calculated as SA=U-(D-S) where U is a sum for understanding, D is the summation of attention demand, and S is the summation of attention supply.
Table 11: The SART factors.
Domain Construct Definition
Understanding Information quantity The amount of knowledge that an operator receives and understands Information quality The goodness degree of knowledge that an operator gains
Familiarity with situation The degree of being familiar with the situation Attention Demand Instability of situation The situation is unstable and likely to change suddenly
Variability of situation The number of variables in the situation that are changing Complexity of situation The situation is complicated or straightforward
Attention Supply Arousal The degree of alertness that the operator has for doing the activity Spare mental capacity The amount of mental ability that the operator has for new variables Concentration of attention The number of aspects in the situation that demand the operator’s
concentration
The SART rating of SA was inferred as being significantly higher with SASS than without it, F(1,18)=228.57, p<0.001. The mean overall SART score when using the virtual environment interface alone was 19.2 (SD=1.51) while the mean overall SART score in obtaining support of SASS was 27.2 (SD=1.28). As summarized in Table 12, the highest and lowest overall SART scores for the former were 21 and 17, and for the latter, 29 and 24. Participant scores were examined for each SART dimension and these showed that the result was mainly attributable to differences in the subject rating of understanding (p<0.001).
Table 12: The operators’ responses to the SART questions.
Operator O1 O2 O3 O4 O5 O6 O7 O8 O9 O10 Used Artifact A B A B A B A B A B A B A B A B A B A B Q1 4 6 3 7 4 7 5 7 5 7 5 7 5 7 5 7 4 6 4 6 Q2 4 6 3 6 5 6 4 6 5 6 4 7 4 6 4 6 4 6 4 6 Q3 5 6 5 6 6 7 4 7 5 7 5 7 4 7 5 6 5 6 5 6 Q4 4 4 4 4 4 4 4 4 4 4 4 4 4 4 5 5 3 5 4 4 Q5 4 4 3 4 4 4 4 4 4 4 4 4 4 4 4 4 3 5 4 4 Q6 5 5 5 5 5 5 5 5 5 5 4 5 3 5 5 5 5 5 5 5 Q7 4 6 4 4 4 4 4 5 4 6 4 5 3 5 5 6 4 6 5 6 Q8 5 6 5 5 5 5 5 5 6 5 4 5 4 5 5 6 5 6 5 7 Q9 4 5 4 6 4 6 4 5 4 6 5 5 5 6 5 5 4 5 4 5 Q10 5 5 5 5 5 5 5 6 5 5 5 5 5 4 5 5 5 5 5 5 Understanding 13 18 11 19 15 20 13 20 15 20 14 21 13 20 14 19 13 18 13 18 Attention Demand 13 13 12 13 13 13 13 13 13 13 12 13 11 13 14 14 11 15 13 13 Attention Supply 18 22 18 20 18 20 18 21 19 22 18 20 17 20 20 22 18 22 19 23 SART=U-(D-S) 18 27 17 26 20 27 18 28 21 29 20 28 19 27 20 27 20 25 19 28
Note: A: Virtual Environment, B: Virtual Environment + SASS.
5.5 Workload Measurement
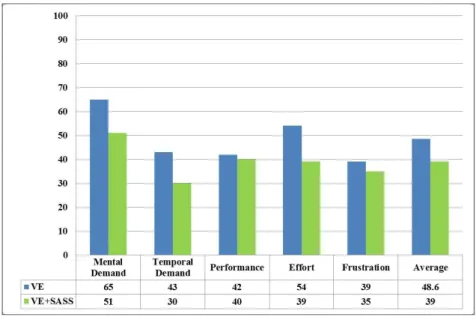
The NASA-TLX consisted of six independent sub-scales: Mental, Physical, Temporal Demands, Frustration, Effort, and Performance. Users were asked to rate the perceived workload on a continuous scale (one scale per dimension) with three anchors (low, medium, and high). The results of these tools could be displayed as individual workload dimensions, or as overall workload scores. The five questions asked are shown in Table 13.
Table 13: The NASA-TLX questions.
Domain Question
Mental Demand How mentally demanding was the task? Temporal Demand How temporally demanding was the task?
Performance How successful were you in accomplishing what you were asked to do? Effort How hard did you have to work to accomplish your level of performance? Frustration How insecure, discouraged, irritated, stressed, and annoyed were you?
The participants’ answers were scaled to the range of 0 to 100, as shown in Figure 9. As can be seen, working with SASS produces better results than working without it in four domains. In just one domain, i.e. performance, the results are lower when the operators use the support system. The average of the results from the five questions is also depicted in Figure 9. It can be concluded that working with the proposed SASS for this specific environment results in a lower workload for decision makers than working without it.
Figure 9: NASA Task Load Index results.
If α = 0.05 is chosen, the ANOVA analysis reveals that there is no significant effect on workloads in the use of the virtual environment with or without SASS, for this specific environment. It can generally be concluded that to prove that a better workload is produced for operators, SASS should be validated through a variety of scenarios in different environments with more participants. In addition, as the results depend strongly on the visualization of the user interface, the system should be evaluated using a range of visualization techniques for recognized situations.
5.6 Correlation between SA Metrics
The analysis of the correlation between SAGAT and SART is presented in Table 14. As can be seen, there is no significant correlation between the participants’ SA scores assessed by these two measures. This shows that the SART and SAGAT measurements evaluate different items in respect of SA during the study. In other words, they view SA differently and measure different elements of operator awareness. SAGAT, a probe recall approach, essentially measures the extent to which a participant is aware of pre-defined elements in the environment, their understanding of the properties of these elements in relation to the task they are performing, and
what the potential future states of these elements might be. SART, on the other hand, provides a measure of how aware participants’ perceived themselves to be during task performance (based on ratings of understanding, supply and demand) and does not refer to the different elements within the environment. Each method therefore takes a different view of what SA is and what it comprises and, as the lack of correlation between the measures indicates, the methods measured different things in the assessment of participant SA.
Table 14: SAGAT and SART correlations.
SART SART U SART D SART S
SAGAT -0.26681 Not Sig 0.285942 Not Sig -0.1122 Not Sig -0.60033Not Sig
SAGAT Level 1 -0.37139 Not Sig 0.149256Not Sig 0.234261Not Sig -0.37139Not Sig
SAGAT Level 2 -0.37139Not Sig -0.0995 Not Sig -0.37139Not Sig -0.37139Not Sig
SAGAT Level 3 0.058001 Not Sig 0.481736 Not Sig -0.21951Not Sig -0.52201Not Sig
The correlation results are consistent with other SA measure comparison studies such as [19] and [20], in which SAGAT and SART were utilized by the former in the assessment of fighter pilots’ SA and by the latter to assess participants’ SA during a military planning task. Both studies reported that there was no correlation between measures. Subjective measures of SA have also been criticized from a number of other dimensions. Nowadays, it is believed that measures like SART are recognized as measures of meta-SA [29]. Whether observer judgments of SA are good or not seems to depend entirely on the observable features. If those features are unambiguously reflective of understanding the situation—as would be the case with implicit performance features—then observation by another person might be acceptable. However, it is critical that what is observed is SA and not performance.
6 Conclusion and Future Work
The importance of cognitive decision support systems for managing abnormal situations in safety-critical environments has been highlighted. A situation awareness support system (SASS) that assists operators to understand and project situations in such environments was developed in our previous study [1] and has been partially validated by a sensitivity analysis carried out to evaluate the knowledge-base of the system. To fully and systematically evaluate SASS, it needs to be empirically tested to identify unforeseen issues that might negatively impact operator SA. Therefore, appropriate measures must be employed to assess the level of operator SA in their interaction with SASS. This paper demonstrates a multi-perspective approach for this purpose. The approach consists of two direct SA measurements, SAGAT and SART, and a workload metric called NASA-TLX. SAGAT is an objective measure of SA that assesses a participant’s SA by querying the participant on the pertinent SA requirements relevant in randomly-timed freezes for the domain of interest. SART is also a subjective measure that provides an assessment of SA by some systems based on operators' subjective opinions. NASA-TLX is a widely-used, multidimensional assessment tool that rates perceived workload, or a team's
effectiveness, or other aspects of performance, in order to assess a system. Ten experienced operators participated in a counterbalanced within-subjects experiment to respond to the simulation scenarios using a virtual environment, with and without the support of SASS. The results show that SASS improves operator SA, particularly in levels 2 and 3. However, its effect on operator workload needs more investigation.
The proposal for the future direction of this research is to optimize SASS based on the design principles of SA-oriented design processes, which have been established to guide the development of systems that support SA. These principles include general guidelines for coping with automation and complexity, the design of alarm systems, and the presentation of information uncertainty. It has been shown that SASS aids SA, thus another future direction would be to investigate how SASS aids performance.
Acknowledgment
The work presented in this paper was supported by the Australian Research Council (ARC) under Discovery Project DP140101366.The authors sincerely thank the participants in this study who evaluated the systems.
References
[1] Naderpour M, Lu J, Zhang G. An intelligent situation awareness support system for safety-critical environments. Decision Support Systems. 2014;59:325-40.
[2] Isaac A, Shorrock ST, Kirwan B. Human error in European air traffic management: The HERA project. Reliability Engineering & System Safety. 2002;75:257-72.
[3] Sneddon A, Mearns K, Flin R. Situation awareness and safety in offshore drill crews. Cognition, Technology & Work. 2006;8:255-67.
[4] Taylor RM. Situational Awareness Rating Technique (SART): The development of a tool for aircrew systems design. Situational Awareness in Aerospace Operations1990. p. 1-17.
[5] Endsley MR. Toward a theory of situation awareness in dynamic systems. Human Factors: The Journal of the Human Factors and Ergonomics Society. 1995;37:32-64.
[6] Adams MJ, Tenney YJ, Pew RW. Situation awareness and the cognitive management of complex systems. Human Factors. 1995;37:85-104.
[7] Bedny G, Meister D. Theory of activity and situation aewareness. International Journal of Cognitive Ergonomics. 1999;3:63-72. [8] Van den Broek AC, Neef RM, Hanckmann P, Van Gosliga SP, Van Halsema D. Improving maritime situational awareness by fusing sensor information and intelligence. Proceedings of the 14th International Conference on Information Fusion (FUSION), 2011. p. 1-8.
[9] Farahbod R, Avram V, Glasser U, Guitouni A. Engineering situation analysis decision support systems. European Intelligence and Security Informatics Conference (EISIC). Athens, Greece2011. p. 10-8.
[10] Ghanea-Hercock R, Gelenbe E, Jennings NR, Smith O, Allsopp DN, Healing A, et al. Hyperion-next-generation battlespace information services. The Computer Journal. 2007;50:632-45.
[11] Smart PR, Russell A, Shadbolt NR, Carr LA. Aktivesa: A technical demonstrator system for enhanced situation awareness. The Computer Journal. 2007;50:703-16.
[12] Baader F, Bauer A, Baumgartner P, Cregan A, Gabaldon A, Ji K, et al. A novel architecture for situation awareness systems The 18th International Conference on Automated Reasoning with Analytic Tableaux and Related Methods. Oslo, Norway2009. p. 77-92.
[13] Brannon NG, Seiffertt JE, Draelos TJ, Wunsch II DC. Coordinated machine learning and decision support for situation awareness. Neural Networks. 2009;22:316-25.
[14] Kim YJ, Hoffmann CM. Enhanced battlefield visualization for situation awareness. Computers & Graphics. 2003;27:873-85. [15] Niu L, Lu J, Zhang G, Wu D. FACETS: A cognitive business intelligence system. Information Systems. 2013;38:835-62. [16] Endsley M. Measurement of situation awareness in dynamic systems. Human Factors: The Journal of the Human Factors and Ergonomics Society. 1995;37:65-84.
[17] Endsley MR, Bolté B, Jones D. Designing for situation awareness: An approach to user-centered design: Taylor & Francis; 2003.
[18] Endsley MR, Garland DJ. Situation awareness: Analysis and measurement. Mahwah, NJ: Lawrence Erlbaum; 2000. [19] Endsley MR, Selcon SJ, Hardiman TD, Croft DG. A comparative analysis of SAGAT and SART for evaluations of situation awareness. Proceedings of the human factors and ergonomics society annual meeting: SAGE Publications; 1998. p. 82-6. [20] Salmon PM, Stanton NA, Walker GH, Jenkins D, Ladva D, Rafferty L, et al. Measuring situation awareness in complex systems: Comparison of measures study. International Journal of Industrial Ergonomics. 2009;39:490-500.
[21] Jones DG, Endsley MR. Use of real-time probes for measuring situation awareness. International Journal of Aviation Psychology. 2004;14:343-67.
[22] Pierce RS, Strybel TZ, Vu K-PL. Comparing situation awareness measurement techniques in a low fidelity air traffic control simulation. Proceedings of the 26th International Congress of the Aeronautical Sciences (ICAS), Anchorage, AS2008. [23] Matthews MD, Martinez SG, Eid J, Johnsen BH, Boe OC. A Comparison of observer and incumbent ratings of situation awareness. Human Factors and Ergonomics Society Annual Meeting: SAGE Publications; 2005. p. 548-51.
[24] Waag WL, Houck MR. Tools for assessing situational awareness in an operational fighter environment. Aviation, Space, and Environmental Medicine. 1994;65:A13-9.
[25] Paige Bacon L, Strybel TZ. Assessment of the validity and intrusiveness of online-probe questions for situation awareness in a simulated air-traffic-management task with student air-traffic controllers. Safety Science. 2013;56:89-95.
[26] Endsley MR. Direct measurement of situation awareness: Validity and use of SAGAT. In: Endsley MR, Garland DJ, editors. Situation awareness analysis and measurement. Mahwah, NJ: Lawrence Erlbaum Associates; 2000. p. 147-73.
[27] Endsley MR, Farley TC, Jones WM, Midkiff AH, Hansman RJ. Situation awareness information requirements for commercial airline pilots. International Center for Air Transportation; 1998.
[28] Jenkins DP, Stanton NA, Walker GH. Distributed situation awareness: Theory, measurement and application to teamwork: Ashgate Publishing, Ltd.; 2012.
[29] Durso FT, Dattel AR, Banbury S. SPAM: The real-time assessment of SA. In: Banbury S, Tremblay S, editors. A cognitive approach to situation awareness: Theory and application. Aldershot, UK: Ashgate; 2004. p. 137-54.
[30] Niu L, Lu J, Zhang G. Cognition-driven decision support for business intelligence: Models, techniques, systems and applications. Berlin Heidelberg: Springer-Verlag; 2009.
[31] Endsley MR. Situation awareness. In: Salvendy G, editor. Handbook of human factors and ergonomics: John Wiley and Sons; 2006. p. 528-42.
[32] Naderpour M, Lu J, Zhang G. A situation risk awareness approach for process systems safety. Safety Science. 2014;64:173-89. [33] Naderpour M, Lu J, Zhang G. The explosion at Institute: Modeling and analyzing the situation awareness factor. Accident Analysis & Prevention. 2014;73:209-24.
[34] CSB. Pesticide Chemical Runaway Reaction Pressure Vessel Explosion. Washington, DC2011.
[35] Naderpour M, Lu J, Zhang G. An abnormal situation modeling method to assist operators in safety-critical systems. Reliability Engineering & System Safety. 2015;133:33-47.
[36] Monferini A, Konstandinidou M, Nivolianitou Z, Weber S, Kontogiannis T, Kafka P, et al. A compound methodology to assess the impact of human and organizational factors impact on the risk level of hazardous industrial plants. Reliability Engineering & System Safety. 2013;119:280-9.
[37] Baraldi P, Sogaro A, Konstandinidou M, Nivolianitou Z. An interface for enhancing repeatability in human reliability analysis. International Journal of Performability Engineering. 2013;9:13.
![Figure 1: The situation awareness support system model [1].](https://thumb-us.123doks.com/thumbv2/123dok_us/10653259.2953101/8.892.144.761.280.510/figure-situation-awareness-support-model.webp)
![Figure 2: Methomyl synthesis process flow [34].](https://thumb-us.123doks.com/thumbv2/123dok_us/10653259.2953101/9.892.292.644.554.848/figure-methomyl-synthesis-process-flow.webp)
![Figure 4: Residue treater piping system layout [34].](https://thumb-us.123doks.com/thumbv2/123dok_us/10653259.2953101/10.892.262.630.116.393/figure-residue-treater-piping-system-layout.webp)