Method for correction of VFA loss in determination of
dry matter in biomass
(Metod för korrigering av VFA-förlust vid bestämning av torrhalt
i biomassa)
Cecilia Vahlberg, Erik Nordell, Lina Wiberg, Anna Schnürer
”Catalyzing energygas development
for sustainable solutions”
Postadress och Besöksadress Scheelegatan 3 Telefonväxel 040-680 07 60 E-post [email protected]
Method for correction of VFA loss in determination of dry matter in biomass (Metod för korrigering av VFA-förlust vid bestämning av torrhalt i biomassa)
Cecilia Vahlberg, Erik Nordell, Lina Wiberg, Anna Schnürer
Denna studie har finansierats av: Energimyndigheten
Tekniska verken i Linköping AB Sveriges lantbruksuniversitet Avfall Sverige
Göteborg Energi AB Svenskt Vatten Utveckling Stockholm Gas AB
ALcontrol AB E.ON Sverige AB NSR AB
Rapporten finns också publicerad av:
Svenskt Vatten Utveckling – Rapport C SGC2013-273 Avfall Sverige – Rapport U2013:05
Svenskt Gastekniskt Center AB, SGC
Om SGC
SGC är ett spjutspetsföretag inom hållbar utveckling med ett nationellt uppdrag. Vi arbetar under devisen”Catalyzing energygas development for sustainable solutions”. Vi
samordnar branschgemensam utveckling kring framställning, distribution och användning av energigaser och sprider kunskap om energigaser. Fokus ligger på förnybara gaser från rötning och förgasning. Tillsammans med företag och med Energimyndigheten och dess kollektivforskningsprogramEnergigastekniskt utvecklingsprogramutvecklar vi nya möjligheter för energigaserna att bidra till ett hållbart samhälle. Tillsammans med våra fokusgrupper inomRötning,Förgasning och bränslesyntes,Distribution och lagring,
Kraft/VärmeochGasformiga drivmedel identifierar vi frågeställningar av branschgemensamt intresse att genomföra forsknings-, utvecklings och/eller
demonstrationsprojekt kring. Som medlem i den europeiska gasforskningsorganisationen GERG fångar SGC också upp internationella perspektiv på utvecklingen inom
energigasområdet.
Resultaten från projekt drivna av SGC publiceras i en särskild rapportserie –SGC Rapport. Rapporterna kan laddas ned från hemsidan –www.sgc.se. Det är också möjligt att prenumerera på de tryckta rapporterna. SGC svarar för utgivningen av rapporterna medan rapportförfattarna svarar för rapporternas innehåll.
SGC ger också ut faktabroschyrer kring olika aspekter av energigasers framställning, distribution och användning. Broschyrer kan köpas via SGC:s kansli.
SGC har sedan starten 1990 sitt säte i Malmö. Vi ägs av Eon Gas Sverige AB, Energigas Sverige, Swedegas AB, Göteborg Energi AB, Lunds Energikoncernen AB (publ) och Öresundskraft AB.
Malmö 2013
Martin Ragnar
Swedish Gas Technology Centre, SGC
SGC is a leading-edge company within the field of sustainable development having a national Swedish assignment. We work under the vision of“Catalyzing energygas development for sustainable solutions”. We co-ordinate technical development including manufacture, distribution and utilization of energy gases and spread knowledge on energy gases. Focus is on renewable gases from anaerobic digestion and gasification. Together with private companies and the Swedish Energy Agency and its frame program
Development program for energy gas technologywe develop new solutions where the energygases could provide benefits for a sustainable society. Together with our focus groups on
Anaerobic digestion,Gasification and fuel synthesis,Distribution and storage,Power/Heat
andGaseous fuelswe identify issues of joint interest for the industry to build common research, development and/or demonstrations projects around. As a member of the European gas research organization GERG SGC provides an international perspective to the development within the energygas sector
Results from the SGC projects are published in a report series –SGC Rapport. The reports could be downloaded from our website –www.sgc.se. It is also possible to subscribe to the printed reports. SGC is responsible for the publishing of the reports, whereas the authors of the report are responsible for the content of the reports.
SGC also publishes fact brochures and the results from our research projects in the report seriesSGC Rapport. Brochures could be purchase from the webiste.
SGC is since the start in 1990 located to Malmö. We are owned by Eon Gas Sverige AB, Energigas Sverige, Swedegas AB, Göteborg Energi AB, Lunds Energikoncernen AB (publ) and Öresundskraft AB.
Malmö, Sweden 2013
Martin Ragnar
Foreword
This project, “Method for correction of VFA loss in determination of dry-matter”, was initiated by the department of FoU Biogas at Tekniska verken i Linköping AB. The project group consisted of Cecilia Vahlberg, Erik Nordell, Lina Wiberg
(Tekniska verken in Linköping AB) and Anna Schnürer (Swedish University of Agricultural Sciences, SLU). The project started in May 2012 and was completed in February 2013 when this report was published.
The project had a reference group consisting of the following representatives:
Tobias Persson SGC (program director)
Irene Bohn NSR AB
Summary
There is an increasing demand for bio-methane, as a renewable energy source. To accomplish a stable, efficient and optimal biogas production, it is important to monitor the digestion process. Imbalance in the digester may be caused by e.g. insufficient process-follow up and poor characterization and control of the substrates properties. Parameters often used to evaluate the stability and the efficiency of the biogas production process are the hydraulic retention time (HRT), organic loading rate (OLR), the specific gas production and the degree of
degradation. These parameters (except for the HRT) are all calculated based on the volatile solids (VS) content, which is the organic part of the dry-matter (DM) content.
A common technique to determine the DM content is by oven-drying. This is a very simple and robust method where water is evaporated and the dry matter of the sample remains. However, a disadvantage of the method is that volatile molecules (in addition to water) are lost during the drying. Volatile substances include among others, volatile fatty acids (VFAs) and alcohols. This may result in an
underestimation of the DM content, and subsequently also an underestimation of the VS content. Consequently, this will result in errors in all the parameters that are calculated based on DM and VS.
In this project, the focus was to understand the evaporation of VFAs from different substrates used for biogas production and digestates (biofertilizer) during the DM-analysis, by oven-drying at 105oC for 20 hours.
First, a method for analyzing the concentration of VFAs in oven-dried materials by first dissolving the dried material in MilliQ water was confirmed. This method was used throughout the project.
Moreover, the majority of the dissolved total organic carbon that was lost during
the DM-analysis was confirmed to be VFAs (≈75%). Consequently, determination
quantification of the evaporation of VFA from substrates and digestates during DM-analysis are therefore of greatest importance.
In this study four different biogas substrates and three digestates were included in the laboratory research. Results showed that the majority of the VFAs in all four substrates (with low pH) were lost during the DM-analysis using the oven-drying
method (≥95%). Moreover, the evaporation was not depending on the initial VFA
concentration. In the four substrates, the VFA evaporation will result in significant errors in both the DM and VS analysis of 3-30 %. Errors in parameters calculated based on the observed results varied in size correspondingly to DM and VS. The error increases with increasing ratio between VFA/DM; meaning that the high VFA concentration in relation to the DM content increased the error. It was also shown that the degree of degradation could both be under-estimated and overestimated.
The conclusion of the study was that there are of greatest importance
compensate for the VFA evaporation which occurs during the DM-analysis. This assumes that the VFA content of the substrate should be measured for more correct results of DM and VS. Two methods are suggested to compensate for the VFA evaporation during the DM-analysis. The methods can easily be applied if the DM, VS and VFA content of the substrates or digestates are analyzed.
Sammanfattning på svenska
Intresset för biogas som en förnybar energikälla har under de senaste åren ökat i Sverige. För att kunna upprätthålla en stabil och optimal rötningsprocess är det av väsentlig betydelse att drift- och processdata följs upp och övervakas på ett
tillfredställande sätt. Dessvärre suboptimeras ibland biogasproduktionen på grund av bristande processövervakning. Driftstörningar kan leda till processinstabilitet med minskad biogasproduktion som följd. En förutsättning för en bra
processuppföljning är att kontinuerligt kontrollera och karaktärisera substratet. De vanligaste parametrarna för substratanalys är torrsubstansen (TS, även kallat DM) och glödförlusten (VS, även kallad GF). Ofta analyseras även koncentrationen av VFA och ammoniumkväve, alkalinitet och pH i rötkammaren, men inte alltid kontinuerligt i substraten. Den organiska fraktionen av ett material (VS) mäts ofta som en andel av torrsubstanshalten; VS används för att oberoende av
vatteninnehållet i ett prov, kunna uppskatta den organiska belastningen eller gasproduktionen från ett visst substrat.
Det finns en rad olika processparameterar som används för att övervaka och utvärdera stabiliteten i biogasprocessen. De vanligaste processparametrarna som övervakas är; uppehållstid (HRT), organisk belastning (OLR), specifik
gasproduktion och utrötningsgrad. Dessa parametrar (HRT undantaget) baseras på substratets organiska innehåll, dvs. VS och därmed indirekt TS-halten. TS och VS-halten kan bestämmas med flera olika typer av analysmetoder. Inom VA- och biogasbranschen är det vanligast att TS-halten bestäms genom ugnstorkning vid kontrollerade förhållande, med avseende på tid och temperatur. Enligt den svenska standarden SS 02 81 13 (SIS, 1981) kan TS-mätning ugn appliceras på t.ex. avloppsvatten, slam och sedimentprover. Vid bestämning av TS-halt i ett slam rekommenderas en torktid på 20 timmar vid 105oC. Det finns dock en rad alternativa metoder till ugnstorkning som inte är vanliga vid mätning av slam men desto vanligare inom andra industrier så som livsmedelsindustrin och
skogsindustrin t.ex. Karl-Fisher titrering, infraröd spektrometri och mikrovågs-torkning. Vid flertalet biogasanläggningar används även en snabbmetod för TS-mätning som baseras på torkning av materialet med infraröd strålning (värme).
TS-mätning med hjälp av ugnstorkning används frekvent då den är mycket enkel, billig och kräver inte heller någon avancerad utrustning. Vidare är det enkelt att analysera VS i direkt anslutning till analys av TS i ugn genom att glödga TS-provet vid 550oC i 2 timmar (SIS, 1981). Bestämning av TS-halt genom
ugnstorkning är dock förknippat med vissa antaganden; dels att endast vatten avgår vid upphettningen av materialet, dels att avgången av vatten är den samma i alla typer av material och dels att vi inte får några reaktioner i materialet under upphettningen som påverkar resultatet. Eftersom biogassubstrat innehåller flertalet flyktiga föreningar som t.ex. alkoholer och flyktiga fettsyror finns det därför en ökad risk för avgång av dessa eller liknande föreningar då TS-halten bestäms vid
ugnstorkning. Detta kan således leda till att felaktigt värde på TS-halten och därmed även ett felaktigt VS-värde erhålls och processparametrar som beräknas baserat på dessa blir missvisande.
Det huvudsakliga syftet med projektet var att utvärdera avgången av flyktiga fettsyror (VFA) i matriser av substrat och rötrester vid TS-analys i ugn. Projektet syftade även till att ta fram en metod som för att kompensera för den eventuella förångningen VFA och därmed erhålla ett mer korrekt TS och VS-värde. Inom ramen för projektet utvärderades även förångningen av ammonium och löst
organiskt kol (TOC). Fyra olika substrat och tre olika rötrester analyserades i studien, alla med olika ursprung.
En metod där det torkade TS-provet löstes upp i vatten och därefter analyserades för VFA användes för att utvärdera förångningen av VFA vid ugnstorkning, vid 105oC i 20 timmar. Metoden verifierades genom att höja pH (pH>>pKa) i ett referensprov som innehöll höga koncentrationer av VFA. pH höjdes för att de negativt laddade flyktiga fettsyrorna då skulle interagera med positivt laddade molekyler i materialet och på så sätt inte förångas vid
ugnstorkningen. Resultaten från dessa verifieringstester visade att det var möjligt att analysera de organiska fettsyrorna syrorna efter det att det torkade materialet lösts upp i vatten och att metoden var tillförlitlig. Vidare så analyserades även den totala mängden organisk kol i ett referensprov, före respektive efter ugnstorkning, och relaterades till förångningen av VFA. Resultaten visade att 75 % av de lösta organiska föreningar som förångades vid TS-analysen var flyktiga fettsyror som kunde identifieras vid VFA-analysen. Det är alltså ytterst väsentligt att belysa just avgången av VFA vid TS-analysen.
Resultaten från studien visade att förångningen av VFA vid TS-analys i ugn var mellan 95 % och 100 % för de fyra substratet. Då den ursprungliga totala VFA-koncentrationen varierade mellan de olika substraten (3-17 g VFA/L) tyder detta på att den initiala koncentrationen inte påverkar andelen av VFA som förångas vid upphettning av de fyra substraten. Vidare tyder de utförda försöken på att
förångningen av VFA var oberoende av molekylvikten för de sju flyktiga fettsyrorna som analyserades (från ättiksyra till heptansyra). Eftersom felen mellan de olika substraten varierade går det inte att generalisera felet i VS-vikten för alla typer av substrat. Det är alltså mycket viktigt att analysera koncentrationen av VFA i sitt material för att få en indikation på hur stort felet är vid varje specifik
biogasanläggning eller substratsmix.
I biogödselproverna var resultatet dock annorlunda. Initialkoncentrationerna av VFA var generellt lägre samtidigt som pH-halten var högre. Förångningen i de tre biogödseln var lägre än i de undersökta substraten och varierade mellan 0-55%; med en högre avgång med en ökande koncentration av VFA. En lägre avgång av VFA var också väntad eftersom en större andel av VFA är, teoretiskt sett negativt laddade vid ett högre pH jämfört med vid lägre pH, som t.ex. i de analyserade
substraten. I de fyra substraten var även det ursprungliga pH-värde lågt (≤5.2),
vilket kan jämföras med pH i biogödseln som var nära 8. Detta tyder på att pH är en viktig parameterar som inverkar på andelen VFA som angår vid TS-analys i ugn.
För de fyra substraten resulterade avgången av VFA vid TS-analysen ett fel på 3-31% av VS-vikten. Felet varierade stort från substrat till substrat beroende på kvoten mellan TS och VFA koncentrationen. Följaktligen, substrat som innehöll höga koncentrationer av VFA och samtidigt hade relativt låg TS-halt resulterade i störst fel på VS-vikten.
Om ingen kompensation för avgång av VFA utförs erhålls en högre organisk belastning än önskat. Detta samtidigt som det finns en risk att den specifika gasproduktionen överskattas. Utan kompensering för förångningen av VFA kan man med det substrat som hade högst VFA-avgång av misstag belasta sin process med organisk belastning som är 31 % högre än önskat. Andra konsekvenser som detta kan ge är att felaktiga slutsatser dras t.ex. om två substrat skall jämföras med varandra, varvid det ena innehåller höga
positiva resultat i s.k. utrötningsförsök som ofta används för att värdera ett substrats metangaspotential. Utrötningsgraden baseras på TS och VS i både ingående substrat och utgående biogödsel vilket innebär att felet i denna parameter till och med kan bli högre jämfört med felen i belastning och specifik gasproduktion. Om både substratet och biogödseln innehåller höga
koncentrationer av VFA, vilket kan vara fallet i vissa typer av biogasprocesser, skulle alltså felet kunna bli mycket stort.
Vid utvärdering av förångning observerades även att en stor andel av
ammoniuminnehållet avgår vid TS-analys i ugn. Detta kan vara av betydelse för analysen av biogödsel, där koncentrationen av ammonium är hög relativt TS-halten. Vilken betydelse förångningen av ammonium har för analysresultatet för TS- och VS-halten har inte klargjorts i detta projekt utan bör utredas ytterligare.
För att göra resultaten från studien så generella och lätta att använda på en biogasanläggning eller på ett laboratorium som möjligt har två metoder förslagits med olika noggrannhet för att kompensera för avgången av VFA. I båda
metoderna behöver man ha kännedom om sina material och innehållet av flyktiga fettsyror som potentiellt skulle kunna avgå. Metod 1, baseras på observationen av att flyktigheten för VFA i sura substrat är >95%. För att utföra kompensationen krävs med denna metod analysvärden för VFA, TS och VS i substratet. Metod 2 innebär att kompensationen genomförs på samma sätt som de material som har undersökts i denna studie, genom att VFA analyseras i både vätskefasen samt i den i vatten upplösta torra fasen efter ugnstorkningen. Genom att sedan beräkna graden flyktighet kan ett kompenserat värde för TS och VS beräknas specifikt för just detta material. Denna metod kan alltså användas både på substrat och biogödsel.
Sammanfattningsvis, visar resultaten från denna studie att det är mycket viktig att beakta förångningen av VFA vid TS-analys i ugn. Det är därför viktigt att kompensera uppmätta TS- och VS-värden för den VFA som avgår vid analysen. Metoderna för att kompensera för förångningen som presenteras i denna rapport är enkla att använda, men det kräver att TS, VS och VFA koncentrationen
analyseras på materialen och kontinuerligt följs upp om variationer förekommer i materialen. Genom att kompensera för förångningen av VFA erhålls mer korrekta värden för TS och VS-värden. Detta bidrar till en förbättrad möjlighet att styra och övervaka biogasprocessen liksom en bättre jämförelse av olika driftparametrar mellan olika biogasanläggningar.
Table of contents
1 Background...13 Aim ...14 1.1 Dry-matter content...14 1.2Methods to determine the dry-matter content...16 1.3 Oven-drying methods ...16 1.3.1 Microwave oven-drying...17 1.3.2 Infrared drying...17 1.3.3 Karl-Fischer titration...18 1.3.4
Near infrared spectroscopy...18 1.3.5 Anaerobic digestion...19 1.4 Process biology ...19 1.4.1 Process instability ...20 1.4.2 Process parameters ...21 1.5
Maximum bio-methane potential...21 1.5.1
Specific gas production...21 1.5.2
Organic loading rate (OLR)...22 1.5.3
Degree of degradation ...22 1.5.4
Volatility...23 1.6
The chemistry of volatile fatty acids (VFA)...23 1.6.1
VFA content in the substrate ...25 1.6.2
2 Experimental...26 General analysis procedure ...26 2.1
Validation of the general analysis procedure...27 2.2
Analysis methods and calculations ...27 2.3
Sample preparation ...29 2.4
3 Results and discussion ...30 Samples characterization ...30 3.1
Validation of the general analysis procedure...30 3.2
Evaporation of VFA compared to TOC...31 3.3
Volatility of volatile fatty acids (VFA) ...33 3.4 Substrate S1 ...33 3.4.1 Substrate S2 ...34 3.4.2 Substrate S3 ...35 3.4.3
Substrate S4 ...35 3.4.4 Digestate D1 ...36 3.4.5 Digestate D2 ...37 3.4.6 Digestate D3 ...37 3.4.7
Errors in process parameters due to VFA evaporation...38 3.5
Evaporation of ammonium during the dry-matter analysis ...40 3.6
The volatility of VFA – a summary of the observed results...42 3.7
Methods to compensate DM for VFA evaporation biogas substrates...44 3.8
Method 1 - Rough estimation method...45 3.8.1
Method 2 - Detailed estimation method ...46 3.8.2
4 Conclusions ...48 5 Acknowledgements...49 6 Literature...50
1 Background
The interest for bio-methane as a renewable energy source has increased over the last couple of years. In Sweden, this increasing interest has mainly been due to a growing demand for bio-methane to be used as vehicle fuel. The research publications regarding bio-methane production have also increased over the last couple of years, which shows that there is a large interest for bio-methane as a renewable energy source worldwide (search term “biogas”, Web of Science). The production of bio-methane also has other positive effects for our society, besides the possibility to be used for the production of vehicle fuel, heat and electricity. In commercial bio-methane production, where the degradation of organic material takes place under controlled conditions in biogas digesters instead of just putting it in a landfill, the contribution of methane to the atmosphere can be reduced.
Another positive aspect is that the digestate formed in the digester can be used as a fertilizer, thus decreasing the demand for mineral fertilizers and enabling a recycling of nutrient between urban and rural areas (Tafdrup, 1995; Ward et al., 2008).
In order to accomplish a more efficient and optimal bio-methane production, more knowledge is still required. One important factor in order to accomplish a stable biogas production is a regular surveillance of the digestion process
(Madsen et al., 2011). Changes of operation conditions can have a great impact on the performance of the digestion process. Imbalance in the digester due to poor process follow-up may result in a decrease in the production of biogas or even serious process failures. An imbalance in the digester and a decreased biogas production is often associated with high costs. Reliable control systems are believed to become of great importance for the development and successfulness of the biogas production as an energy source in the future (Lomborg et al., 2009). Knowledge of the characteristics of the substrate and of the digestate is essential for efficient monitoring of the biogas process. With a good characterization of the substrate, parameters such as the organic load to the digester can be optimized and inhibition of the microbial activity can be avoided. Characterization of the digestate is important to determine the nutrient value and the application rate when it is used as a fertilizer. Characterization parameters frequently used in order to control the substrate and the digestate are for example dry-matter content (DM), volatile solids content (VS), concentration of volatile fatty acids (VFAs), pH,
alkalinity and concentration of ammonium.
A common method to determine the DM-value is by oven-drying. In Sweden, this is performed according to, orslightly modified, to the Swedish Standard method: SS 02 81 13 (SIS, 1981). According to SS 02 81 13 (SIS, 1981), DM for sludge samples and sediment samples, should be dried for 20 hours in 105oC and VS is subsequently determined by drying the sample for 2 hours in 550oC. The oven-drying method is robust and easy to use. However, a problem with this method is the evaporation of other molecules besides water during the drying process, which can result in an underestimation of the DM content (Kreuger et al., 2011; Larsen & Jones, 1973; Porter & Murray, 2001; Samuelsson et al., 2006; Weißbach & Strubelt, 2008a; Weißbach & Strubelt, 2008b). If the DM content is underestimated this in turn results in an underestimation of the VS content and consequently also an underestimation of the organic loading rate (OLR), an overestimation of the specific gas production, an overestimation of the methane yield as well as errors in the calculated degree of degradation. This phenomenon
has been observed and is a well-known problem in the field of animal food
production. Volatility coefficients based upon the evaporation of VFAs in different types of silage have been published in the literature (Weißbach & Strubelt, 2008a; Weißbach & Strubelt, 2008b). However, the biogas field has not paid much
attention to this problem. This project focuses on oven DM-analysis and errors in the DM content due to the loss of mainly VFAs during the oven-drying of biogas substrates and biogas digestates.
Aim 1.1
The aim of this study was to develop a method that could be used to compensate for errors obtained in the analysis of the DM content due to the loss of VFAs using the oven-drying technique. To achieve this aim, the evaporation of different VFAs during the oven-drying was investigated and volatility constants were calculated based upon the obtained results. Moreover, the study included an investigation of the possibility to correlate the loss of VFAs during the drying to the total amount of dissolved carbons in the investigated samples. In addition to VFA, the loss of ammonia during the DM-analysis was also analyzed and a literature study of different methods to determine the DM content was performed.
This project was designed to answer five questions:
1. Which VFAs are lost from a sample during the DM-analysis?
2. How much of each VFA is lost from the sample during the DM-analysis? 3. Is the evaporation of the VFAs dependent upon the initial concentrations of
the VFAs in the samples?
4. Does the evaporation of VFAs differ between different types of materials e.g. digestates and substrates and is there a difference between the same types of materials obtained from different full-scale biogas plants?
5. Is there a correlation between the relative amount of VFAs that is lost during the drying and the total amount of carbon (TOC) present in the material?
Dry-matter content 1.2
The dry-matter (DM) content, also known as the total solids (TS), is a widely used parameter for the characterization of substrates and digestates. The DM content is the amount of sample left in a sample after water has been removed (Figure 1). The DM consists of organic material known as the volatile solids (VS) and
inorganic material known as the ash. The VS represent the part of the DM, which can be converted to biogas and is often expressed as a percentage of the DM content.
Figure 1. A schematic figure showing the relationship between the dry-matter (DM) content, the volatile solids (VS) content and the ash content.
The measures DM and VS content are used in operation of biogas plants for different purposes. Generally, these measurements can be divided in three main categories:
Substrate measurements – to monitor the quality of the substrate, organic loading rate and specific biogas production
Digestion measurements – to monitor the process stability
Digestate measurements – to evaluate the quality of the bio-fertilizer
Substrates used for biogas production commonly consist of a variety of different types of organic material. Substrates are characterized to get information of the organic content of a specific substrate or a substrate mixture. A substrate mixture typically contains waste products such as household waste, food industry waste, agriculture waste and sludge from wastewater treatment plants. Other common substrates are silage, stillage, glycerin and alcohols (Carlsson & Uldal, 2009). The substrates may contain different amounts of fat, carbohydrate and protein, all with diverse properties but highly degradable in the biogas process. Agriculture waste and wood residuals may also consist of organic material that is non-biodegradable due to high content of lignin.
In biogas production, it is important to monitor and to know the organic loading rate (OLR) to avoid stress on the microorganisms active in the biogas process and secure stable conditions. The organic content of the substrate and the substrate mixture must be quantified, to be able to calculate the organic load. It is important not to judge the DM content based on the viscosity ofasubstance. The DM of for example milk and cream are approximately 10% and 60%, respectively. In spite of this difference, we experience these products as relatively equally “wet”, which in a biogas context can have devastating consequences as it is the “dry” component that is converted to biogas, and not the water.
Digestion measures are parameters that are used for process monitoring and these parameters are relaying on DM and VS values. These measures are monitoring the effectiveness of the anaerobic degradation. Examples of
parameters in this category are the specific gas production (Nm3kg-1), the organic loading rate (kg VS m-3d-1) and the degree of degradation (%). By following these parameters regularly in daily operation, the process can be closely monitored, which is important to enable a stable biogas production. These measures can also be used for benchmarking the production against other plants and historic data of the biogas plant in operation.
Chemical analyzes are performed on the digestate (also named bio fertilizer). Several plants in Sweden have their bio-fertilizer certified according to SPCR 120 (SP, 2010). These certification rules specify conditions of certification, technical standards and requirements for continuous monitoring of certified bio-fertilizer. Most of the analyzed parameters are expressed as a function of the DM content (SP, 2010).
Methods to determine the dry-matter content 1.3
A number of different methods have been developed to determine the dry-matter (DM) content of various samples. The most frequently used method in Sweden, for biogas applications, is an oven-drying technique. Other methods that can be used to determine the DM content are e.g. the Karl Fisher titration (Petit et al. 1997; Porter and Barton 1997), microwave oven-drying (Marquez et al., 1995), infrared drying near infrared reflection spectroscopy (NIR-spectroscopy) (Lomborg et al. 2009), freeze drying (Samuelsson et al. 2006), distillation (Samuelsson et al. 2006) and acoustic chemometrics (Lomborg et al. 2009).
Oven-drying methods 1.3.1
The oven-drying method can be used to determine the dry-matter (DM) content in various materials. A known amount of a sample is dried in an oven at a set
temperature and for a specific time-period. Water evaporates from the sample during the drying and the relative amount of DM can be calculated by comparing the weight of the sample before and after the drying.
Several different oven-drying methods are used worldwide. In Sweden, drying techniques, that are based upon the accredited Swedish Standard method SS 02 81 13:1981-05-20 (SIS, 1981), are most frequently used in laboratories performing analysis on sludge and sediments. According to this standard, the sample should be dried in an oven at 105°C for 20 hours. However, if the same standard is applied on waste waters, the drying time is only required to be 2 hours (SIS, 1981). According to another oven-drying methods, the samples should first be dried to a constant weight at a temperature of approximately 60-65°C and then dried at 105°C for three hours (Weißbach & Strubelt, 2008a) or the DM content can be determined by just drying the samples until their weight is constant (Samuelsson et al., 2006). Other drying temperatures that are used are in the range of 60-130°C (Porter & Murray, 2001; Samuelsson et al., 2006). Moreover, when determining the water content of yoghurt in Germany, the product should be dried at a temperature of 102°C but in Switzerland it is enough if the yoghurt is dried at 87°C (Isengard & Walter, 1998). Also the weight of the samples that are analyzed may differ (Isengard & Walter, 1998). Due to the fact that so many different oven-drying methods exist, with different temperatures, sample weight and drying times, it is difficult to compare the results and draw conclusions concerning the optimal methodology.
A problem with the oven-drying method, in general, is that other volatile molecules besides water may be lost during the analysis. This can potentially result in an underestimation of the DM content of the analyzed material and subsequently also in the VS content (Kreuger et al., 2011; Larsen & Jones, 1973; Porter & Murray, 2001; Samuelsson et al., 2006; Weißbach & Strubelt, 2008a; Weißbach & Strubelt, 2008b). There might also a risk that side reactions or degradation of the substances in the samples are initiated by the heating.
However, the oven-drying technique has also many advantages, which is the reason why this method often is preferred for the analysis of the DM content. The main advantages with oven-drying are that the technique is very simple, robust and straightforward. Furthermore, the technique does not require any advanced nor sophisticated equipment. Consequently, a low-cost instrument with low operating costs can be used. A number of samples can also be analyzed at the same time. Furthermore, by applying oven-drying, the content of volatile solids (VS) can easily be measured by first determining the DM content and thereafter, with the same sample, determine the VS content in an oven at 550°C. The DM determination with oven-drying is in many ways suitable for substrates and digestate from biogas plants. However, it is clear that improvements giving better control of the loss of volatile organic compounds are necessary.
Microwave oven-drying 1.3.2
The motivation for the development of microwave oven-drying techniques was to shorten the measurement time compared to the oven-drying methods (Isengard & Walter, 1998). The risk of introducing side reactions is also reduced when
shortening the drying time (Reh & Gerber, 2003).
When using the microwave oven-drying technique, one can choose to dry the sample during a certain time or to dry the sample until the weight is constant, as when using the oven-drying technique. The results might vary when drying
different amounts of the samples during a certain time. Consequently, it is better to dry the samples until the weight of the sample is constant (Isengard & Walter, 1998). If the materials contains molecules that absorbs light in the microwave region, care needs to be taken to avoid overheating of the materials (Reh & Gerber, 2003). The technique is very straightforward and the measurement time as well as the analysis time is fast. The measurement with microwave technique applied on dairy products is fast with a time of analysis of less than 5 min (Reh & Gerber, 2003). According to our knowledge it is not common to use microwave oven-drying to analyze the DM content in samples used in the biogas production.
Infrared drying 1.3.3
The infrared (IR) drying method to determine the DM content is a quick and
commonly used at full scale biogas plants. The sample is dried with IR radiation at a certain temperature during a specific time, e.g. at 120°C for 20 minutes. The measurement time is thus shorter than the oven-drying, but it is normally only possible to analyze one sample at the time. The DM content is calculated by comparing the weight of the samples before and after the drying, as for the oven-and microwave-drying. Commercially available instruments for infrared drying exists that are very simple to use. When a material is heated there is always a risk that other molecules besides water, such as the VFAs, are lost during the analysis.
A higher value of the DM is often observed when comparing values obtained from infrared drying with DM values from oven-drying for the same sample. This could be due to e.g. that the loss of VFAs is lower and that not all of the water has been removed from the samples.
Karl-Fischer titration 1.3.4
The Karl-Fisher (KF) titration method was developed in the mid-1930thand it is a frequently used method to determine the DM content in for example food (De Caro et al., 2001; MacLeod, 1991). The method is based on the highly selective reaction between water (H2O) and iodine (I2) and can be used to detect very low
concentrations of water. The detection can be either colorimetric or volumetric. The water in the samples needs to be unbound to be able to react with iodine and therefore the samples need to be processed before the analysis. The preparation of the samples can take between 1-2 hours depending on the sample type but the actual measurement is fast (1-2 minutes). Alternative preparation methods to decrease the time before the measurement have been presented in the literature (De Caro et al., 2001).
A problem with the KF titration method is that side reactions, between the materials to be analyzed and the chemicals used in the titration, are possible (MacLeod, 1991). These reactions can cause errors in the results, resulting in an underestimation or overestimation of the water content in the analyzed material (MacLeod, 1991). From the analysis of the results it can be very complicated to separate a KF titration involving side reactions from a normal KF titration.
One other complication when using KF titration method is that iodine can be oxidized by for example Fe3+, Cu2+and NO2-(MacLeod, 1991). As a result, the water content will be underestimated since the oxidized iodine cannot react with water present in the sample. The water content can also be underestimated if the analyzed materials contain sulfur dioxide and molecules, which contain a carbonyl functional group e.g. aldehydes or ketones, since these can form complexes with water (MacLeod, 1991).As the materials used for anaerobic digestion often contains a very large variety of molecules and substances it seems reasonable to assume that the Karl-Fischer method to determine the water content in these materials might be complicated. However, this still needs to be investigated.
Near infrared spectroscopy 1.3.5
Near infrared spectroscopy (NIR) has been suggested as a potential technique to be used for online monitoring on full scale plants and the method has e.g. been used to measure the DM content (Lomborg et al., 2009), the VS content (Nordberg et al., 2010) and the amount of VFAs (Lomborg et al., 2009) in substrates. The materials are irradiated with electromagnetic radiation and quantitative information regarding e.g. the DM content can be obtained by analyzing how much of the electromagnetic radiation that is absorbed, transmitted or reflected by the material (Lomborg et al., 2009; Nicolaïa et al., 2007). For NIR, electromagnetic radiation with a wavelength between 780-2500 nm is being used (Nicolaïa et al., 2007).
Anaerobic digestion 1.4
Process biology 1.4.1
In order to degrade organic material to methane and carbon dioxide in a biogas process a close cooperation between different microorganisms, with different metabolic capacities, is required (Gerardi, 2003). Many organisms are also so called syntrophs, i.e. they benefit from the activity of each other and successfully break down organic matter (substrate) that neither one could manage alone.
During the formation of biogas, complex polymers and structures are hydrolyzed to simple monomers, in the first step (Figure 2). Fat is for example converted to fatty acids and glycerol, proteins into amino acids, and cellulose and starch into
glucose. The produced monomers are taken up by the bacteria in the next step, called the ‘fermentative step’ or the acidogenesis. During this step, monomers are converted into smaller compounds such as ethanol, lactic acid and volatile fatty acids (VFAs), such as acetic acid, propionic acid, butyric acid. In addition,
hydrogen gas (H2) and carbon dioxide (CO2) are also formed (Gerardi, 2003). The produced VFAs are further converted to acetic acid, hydrogen gas and carbon dioxide, provided that the hydrogen is kept at a low pressure by a rapidly
consumption by hydrogenotrophic (hydrogen-consuming) methane formers. Acetic acid, hydrogen gas (H2) and carbon dioxide (CO2) form the primary substrates for acetoclastic (acetic acid-consuming) and hydrogenotrophic methane formers, respectively (Gerardi, 2003). The methane-forming step is generally considered to be rate-limiting in the biogas process but the hydrolysis step can also be the bottle neck in the degradation, depending on the character of the substrates. This means that the rate of the hydrolysis step might for some substrates, e.g. cellulose or other polymeric materials, be slower than the methane-forming step.
At least three co-operating organism populations are required to achieve
complete degradation of organic matter to methane and carbon dioxide. However, in a properly functioning biogas process, there are often many more due to the complexity of the ingoing material.
Figure 2. Degradation of organic matter to methane and carbon dioxide under anaerobic conditions.
Process instability 1.4.2
It is important for the degradation process that the biological system is balanced and that the cooperation between the different groups of bacteria is effective. If too much volatile solids continuously are fed into the reactor, and the microorganisms are unable to consume all VFAs formed, an increase in acetate and hydrogen gas ensues. High concentrations of hydrogen gas and acetate may lead to further imbalance in the degradation process and as a consequence various VFAs may start to accumulate (Ahring et al., 1995). If the process instability is driven further, this will result in a decrease in alkalinity, finally resulting in a decrease in pH. When pH decreases a larger amount of the VFAs become uncharged and more
repellant of water. If this situation is allowed to continue, there is a high risk for foaming (Ganidi et al., 2009).
Process parameters 1.5
There are several biogas process parameters of importance for operation and surveillance of biogas digester, including DM and VS content. Many of these parameters are used both in research and full scale operation. The main parameters depending on DM and VS are further explained, in this section.
Maximum bio-methane potential 1.5.1
A common way to determine the potential of a certain substrate is to perform a bio-methane potential test. This type of test is normally performed in lab-scale batch conditions and gives information of the potential methane production of the substrate. For a full-scale production plant, this test is for example of interest during an evaluation concerning the possible economical profit to treat a specific substrate. In this test, the DM and VS value of the substrate is of critical
importance as the methane production from the investigated substrate is related to the VS content. Thus, a correct DM and VS measurement is essential. If the DM or VS is underestimated, due to loss of VFA or other organic compounds, the
maximum bio-methane potential may be overestimated which can lead to wrong decisions at a full-scale plant or wrong conclusions in scientific reports.
Specific gas production 1.5.2
The specific gas production provides information about the gas potential of the added substrates to the digestion process. When treating a constant and similar substrate mixture (inlet feed) each day, a stable and equal specific gas production is expected. Even if the inlet-flow to the digesters varies, the specific gas
production should be similar from one day to another due to the normalization to the organic loading rate (Equation 1). Change in the specific gas production that cannot be related to change of substrate or dramatic change in OLR can indicate that the process is undergoing a process disturbance.
Equation 1)
ܩܽݏܨ݈ݓ
ܦܯ௦௨௦௧௧כܸܵ௦௨௦௧௧כܸ݈ݑ݉ ݁௦௨௦௧௧כቆ
ܰ݉ଷ݃ܽݏ
ܸ݇݃ܵ ቇ
Also here a correct VS value is essential. An underestimation of the VS will result in an overestimation in the specific gas production. This overestimation possesses a problem when e.g. evaluating the biogas potential of different substrates,
potentially resulting in wrong decision regarding the priorities of the substrate of interest. Variations in analysis results for DM and VS due to differences in the concentration of volatile substances within the substrate will also result in incorrect conclusion that the calculated specific gas production is varying.
Organic loading rate (OLR) 1.5.3
OLR is a parameter which gives information about the amount of organic material that is being fed to the digester, with a specific volume. OLR can easily be
calculated (Equation 2) if the flow, DM and VS of the substrate are known. Equation 2)
ܸ݈ݑ݉ ݁௦௨௦௧௧כܦܯ௦௨௦௧௧כܸܵ௦௨௦௧௧
ܸ݈ݑ݉ ݁ௗ௦௧כ݀ כ൬
ܸ݇݃ܵ
݉ଷכ݀൰
When performing wet anaerobic digestion at mesophilic temperatures (~37°C), typical values for the OLR are 2-4 kg VS m-3d-1(Ek et al., 2011; Nordell et al., 2013). In a thermophilic process these values are slightly higher. The optimal condition for the microorganisms is to maintain an OLR as stable as possible. Overloading a digesters and having a rapidly fluctuating OLR may lead to accumulation of VFAs, which in turn can cause a decrease in pH and consequently a decrease in gas yield due to stressed microorganisms. Conclusively it is important to secure a stable and not to high OLR. Thus, underestimation of DM and VS may cause severe problems as this my mistake could results in an overload, giving unfavorable conditions for the microorganism present in the digester.
Degree of degradation 1.5.4
Degree of degradation is a parameter used for evaluation of the process
efficiency. This parameter does not take into account the biogas potential of the added substrate. Instead the degree of the degradation is a parameter that describes the amount of added organic material that actually has been converted into biogas under the prevailing conditions. A high value of the degree of
degradation indicates a well performing digestion process and an easily
degradable substrate. Calculations can be performed according to equation 3. Due to the restrictions of the CSTR-system (continuous in- and outtake) and energy need for the microorganism’s growth, the degree of degradation normally do not exceed 80%. During the calculation both DM and VS content of the substrate as well as of the digestate are used. Consequently using false low values of DM and VS may result in large errors.
The degree of degradation will be overestimated if the VS of the digestate is underestimated. As a consequence, wrong conclusions concerning the process performance could be made, i.e. one could think the process is still working
properly since the degree of degradation is high despite the fact that the digestate contains a lot of VFAs. This could then lead to wrong decision concerning the priority when choosing between different substrate to be used in the biogas production. The degree of degradation will be overestimated if the VS of the digestate is underestimated. This could contribute to mistakes due to the fact that one would think the process is still working properly since the degree of
Equation 3)
൬ͳെܦܯܦܯௗ௦௧௧כܸܵௗ௦௧௧
௦௨௦௧௧כܸܵ௦௨௦௧௧൰כͳͲͲ(%)
Volatility 1.6
The volatility of molecules is dependent both on the chemical properties of the molecules themselves and upon the surrounding environment. Volatile molecules have a high so-called vapor pressure at a certain temperature compared to other molecules (Ebbing, 1993). An example of a very volatile molecule is chloroform, which has a vapor pressure of 160 mmHg at a temperature of 20°C
(www.sigmaaldrich.com). This can be compared to ethanol and water, which have vapor pressures of 44.6 and 17.3 mmHg, respectively at the same temperature (20°C) (Table 1). Normally, the vapor pressure decreases with the molecular weight when comparing molecules with similar molecular structure. This can be observed for the VFAs that have been investigated in this study (Table 1). The lowest vapor pressure is found for heptanoic acid (<0.1 mmHg) and the highest is found for acetic acid (11.4 mmHg). Consequently, acetic acid is, when just
considering the vapor pressure, more volatile than heptanoic acid. In order for a molecular transition to occur from the liquid phase to the gas phase (vaporization), the kinetic energy of the molecules in the liquid must become higher than their potential energy (Ebbing, 1993), which is determined by e.g. intermolecular interactions such as electrostatic interactions or hydrogen bonding. This means that if molecules in a liquid are charged, thus interacting with other charged molecules, the volatility decreases.
The chemistry of volatile fatty acids (VFA) 1.6.1
The intermediary products from the acidogenesis are volatile compounds such as organic acids and alcohols. Alcohols such as methanol and ethanol have a much higher vapor pressure and lower boiling points compared to the VFAs (Table 1). Methanol and ethanol have boiling points below 100°C, while all the VFAs have boiling points above 100°C (Table 1).
Table 1. The properties of different volatile compounds such as volatile fatty acids and alcohols.
Compounds Formula pKa1 Mol weigth 1 (g/mol) TOC (%) Boiling point (oC) Vapor pressure (mm Hg)** Formic acid CH2O2 3,75 46,0 26% 1011
Acetic acid C2H4O2 4,75 60,0 40% 1181 11,42 Propionic acid C3H6O2 4,87 74,0 49% 1411 2,42 Lactic acid C3H6O3 3,86 90,1 40% 122
Butyric acid C4H7O2 4,82 88,1 54% 1631 0,432 Iso-butyric acid C4H8O2 4,86 88,1 54% 155
1 1,52
Valeric acid C5H10O2 4,82 102,1 59% 1861 0,152 Iso-Valeric acid C5H10O2 4,78 102,1 59% 176 0,382 Hexanoic acid C6H12O2 4,88 116,1 62% 2061 0,182 Iso-hexanoic acid C6H12O2 4,85 116,1 62%
Heptanoic acid C7H14O2 4,71 130,1 65% 223 <0,12
Methanol CH4OH - 32,0 36% 65 97,72 Ethanol C2H5OH - 46,1 52% 78 44,62 Propanol C3H7OH - 60,1 60% 97 332 * Theoretical ** At 20 °C 1 SI-data 2 sigma-aldrich
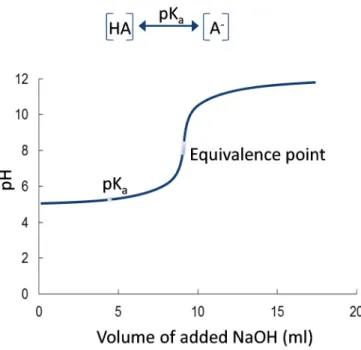
Charged VFAs will interact with other charged molecules/substances in the materials. Consequently, these VFAs will have a lower volatility compared to uncharged VFAs. The degree of ionization is determined by the pH of the material and majority of the VFAs will be uncharged if the pH<<pKa (Figure 3).
Figure 3. A typical titration curve for a buffered system such as a biogas substrate with a low pH to which a base is added. At the pKa, the amount of ionized and unionized acids is equal for a certain acid.
VFA content in the substrate 1.6.2
Even though a substrate, originally, normally consists of fat, protein and
carbohydrates, this may not be the fact when the substrates enter the digestion process. With easy available substrates such as food waste and slaughterhouse waste, the degradation often starts already when the substrates are held in stock in e.g. storage tanks at the biogas plant. The biological activity may be particularly high during the summer when the temperature is high. This biological process does typically not include methanogenesis but the substrates may undergo the first steps in the anaerobic process: the hydrolysis and the acidogenesis. This may lead to an early start of the anaerobic process and formation of multiple organic compounds such as alcohols and volatile fatty acids, which can contribute to a very low pH of the substrate. The low pH is an unsuitable condition for
methanogenesis to occur, and therefore the VFA is still within the substrate when it finally enters the digester. The VFA concentration in a substrate mixture can thus sometimes represent a large share of the DM and the VS content, which make it important to ensure that a reliable method for DM and VS measurement is applied to avoid an underestimate of the VS content.
2 Experimental
Seven materials were investigated in this study. The study included three different substrates from full scale biogas plants in Sweden: two pasteurized food and slaughterhouse mixtures, abbreviated S1 and S2, as well as one grass silage material, abbreviated S3. The study also included sludge from grease separators, to be treated at a water treatment plant in Sweden, abbreviated S4. Besides the four substrates, the study also included three digestates, abbreviated D1, D2 and D3. The digestates D1 and D2 originated from two different full scale plants in Sweden. The digestate D3 originated from a bio-reactor used in a lab-scale experiment.
General analysis procedure 2.1
The concentrations of DM, VFA, pH, ammonium and TOC were all determined with the same analysis procedure for all samples.
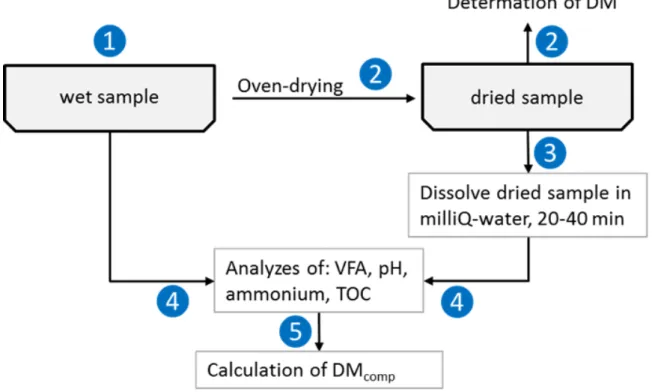
Figure 4. A sketch of the analysis procedures used in the project. 1) A known weight of the wet material was placed in the DM-oven.
2) The DM content was determined according to the description in Chapter 2.3 (Analysis methods and calculations)
3) A known amount of MilliQ water (≈9-20 g depending on the sample) was
solution (dissolved dried sample + MilliQ water) was then stirred for 15-30 minutes.
4) The VFA concentration, the pH or the dissolved TOC in the original sample as well as the soaked dissolved dried sample were analyzed according to the description in Chapter 2.3. For the ammonium analysis, the dried material was investigated according to the procedure described in Chapter 2.3 (Analysis methods and calculations).
5) Calculations were performed to determine the VFA compensated DM-value (DMcomp, Equation 7), i.e. the amount of acids that evaporated during the drying (difference between VFA content in the wet and dried sample) were added to the DM value.
Validation of the general analysis procedure 2.2
To verify that it was possible to analyze VFA in dried samples, which had been dissolved in MilliQ water, the pH was increased in test samples (pH>11) before the DM analysis using oven-drying. The modification of pH was performed by adding approximately 30 ml of 1M NaOH to about 100 ml of substrate S1 (S1NaOH) and by adding 29 ml of 1M NaOH to 107 ml of the substrate S2 (S2NaOH). The
concentration of VFA in the wet sample was compared to the concentration of the VFA in the dissolved dried sample.
Analysis methods and calculations 2.3
The DM was analyzed by drying a known weight (~10 g) of the wet sample (wet weight) according to SS 02 81 13 (SIS, 1981); in an oven for 20 hours at 105 °C. The samples were then placed in a desiccator, to avoid accumulation of water, until the samples had cool down and the weight of the material was thereafter measured (DM weight).
To determine the VS, the dried material was further heated at 550 °C for 3 hours, which is slightly modified compared to the SS 02 81 13 (SIS, 1981) where 2 hours which is stated. The material was then allowed to cool down in a
desiccator before the weight of the material was measured (ash weight). The DM and VS were analyzed in at least six independent samples for each of the
investigated materials. The DM (%) and VS (% of DM) were calculated according to equations 4 and 5, respectively. The VFA concentration within the dried sample was calculated according to equation 6 and the volatility according to equation 7. Equation 4)
Equation 5) ൭1 –൬ܣݏܦܯ ݓ݁݅݃ℎݐ൰൱ℎݓ݁݅݃ℎݐ ∗ 100 =ܸܵ(%݂ܶܵ) Equation 6) ܸܨܣௗௗ,௦ (݉ ݃/ܮ) =ܸܨܣௗ௦௦௩ௗ,ௗௗ∗ቆ൫݉௦ ݉ ,ௗௗ+݉௪ ௧൯ ௦ ,௧ ቇ(݉ ݃/ܮ) Equation 7) ܸܨܣ௩௧௧௬(%) =ቆ1 −ܸܨܣܸܨܣௗௗ,௦ (݉ ݃ ܮ⁄ ) ௪ ௧,௦ (݉ ݃ ܮ⁄ ) ቇ∗ 100
The VFA compensated DMcompand VScomp were calculated according to the Equations 8 and 9, where DMmis the measured DM value, VSmis the measured VS value and VFAvolatilityis the volatility of the VFA based upon the total
concentration of VFA. Equation 8) ܦܯ (%) = DM୫(%) +൭ܸܨܣ௩௧௧௬100 (%) ∗ܸܨܣ௧(݉ ݃ ܮ⁄ )൱∗ 10ିସ Equation 9) ܸܵ ൫% ofܦܯ ൯ = ൫DM(%)∗ܸܵ (%)൯+ (10ܦܯ (%)ିସ∗ܸܨܣ௩(%)∗ܸܨܣ(݉ ݃/ܮ))
The VFAs were analyzed using a Clarus 550 gas chromatograph (Perkin Elmer, USA) equipped with a packed Elite-FFAP column used for acidic compounds (Jonsson & Borén, 2002). The VFA was analyzed in at least three independent wet samples and three independent dissolved dried samples for each of the investigated materials and the presented values are the average of the three measurements. The presented VFAs concentrations for the dissolved dried
samples have been correlated for the dilution with MilliQ water. The average of the concentration is presented with a 95% confidence interval.
The ammonium (NH4-N) was analyzed according to the FOSS Tecators application sub note 3502 using a Kjeltec 8200 distillation system (FOSS in Scandinavia, Sweden). The ammonium was analyzed in at least three
independent wet samples and three independent dissolved dried samples for all the materials. The presented concentration is the average of the three
independent measurements with a 95% confidence interval. The presented
that the concentration of ammonium includes both the ammonium in the NH4-N state as well as the NH3-N state.
The TOC was determined in the dissolved fraction of the S1 substrate by centrifugation of the substrate (11 000 rpm, 20 min) and thereafter filtration of the supernatant trough 0.45 µm Millipore filter, TOC was then determined in the filtrate. TOC was analyzed with the instrument Multi N/C 3100 (AnalytikJena UK, United Kingdom) according to the guidelines in SS-EN 1484. Here, the organic carbon in the sample is oxidized to carbon dioxide, using a patina catalyzer and the carbon dioxide concentration is then determined by a NDIR detector. Three independent analyzes were performed on the wet sample and the dissolved dried sample of S1. The pH was measured using a potentiometric pH-meter (WTW
Inolab, USA), equipped with a Hamilton electrode, at ≈25°C.
Sample preparation 2.4
The materials S1, S2, D1, D2 and D3 were stored in a freezer at -20 °C until use. The substrates S3 and S4 were placed in a refrigerator at +4 °C and analyzed very shortly after the materials had been received at Tekniska verken. The silage
substrate (S3) was diluted in water (S3: Water, 1:5.3) and mixed with a hand blender prior to the analysis of VFAs, pH and ammonium. DM and VS were measured on undiluted material of S3 as described in Chapter 2.3.
3 Results and discussion
The main focus of this project was the evaporation of VFAs, from different materials used in the biogas production, during the DM-analysis by oven-drying. The results from the analyzed substrates and digestates are presented and discussed with respect to the volatility of VFA and the potential errors in DM, VS and different important biogas parameters. The result from evaporation analyzes of ammonium and the total organic carbon are also shown and discussed.
Furthermore, two different methods to be used to compensate for errors in DM and VS, due to the loss of VFA, are proposed.
Samples characterization 3.1
Seven different materials were analyzed in this project: two pasteurized mixtures of substrates (S1 and S2), one grass silage (S3), one sludge material from grease separators (S4) and three different digestates (D1, D2 and D3). The
characteristics of the seven analyzed materials can be found in Table 2.
Table 2. The characteristics of the materials included in this study.
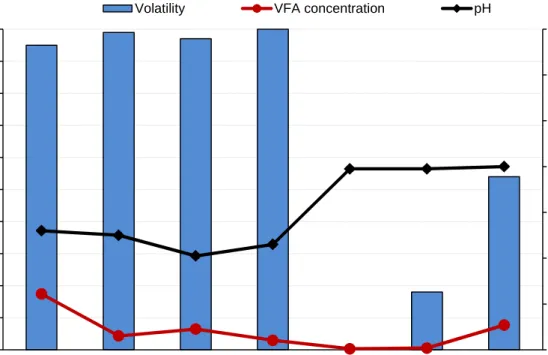
Sample DM (%) VS (% of DM) VFA (mg/L) NH4-N (mg/kg) pH S1 7.2 ± 0.2 75 ± 2.0 17 000 ± 570 1 370 ± 39 5.2 ± 0.0 S2 14 ± 0.5 91 ± 0.4 4 300 ± 61 514 ± 142 5.0 ± 0.0 S3 23 ± 0.4 91 ± 0.1 6 500 ± 4 453 ± 206 4.1 ± 0.0 S4 3.6 ± 0.2 99 ± 1.1 3 000 ± 20 48 ± 5 4.6 ± 0.0 D1 3.4 ± 0.0 56 ± 0.2 320 ± 13 2 880 ± 117 7.9 ± 0.1 D2 4.7 ± 0.1 73 ± 0.2 460 ± 33 2 810 ± 65 7.9 ± 0.0 D3 4.2 ± 0.2 76 ± 1.0 7 700 ± 200 5 340 ± 106 8.0 ± 0.0
Validation of the general analysis procedure 3.2
The same general analysis procedure was used in this project to measure the concentration of VFAs in the dried samples. This analysis procedure is described in Chapter 2.1. The samples were first dried and then dissolved in MilliQ water prior to the analysis. To verify this procedure, the pH of substrates S1 and S2 was increased to above 11 before the oven-drying. The S1 and S2 samples to which the NaOH was added are hereafter abbreviated S1NaOHand S2NaOH. The aim with this modification of pH was to increase the degree of ionization of the VFAs in the samples. The negatively charged VFAs may interact with positively charged molecules and remain in the sample during the drying and the evaporation should be minimized. Consequently, the concentration of VFAs in the wet and dissolved dried samples should be about the same if the method to analyze VFA in dry materials dissolved in MilliQ is working. The observed results for the pasteurized mixture of materials, S1NaOHand S2NaOHare presented in Tables 3 and 4,
Table 3. The concentrations of VFAs in the wet and the dissolved dried samples of S1NaOH(pH>11) and the calculated volatility. The volatility has been calculated
according to Equation 7.
Volatile fatty acid Wet sample
(mg/L)
Dissolved dried sample (mg/L) Volatility (%) Acetic acid 6 000 6 100 0 Propionic acid 2 300 2 100 9 Butyric acid 1 300 1 100 15 Iso-butyric acid 300 200 33 Pentanoic acid 930 970 0 Iso-pentanoic acid 300 250 17 Hexanoic acid 1 600 1 700 0 Iso-hexanoic acid 100 80 20 Heptanoic acid 300 250 17 Sum VFA (mg/L) 13 000 12 800 2
The volatility when considering the total concentration of VFAs was calculated to be 2 and 20% for S1NaOHand S2NaOH, respectively. These results are in agreement with a previous published article by (Derikx et al., 1994). According to this study, VFAs can be fixed in manures during oven-drying when the pH is above 10. The observed results showed that a majority of the VFAs was detected in both S1NaOH and S2NaOH, thus indicating that the method of analyze VFA within a dried samples works.
Table 4. The concentration of VFAs in the wet and the dissolved dried samples of S2NaOH(pH>11) and the calculated volatility (%).The volatility has been calculated
according to Equation 7.
Volatile fatty acid Wet sample
(mg/L)
Dissolved dried sample (mg/L) Volatility (%) Acetic acid 3 000 2 800 7 Propionic acid 660 400 39 Butyric acid 500 280 44 Iso-butyric acid 70 30 57 Pentanoic acid 260 140 46 Iso-pentanoic acid 100 70 30 Hexanoic acid 160 120 25 Iso-hexanoic acid 30 20 33 Heptanoic acid 100 70 30 Sum VFA (mg/L) 4 900 3 900 20
Evaporation of VFA compared to TOC 3.3
The dissolved fraction of total organic carbons (TOC) was analyzed in the
substrate with the highest VFA concentration, substrate S1, before oven-drying as well as after oven-drying. By analyzing both VFA and dissolved TOC, the mass-balance of organic carbon within the samples was calculated. Only the dissolved fraction of the samples was analyzed, assuming that no TOC was transferred from solid to dissolved TOC during the oven-drying procedure. During the oven-drying, the dissolved TOC decreased from approximately 16 700 mg/L down to about 6
100 mg/L, while the VFA level decreased from approximately 17 000 mg/L to 780 mg/L (Table 5). The concentration of VFAs in the wet sample corresponded theoretically to about 8 300 mg TOC/L whereas the concentration of VFA in the dissolved dried sample corresponded to approximately 360 mg TOC/L. It should be notified that since the theoretical value of TOC in each VFA differ; calculations of each individual VFA were performed for these calculated TOC values.
Table 5. VFA and TOC within the wet and dissolved dried samples.
Parameter Wet sample
(mg/L)
Dissolved dried sample (mg/L)
Evaporation (mg/L)
VFA 17 000 ± 570 780 ± 140 16 220
Calculated TOC as VFA* 8 300 360 7 940
Measured dissolved TOC 16 700 ± 650 6 100 ± 220 10 600
* Evaporation based on theoretical calculations. No standard division is given.
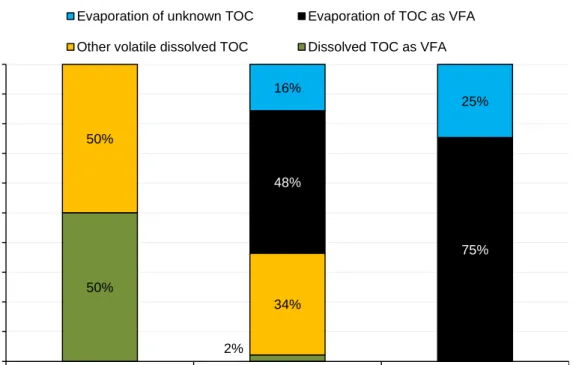
The evaporated part of TOC, expressed as the difference between wet and dissolved dried sample, corresponded to approximately 10 600 mg TOC/L. However, the amount of evaporated TOC as VFA (data analysis) was only about 8 000 mg TOC/L, corresponding to about 75% of the evaporated TOC during the drying (Figure 5 Subsequently, this indicates that approximately 25% of the
evaporated volatile substances were not detected in the VFA analysis. As the TOC method only gives value of organic carbon, this fraction represents unknown
volatile organic compounds. However, there are some VFAs that are not detected
in the used VFA analysis, such as formic acid (boiling point of ≈101 °
C) and lactic
acid (boiling point of ≈122 °
C). Other common organic compounds that also are volatile and might be present in different types of substrate mixtures are e.g. methanol, ethanol and acetone. However, as illustrated in Figure 5, 75% of the evaporated volatile organic compounds can be detected in VFA-analysis, which shows that a VFA-compensation method is relevant and could result in a
Figure 5. Distribution of volatile dissolved TOC within the wet sample before drying and in the dried sample after oven-drying.
Volatility of volatile fatty acids (VFA) 3.4
Substrate S1 3.4.1
As can be seen in Table 6, the analysis of the degree of evaporation of VFAs from S1, a pasteurized mixture of an organic material, with a very high concentration of VFAs (>17 000 mg/L), showed a total loss of 95% of VFA in the oven-dried sample (dissolved dried sample) compared to non-dried sample (wet sample). The highest concentration of acids in substrate S1 was observed for acetic acid, which
corresponded to approximately 47% of the total concentration of VFAs in the material. The lowest concentration was found for iso-hexanoic acid, which contributed to less than 1% of the total concentrations of the VFAs. Both these VFAs, present at high and low concentrations, as well as other VFAs present in the sample were lost to an almost equal extent during the drying. Consequently, this result indicated that the evaporation of the VFAs was not dependent on the initial concentration of the individual acids in the substrate S1.
50% 2% 50% 34% 48% 75% 16% 25% 0% 10% 20% 30% 40% 50% 60% 70% 80% 90% 100%
Wet sample Dried sample Evaporated part
D is tr ib u ti o n o f d is s o lv e d T O C (% )
Evaporation of unknown TOC Evaporation of TOC as VFA Other volatile dissolved TOC Dissolved TOC as VFA
Table 6. The concentration of VFAs in substrate S1, before and after the DM-analysis and the VFA volatility. The mean values are presented with a 95%
confidence interval and the volatility has been calculated according to Equation 7.
Volatile fatty acid Wet sample
(mg/L)
Dissolved dried sample (mg/L) Volatility (%) Acetic acid 8 300 ± 560 460 ± 53 94 Propionic acid 3 100 ± 110 94 ± 21 97 Butyric acid 1 900 ± 230 68 ± 17 96 Iso-butyric acid 300 ± 20 6 ± 5 98 Pentanoic acid 1 300 ± 250 46 ± 13 96 Iso-pentanoic acid 500 ± 20 10 ± 5 98 Hexanoic acid 1 700 ± 400 77 ± 21 96 Iso-hexanoic acid 100 ± 6 5 ± 3 96 Heptanoic acid 200 ± 10 10 ± 6 92 Sum VFA (mg/L) 17 000 ± 570 780 ± 140 95
The pH of material S1 was measured prior to the drying and was found to be 5.2. After the drying the pH was found to be 5.9. This increase in pH indicates that the composition of substrate S1 had changed during the drying. The increase in pH could be partly explained by the loss of VFAs but there are many other
compounds, in addition to VFA, that can have an influence on the pH, such as the ammonium/ammonia system as well as the carbonate system. Consequently, it is likely that the change in pH is not only due to the evaporation of the VFAs.
Substrate S2 3.4.2
Substrate S2 initially contained 4 300 mg VFA/L, of which acetic acid was the dominating acid (Table 7). Despite the fact that the substrates S2 and S1 have a similar origin, the VFA concentration was about 4 times higher in S1 compared to S2. The observed volatility of VFA was 99% during the DM analysis of substrate S2 (Table 7). This is a slightly higher volatility compared to sample S1. Moreover, an increase in pH was detected during the DM-analysis for S2 from a pH of 5.0 to 5.8, in agreement with the observed change in pH for substrate S1.
Table 7. The concentrations of VFAs in substrate S2, before and after the DM-analysis and the VFA volatility. The mean values are presented with a 95%
confidence interval and the volatility has been calculated according to Equation 7.
Volatile fatty acid Wet sample
(mg/L)
Dissolved dried sample (mg/L) Volatility (%) Acetic acid 2 600 ± 0 49 ± 11 98 Propionic acid 660 ± 10 0 ± 0 100 Butyric acid 470 ± 21 3 ± 1 99 Iso-butyric acid 70 ± 3 0 ± 0 100 Pentanoic acid 220 ± 9 0 ± 0 100 Iso-pentanoic acid 100 ± 20 0 ± 0 100 Hexanoic acid 110 ± 16 0 ± 0 100 Iso-hexanoic acid 20 ± 1 0 ± 0 100 Heptanoic acid 30 ± 3 0 ± 0 100 Sum VFA (mg/L) 4300 ± 61 52 ± 11 99
Substrate S3 3.4.3
The silage (substrate S3) had a different origin compared to the substrates S1 and S2, which were pasteurized food and slaughterhouse mixtures. The VFA profile of S3 was shown to be very different from S1 and S2. The substrate S3 contained only acetic acid (99%;
Table 8), while the substrates S1 and S2 contained all of the VFAs. The total VFA concentration, within the substrate S3, was 6 500 mg VFA/L. During the DM-analysis of the substrate S3, 97% of the VFAs were evaporated (
Table 8). This is in line with the results from samples S1 and S2 but higher than the results presented by Porter and Murray (2001), which observed a volatility of approximately 89%. However, in this study, the silage was heated at 100°C for 16 hours, thus another oven-drying method was used compared to the one in this study. Analogic to the observed results in the substrates S1 and S2, the pH increased during the DM-analysis from 4.1 to 4.8.
Table 8. The concentration of VFA in substrate S3 before and after the DM-analysis and the VFA volatility. The mean values are presented with a 95%
confidence interval and the volatility has been calculated according to Equation 7. Volatile fatty acid Wet sample (mg/L) Dissolved dried
sample (mg/L) Volatility (%) Acetic acid 6400 ± 0 190 ± 56 97 Propionic acid 2.0 ± 5 1.0 ± 2 – Butyric acid 16 ± 1 0 ± 0 100 Iso-butyric acid 0 ± 0 0 ± 0 – Pentanoic acid 0 ± 0 0 ± 0 – Iso-pentanoic acid 0 ± 0 0 ± 0 – Hexanoic acid 23 ± 0 0 ± 0 100 Iso-hexanoic acid 0 ± 0 0 ± 0 – Heptanoic acid 0 ± 0 0 ± 0 – Sum VFA (mg/L) 6 400 ± 4 190 ± 57 97
* The uncertainty in the concentration of propionic acid in the silage was very high since the results varied very much between the three independent samples. Consequently, it would be incorrect to calculate the volatility based upon these results.
Silage normally contain higher concentrations of lactic acid compared to VFAs, alcohols and ammonia-nitrogen. The volatility of lactic acid in silage has however been found to be lower (<38%) than VFAs, ammonia and alcohols (Porter & Murray, 2001; Weißbach & Strubelt, 2008a). In this study, the volatility of lactic acid for S3 was however not analyzed.
Substrate S4 3.4.4
The initial VFA concentration in S4 (3 000 mg VFA/L), was lower than the other analyzed substrates. It was found that almost all of the VFAs were lost during the DM-analysis, giving a volatility of 100%, when considering the total concentration of VFA (Table 9). This is in agreement with the observed results for S1, S2 and S3. The pH was increased in S4 during the DM-analysis, from pH 4.6 to 5.3, in agreement with results obtained for the other analyzed substrates.