No
1260
* ETLA – The Research Institute of the Finnish Economy, [email protected]
Heli Koski
*Does Marginal Cost Pricing
of Public Sector Information
Spur Firm Growth?
The author is grateful for TEKES, The Finnish Funding Agency for Technology and Innovation, for its financial support. The author wants to thank Mika Pajarinen for his constructive comments on the paper.
Contents
Abstract 2
1 Introduction 3
2 Pricing of PSI and firm growth 4
2.1 Demand for geographical information 4
2.2 GI pricing and growth 6
3 Econometric analysis 6 3.1 Econometric models 6 3.2 Data 8 3.3 Estimation results 11 4 Conclusions 13 References 15
The firm-level data concerning re-users of geographical information (GI) active in architectural and engi-neering activities and related technical consultancy sector from 15 countries during the year 2000–2007 suggests that the pricing of public sector GI strongly relates to the firms’ sales growth. Firms functioning in the countries in which public sector agencies provide fundamental geographical information either freely or at maximum marginal costs have grown, on average, about 15 percent more per annum than the firms in the countries in which public sector GI is priced according to the cost-recovery principle. The difference-in-difference estimations further show that positive growth impact materializes already one year after switching to the marginal cost pricing scheme but a stronger boost to the firm growth takes place with a two year lag. Interestingly, marginal cost pricing has not generated notable growth among the large firms; it has been SMEs benefiting most from cheaper geographical information. It seems cred-ible that switching to marginal cost pricing of public sector information (PSI) substantially lowers SMEs’ barriers to enter new market areas in the provision of GI-based products and services.
Key words: Public sector information, pricing, firm growth, technology policy
JEL: L25, L84, O38
Tiivistelmä
Maantieteellistä tietoa hyödyntäviin teknisen palvelun toimialan yrityksiin keskittyvä aineistoanalyysi vuosilta 2000–2007 osoittaa, että julkisen tiedon hinnoittelu vaikuttaa selvästi yritysten liikevaihdon kasvuun. Yritykset maissa, joissa julkinen maantieteellinen tieto on ollut ilmaista tai enintään rajakustan-nusten perusteella hinnoiteltua ovat kasvaneet vuositasolla keskimäärin 15 prosenttia enemmän kuin yritykset maissa, joissa julkisen maantieteellisen tiedon hinnoittelu on ollut kustannusperusteista. Raja-kustannushinnoitteluun siirtymisen jälkeen on havaittavissa positiivinen kasvuvaikutus jo seuraavana vuonna, mutta selvästi voimakkaampi kasvusysäys nähdään kahden vuoden päästä hinnoittelumuutok-sesta. Julkisen maantieteellisen tiedon rajakustannushinnoittelu ei ole kuitenkaan vaikuttanut merkittä-västi suurten yritysten kasvuun; PK-yritykset ovat hyötyneet eniten halvemmasta maantieteellisestä tiedosta.
1
Introduction
The fundamental importance of public sector information for the economy is acknowledged both in the academic and practical policy oriented documents1. Spatial information and
socio-economic data form the most valuable databases held by public sector agencies. According to the assessment of the European Commission (2004)2, spatial data, i.e., information that
com-bines geographical location with other data and spatial information are embedded in up to 80% of all the data held in public sector institutions. The major value and potential of spatial infor-mation lies, however, in the private sector that has increasingly become also its holder. Par-ticularly geographical information systems (GIS), navigation and location-based services (e.g. information on the local attractions and events) and geomarketing (e.g. real estate consulting) are among potential high-growth business services utilizing spatial information3.
It is argued that public sector policy lines, particularly those concerning the pricing of public sector information (PSI), still hinder the development and growth of private markets for in-formation services and products generated by the re-users of public sector inin-formation. Scarce government budgets have led to the implementation of partial or full cost-recovery pricing of PSI, and even profit maximizing behaviour and competition with private sector companies – typically agencies providing PSI receive part of their funding from the government budget and partly covered their costs via PSI sales – in various countries. Quite recently, since the incep-tion of the Directive 2003/98/EC of The European Parliament and of the Council that states “... the Member States should encourage public sector bodies to make documents available at charg-es that do not exceed the marginal costs for reproducing and disseminating the documents.” some countries such as the United Kingdom and Netherlands have adopted PSI pricing policies fol-lowing the marginal cost rule. In many countries, such as in Finland, pros and cons of the change towards marginal cost pricing of PSI are still disputed.
There are currently very few reported quantitative analysis on the economic impacts of pric-ing of PSI to advice decision makers. Newbery et al. (2008) provides an exception by analys-ing the welfare impacts of different pricanalys-ing policies of PSI provision by the six largest tradanalys-ing funds in the UK. Their data suggest that moving from cost-recovery pricing to marginal cost and/or zero pricing of basic data products is a preferable solution. This paper provides, to the best of my knowledge, the first reported systematic or econometric analysis using firm-level data concerning the economic consequences of the adoption of different PSI pricing policies. This paper contributes to the literature by using data from countries that have implemented different pricing schemes for public geographical information (GI); it empirically analyses the impacts of (maximum) marginal cost pricing on the re-user firms’ growth performance. The database comprises about 14 000 firms being active in architectural and engineering activi-ties and related technical consultancy sector (i.e. Standard Industrial Classification 7420) in
1 For instance, Pollock (2008) writes as follows: “... just as the supply of basic physical infrastructure – power, transport,
telecommunica-tions – is essential to the traditional economy, so the supply of basic information ‘infrastructure’ – core datasets in the major areas of geogra-phy, weather, transport etc – is essential to the ‘information’ economy”.
2 Commission of the European Communities (2004). Proposal for a decision of the European Parliament and of the Council estab-Commission of the European Communities (2004). Proposal for a decision of the European Parliament and of the Council estab-lishing a multiannual community programme to make digital content in Europe more accessible, usable and exploitable. Brussels 13.2.2004.
3 Prior studies assess that the most important categories of geographical information for re-users are topographic data, cadastral information (including address coordinates) and aerial photography (see. e.g., Fornefeld et al., 2009).
ing of GI has contributed to the firms’ sales growth, as opposed to the different cost-recovery pricing schemes.
Though this paper provides a novel contribution to the empirical analysis of the economic im-pacts of PSI, it links closely to a vast and well-established empirical literature exploring the determinants of firm growth (see Coad, 2007, for an excellent survey on the topic). The exist-ence of Gibrat’s Law – i.e. the independexist-ence of a firm’s growth rate on its size – has attained plenty of attention, with the preeminent conclusion that smaller firms tend to grow faster than the larger ones (see, e.g., Lotti et al., 2003; Stam, 2010). Also, the theory-based hypothesis of positive relationship between innovation and sales growth (see, e.g., Aghion and Howitt, 1992; Klette and Kortum, 2004) has inspired various empirical researchers but often the report-ed studies fail to confirm strong, or any, relationship between innovation and growth (Coad, 2007). Some recently published studies such as that of Corsino and Gabriele (2011) suggest that not only problems related to the measurement of innovation activities but also the level of observation at which empirical analysis is conducted may affect the estimated relationship be-tween innovation and sales growth, possibly hiding the truly positive innovation-growth link. There are also various studies focusing on the growth opportunities and the performance of firms. Different regulatory, legal and financial systems may generate differences in firms’ growth rates across countries (see, e.g., Beck et al, 2005; Bena and Jurajda, 2011). Also, as ad-dressed by Cassia et al. (2009), various characteristics of regional or country-specific innova-tion system may affect business growth. According to their empirical study, university-based knowledge production in certain regions is likely to create new ideas and economic opportu-nities and to further generate faster sales growth of firms. This study expands prior empirical analysis concerning firms’ growth opportunities to those arising from the utilization of pub-lic sector information.
The rest of the paper is organized as follows. Section 2 formulates the hypothesis to be tested in the empirical part of the study. Section 3.1 presents the econometric models, 3.2 introduc-es the data used in the empirical analysis and 3.2 reports and discussintroduc-es the introduc-estimation rintroduc-esults. Section 4 concludes.
2
Pricing of PSI and firm growth
2.1
Demand for geographical information
Various previous reports emphasize the importance of public sector information particularly for the industrial sectors using geographical information in their activities and further devel-oping and offering digital information products themselves (see, e.g., Fornefeld et al., 2009). The economic literature does not provide systematic empirical analysis on the elasticity of de-mand for public sector information but the reported examples suggest that change from cost-recovery based pricing of GI to marginal cost pricing increases dramatically the use of GI by firms. In this section, we highlight some country-level cases concerning provision of public sector GI at maximum marginal cost prices with the interest in the changes in demand for in-formation after switching to the new pricing regime.
ery pricing to the marginal cost pricing model for the geographical data offered by the public sector agencies. The prices of various key data sources of the Austrian National Mapping and Cadastral Agency such as digital cadastral maps reduced up to 97 percent, and were followed by substantial increases in orders and subscriptions of data (Schennach, 2008). For instance, demand for digital cadastral maps increased over 250 percent and for digital landscape mod-els over 1000 percent. An increase in the demand for data arose particularly from the small and medium sized firms, and also new user groups such as geomarketing and health services firms emerge as the users of geographical data (Fornefeld et al., 2008). Interestingly, the total turnover of the Austrian National Mapping and Cadastral Agency obtained from the data of which price was substantially reduced remained, due to the strong growth in demand, quite stable (Fornefeld et al., 2008).
In Spain, key geographical data is widely available free of charge via “Virtual Office of Cadas-tre”, OVC, established in March 2003 to provide different organizations better access and use of cadastral data and services. In June 2004, the access to geographical data in Spain was im-proved via the launch of an Internet portal IDEE offering free access to essential geographical data. The usage statistics available on the web page of OVC4 show a dramatic increase in the
use of geographical data. For instance, the number of cartography data consultations increased from the year 2004 to 2005 about 700 percent, from over million consultations to over 41 mil-lion consultations. In 2010, the corresponding number was over 124 milmil-lions indicating over 2300 percent growth in usage compared to that of 2004.
Australia is also among the advanced countries in the adoption of PSI pricing policies enabling free of charge use of various key public sector data sources. Australian focus in promoting ac-cess and re-use of PSI has largely focused on spatial data and publicly funded research da-ta and publications (Fitzgerald, 2010). In the autumn of 2001, Australian Government intro-duced Spatial Data Access and Pricing policy requiring relevant public sector agencies to offer their data free of charge online and at the marginal cost of transfer for packaged data products (i.e. data provided in CD format). The Office of Spatial Data Management in Australia imple-mented the new pricing policy by February 2002. Since the end of 2005, the Australia Bureau of Statistics has provided all publications, spreadsheets and Census data on its web pages free of charge. According to Australian Bureau of Statistics (2009), “it took about 5.5 years for page views to double from 30 million pages in mid 1999 to 60 million pages in end 2005, but only two years to double again to 120 million pages in end 2007”.
The public sector pricing policies of PSI may have not only drastic implications for the de-mand for PSI but also for the size of the markets utilizing PSI. Pettifer (2009) argues that the fundamental reason for the size difference between the US and European meteorological mar-kets are the different PSI pricing schemes adopted in the US and in Europe. He states that free-ly available data in the USA resulted in $1.4 billion market in 2006 in value-added meteoro-logical products of all types in the USA, while the corresponding market size in Europe with costly PSI was $372 million. The annual growth of meteorological markets in the US and Eu-rope were – measured since 2000 – 17 and 1.2 percent, respectively.
The reported examples suggest that the price elasticity of demand for public sector informa-tion is high: public sector agencies in various countries have witnessed a strong growth in demand for information they provide after switching from cost-based pricing of PSI to free or maximum marginal cost priced information (see also, e.g., Newbery et al., 2008; Pollock, 2008). Firms using public sector GI as a raw material for their products and/or services are likely to benefit most from the maximum marginal cost pricing practices. The availability of PSI at maximum marginal cost price is further likely to promote innovation among the re-us-ers of PSI and facilitate use of PSI for developing new products and services. Innovation is the key engine of firm growth and particularly product innovation is often regarded as the most important strategy for market expansion (see, e.g., Hay and Kamshad, 1994). Our first hypoth-esis is thus the following:
Hypothesis 1: Firms tend to grow more when PSI is available at maximum marginal cost than they do when PSI is priced using cost-recovery principle.
The switch towards marginal cost pricing of PSI may not only promote innovation and gen-erate generally more growth but it may also affect competition in the markets for information products and services. When public sector GI is offered using the cost-recovery pricing prin-ciples, firms may either buy GI from the public sector agency or, in some cases, collect it them-selves. High price of data or substantial collection costs may become a barrier to access to GI5
– this applies particularly for SMEs with more limited resources than large firms – and conse-quently a barrier to entry, particularly for SMEs’, to the new markets for GI products and serv-ices. Large firms may thus be in a relatively more favourable position when public sector au-thorities use full or partial cost recovery model, and benefit less from the switch to the mar-ginal cost pricing of GI than the SMEs. Our second hypothesis is thus:
Hypothesis 2:Particularly SMEs benefit from the marginal cost pricing of PSI and grow more than large firms when PSI is available at maximum marginal cost.
Next section introduces data and reports the results of the empirical analysis testing the two hypotheses.
3
Econometric analysis
3.1
Econometric models
We measure growth (i.e. the dependent variable) by a firm’s real sales growth between time t and t-1. This measure was chosen primarily as it is the most commonly used and generally ac-knowledged measure of entrepreneurial growth performance. We explore the impacts of max-imum marginal cost pricing of essential public sector GI of a country on firms’ sales growth by two models, the random effects model (RE) and the difference-in-differences (DID) model. The random effects model is chosen as it utilizes both cross-sectional and time-series
dimen-5 For instance, in 2009, National Land Survey of Finland charged up to 244 000 Euros for some of its digital products covering geo-graphical data from the entire country of Finland. (Source: www.finlex.fi/data/normit/31638-Hinnasto_liitteet_010509.pdf)
pricing and firm growth, while the difference-in-differences method detects the growth con-tribution of different pricing schemes after the change in the pricing regime has taken place. The RE method also enables the inclusion of observations to the analysis concerning firms coming from several countries that have adopted the marginal cost pricing at different times. Instead, the before-after policy change approach of the DID method restricts the analysis to the firms that have faced the change in the pricing scheme at the same time against those firms in which home countries the pricing of PSI has followed full or partial cost-recovery pricing principles during the all sample years of analysis.
First, we employ the following RE models:
, (MODEL 1)
where the variable MCPRICE gets value 1 if a firm i’s home country at time t provides essen-tial public sector GI at maximum marginal cost prices, and 0 otherwise. Vector C denotes j control variables used in the estimated equations. We further estimate Model 1 separately for the SMEs and large firms to investigate whether the growth dynamics are different for small and large firms.
The second econometric approach is the difference-in-differences method that has certain ad-vantages in evaluating the effects of policy changes on firms’ performance. The DID meth-od removes biases that could originate from the permanent differences between the firms in countries that employed new policy and in those that didn’t.6 Our data provide us with best
opportunity to evaluate the performance impacts of 2004 GI pricing policy change in Spain as our database comprises a sufficiently large population of Spanish firms (i.e. about 13 percent of all observations)and as we have sufficient data concerning firms’ growth both before (i.e. in 2003) and after (i.e. in 2005 and 2006) the policy change.7 The dependent variable of the
es-timations is the (log) level of turnover of a firm (variable TURNOVER). The equation that is estimated for two cross-sections, before- and after-subsidy year, can be written as follows (af-ter dropping the firm-specific i-indicators for simplicity):
, (MODEL 2) where coefficient a1 captures the difference in firms’ turnover level between the Spanish and other firms in 2003, i.e. before Spanish GI policy change. The time dummy T2 measures the time-related changes (due to certain aggregate factors) in the firms’ turnover that had taken place without the policy change. Coefficient a3 is the focus of interest here as it captures the ef-fect of policy change in Spain after policy implementation, at year T2.
6 However, there might be systematic differences in the firms’ growth across countries – e.g., due to the differences in macroeco-nomic conditions – affecting the growth of firms. We use the variable capturing the change in GDP of a country to control for these differences.
7 From Australia and Austria, which also witnessed GI pricing policy change, we have only tens of observations, and data from the US firms cannot be used for DID analysis as the United States have employed marginal cost pricing policy through all sample years. Firms, except the Spanish ones, from those countries that have already employed MC pricing policy are removed from the data for the DID analysis. 0 1 _ it it j it i it SALES GR MCPRICE C u j α α β ε = + +
∑
+ + 0 1 2 2 3 * 2 j jTURNOVER MCPRICE T MCPRICE T C u j
α α α α β
We use firm-level data from the architectural and engineering activities and related technical consultancy sector (SIC 74208) from 15 countries extracted from the Orbis database (see Table
1 for the list of sample countries). This sector is chosen for the empirical analysis as firms ac-tive in SIC 7420 sector are the major utilizers of geographical information and comprise sup-pliers of GI-based products and services (such as digital mapping, navigation and map data solutions). The used database consists of firm-level financial data from the years 2000–2007 but, for the number of missing observations, the data used for the estimations concentrate for the years 2003–2007.
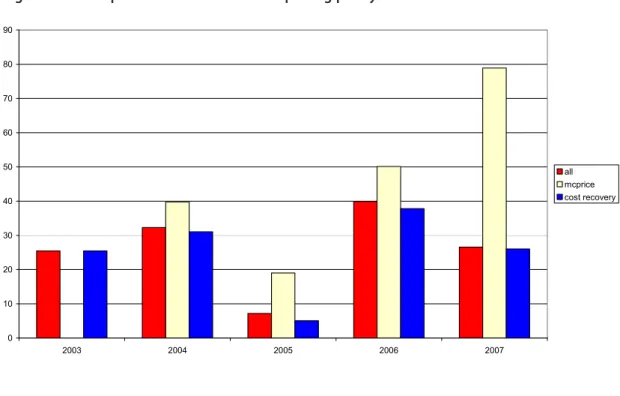
Figure 1 suggests that there has been an increasing trend in firms’ sales growth – despite a
more moderate growth in 2005 – in the architectural and engineering activities and
relat-ed technical consultancy sector during the sample years. The average annual growth rate has been higher among the firms located in countries in which public sector agencies provide GI at maximum marginal costs prices than when GI is priced according to the partial or full cost recovery principle.
The major explanatory variable in the estimated model is the variable MCPRICE that gets val-ue 1 if a firm’s home country has a national geoportal – i.e. a web site providing geographic or geospatial data, information and services – offering spatial data at no charge or at maximum marginal costs, and 0 otherwise. Typically, in most countries during sample years geographi-cal information has been available at prices based on a partial cost recovery (i.e. direct govern-
8 The SIC 7420 sector comprises architectural consulting activities (such as building design and drafting, supervision of construc-tion, town and city planning, and landscape architecture), various engineering and technical activities related to construcconstruc-tion, geologi-cal and prospecting activities, weather forecasting activities, and geodetic surveying.
17
Figure 1. Sample countries and their GI pricing policy 2000-2007
Sales growth (%) of sample firms in 2003-2007
0 10 20 30 40 50 60 70 80 90 2003 2004 2005 2006 2007 all mcprice cost recovery
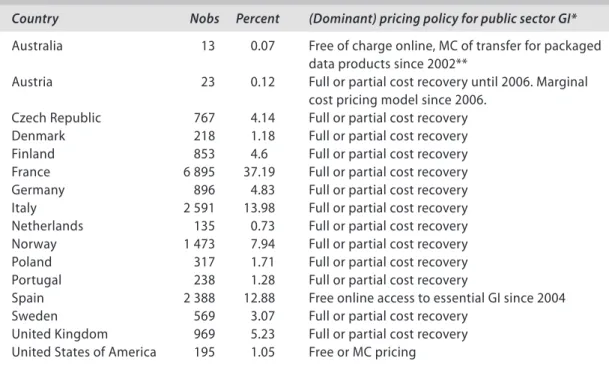
ment funding combined with sales revenue). Unfortunately, data do not allow us to evaluate to what extent PSI prices charged according to partial or full cost-recovery principles in different countries deviate from the marginal cost prices. Table 1 summarizes the sample countries and their geographical information pricing policies in 2000–2007.
Not only the price of public sector geographical information but also its availability and cov-erage is likely to affect its utilization among potential re-users. Variable NATIONAL_SDI gets value 1 if the approach and territorial coverage of the spatial data infrastructure (SDI) in a firm’s home country is truly national, and 0 otherwise. The SDI is defined to be ‘truly nation-al’ if “there is a clear initiative with a name, structure and organization responsible and/or leg-islation/strategy at the national level”. This variable is formed on the basis of INSPIRE & NSDI State of Play Summary Report (Spring 2010).
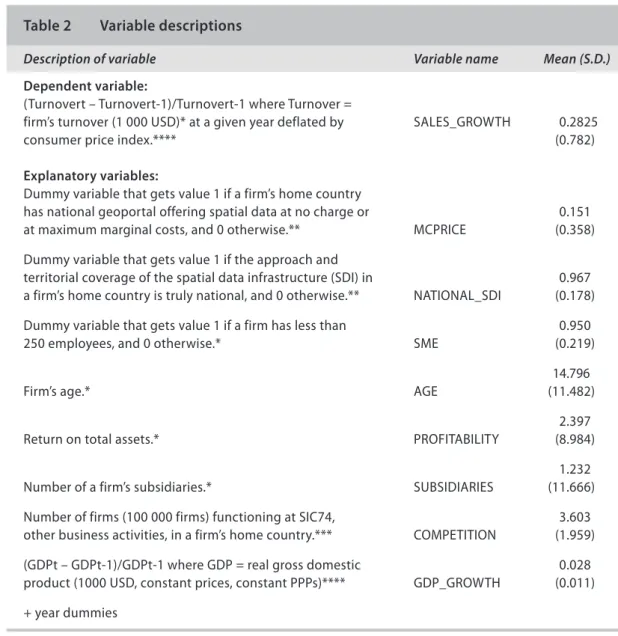
We also control for various other factors previous studies argue to possibly matter for a firm’s growth (see Table 2 for a list of variables and descriptive statistics measures). The economic literature suggests that both firm size and age may relate to its growth (see, e.g., Coad, 2007, for a detailed discussion). The dummy variable SME gets value 1 for those firms that have less than 250 employees, and 0 otherwise. This proxy for the small and medium-sized firms fol-lows the EU definition for SMEs. The variable AGE measures the number of years passed since the establishment of a firm. We further control for the financial performance of a firm by
vari-Note: nobs after firms RE model estimation.
* Information on the GI pricing policies of sample countries is gathered from the annual INSPIRE ‘Spatial Data Infrastructures: State of Play” reports from the years 2003–2010.
Source: http://inspire.jrc.ec.europa.eu/index.cfm/pageid/6/list/4.
** ADD details on Australian Government’s Spatial Data Access and Pricing Policy here.
Table 1 Sample countries and their GI pricing policy 2000–2007
Country Nobs Percent (Dominant) pricing policy for public sector GI*
Australia 13 0.07 Free of charge online, MC of transfer for packaged data products since 2002**
Austria 23 0.12 Full or partial cost recovery until 2006. Marginal cost pricing model since 2006.
Czech Republic 767 4.14 Full or partial cost recovery Denmark 218 1.18 Full or partial cost recovery Finland 853 4.6 Full or partial cost recovery France 6 895 37.19 Full or partial cost recovery Germany 896 4.83 Full or partial cost recovery Italy 2 591 13.98 Full or partial cost recovery Netherlands 135 0.73 Full or partial cost recovery Norway 1 473 7.94 Full or partial cost recovery Poland 317 1.71 Full or partial cost recovery Portugal 238 1.28 Full or partial cost recovery
Spain 2 388 12.88 Free online access to essential GI since 2004 Sweden 569 3.07 Full or partial cost recovery
United Kingdom 969 5.23 Full or partial cost recovery United States of America 195 1.05 Free or MC pricing
able PROFITABILITY measuring a firm’s return on its total assets, one of the commonly used measures of firm profitability. The economic literature builds a link between link between firm growth and profitability – ‘growth of the fitter’ – suggesting that only firms with superi-or financial perfsuperi-ormance are likely to gain additional market share (see, e.g., Dosi, et al. 2008). Also, the ownership structure and whether the firm is with or without subsidiaries may mat-ter for a firm’s growth: for instance Dunne et. al. (1989) find that large multi-unit plants tend to grow faster than large single-unit plants and that small plants owned by multi-plant firms grow faster in terms of their employment than those owned by singlbe-plant firms. The
vari-* Source: ORBIS database.
** Source: The annual INSPIRE ‘Spatial Data Infrastructures: State of Play” reports from the years 2003–2010, and INSPIRE & NSDI State of Play Summary Report (Spring 2010).
*** Source: OECD SDBS Structural Business Statistics. **** Source: OECD.Stat: National Accounts of OECD Countries.
Table 2 Variable descriptions
Description of variable Variable name Mean (S.D.)
Dependent variable:
(Turnovert – Turnovert-1)/Turnovert-1 where Turnover =
firm’s turnover (1 000 USD)* at a given year deflated by SALES_GROWTH 0.2825 consumer price index.**** (0.782)
Explanatory variables:
Dummy variable that gets value 1 if a firm’s home country
has national geoportal offering spatial data at no charge or 0.151 at maximum marginal costs, and 0 otherwise.** MCPRICE (0.358) Dummy variable that gets value 1 if the approach and
territorial coverage of the spatial data infrastructure (SDI) in 0.967 a firm’s home country is truly national, and 0 otherwise.** NATIONAL_SDI (0.178) Dummy variable that gets value 1 if a firm has less than 0.950 250 employees, and 0 otherwise.* SME (0.219) 14.796 Firm’s age.* AGE (11.482)
2.397 Return on total assets.* PROFITABILITY (8.984) 1.232 Number of a firm’s subsidiaries.* SUBSIDIARIES (11.666) Number of firms (100 000 firms) functioning at SIC74, 3.603 other business activities, in a firm’s home country.*** COMPETITION (1.959) (GDPt – GDPt-1)/GDPt-1 where GDP = real gross domestic 0.028 product (1000 USD, constant prices, constant PPPs)**** GDP_GROWTH (0.011) + year dummies
portunities may also depend on the intensity of competition. The number of firms functioning at the other business activities sector (i.e. SIC 74) in a firm’s home country at a given year, the variable COMPETITION, provides a proxy for cross-country differences in the order of mag-nitude of competition the firms face in their home country. The variable GDP_GROWTH, a percentage change in the Gross Domestic Product of a firm’s home country, captures the dif-ferences in the general economic trends or business cycles – possibly also generating cross-country differences in the growth of sample firms across countries – in the home cross-country of a firm.
3.3
Estimation results
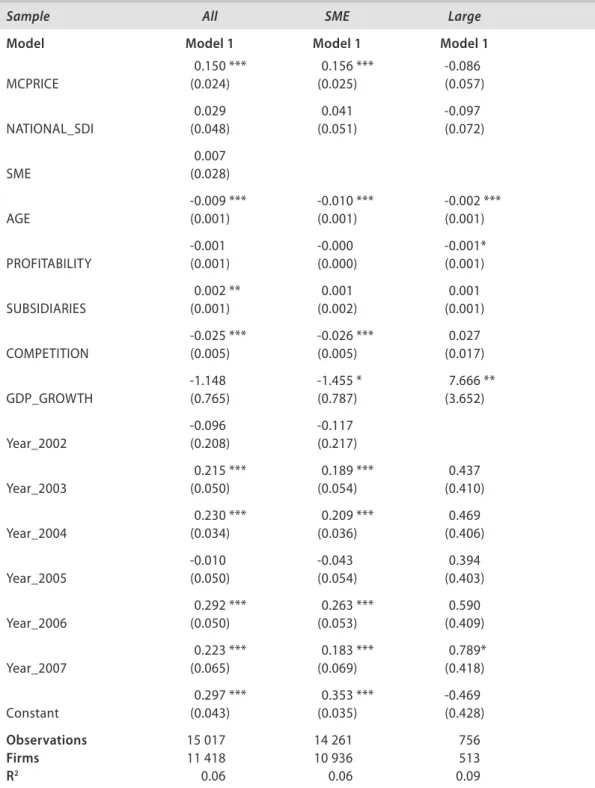
The estimation results of the random effects model indicate that the marginal cost pricing of geographical information is, indeed, positively related to the sales growth of firms active in ar-chitectural and engineering activities and related technical consultancy sector (see Table 3). Interestingly, the estimated coefficient of the variable MCPRICE is positive and statistically significant in the estimations for all sampled firms and for the sample of small and medium sized firms but not when estimated among the sample of large firms only. The estimated or-der of magnitude of the coefficients for MCPRICE suggest that firms located to countries with marginal cost pricing of public sector GI have annually grown, on average, about 15–16 per-cent more than those located to the countries using cost-recovery principles in the pricing of GI. These empirical finding indicate that the marginal cost pricing of GI has substantially con-tributed to the sales growth of SMEs, while it didn’t have a notable effect on the sales growth of large firms.
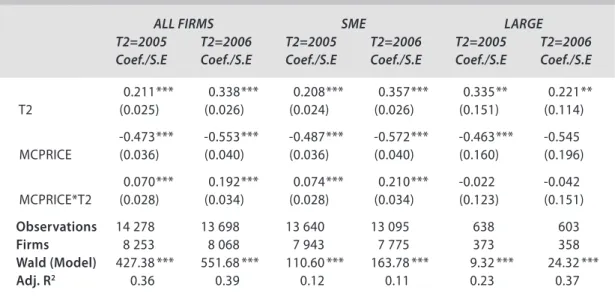
The estimation results of the difference-in-differences models further indicate that the change from the cost-recovery based principle to the (maximum) marginal cost pricing of geograph-ical information has facilitated firm growth. This applies both one and two years after the price scheme change – there are not enough observations to estimate the impacts of price scheme change three years after. The order of magnitude of estimated coefficients of the vari-able MCPRICE*T2 for the sample of all firms (SMEs) suggests that the annual growth of sales one and two years after switching to maximum marginal cost pricing was, respectively, 7 and 19 (7 and 21) percent higher than among SMEs in countries using full or partial cost recov-ery principles in the pricing of GI. Again, the estimated coefficient for the variable measuring the impact of marginal cost pricing of GI is not statistically significant when estimated among the large firms only. Altogether, these findings hint that SMEs benefit from the change to mar-ginal cost pricing of GI already one year after the change in the pricing scheme but a stronger growth impact follows with a two year lag.
The empirical findings concerning the control variables are quite like expected on the basis of prior studies. It seems that younger firms tend to grow more than the older ones, and that a larger network of subsidiaries increases firms’ growth. The growth dynamics of SMEs and large firms also seems to differ in that more competition hinders the average growth among all sample firms and among small firms but does not significantly affect the growth of large companies.
The robust firm cluster-specific standard errors are reported in the parentheses. Significance levels are reported on superscripts, where *** denotes significance level of 1%, ** significance level of 5% and * significance level of 10%.
Table 3 The estimation results of the random effects model for sales growth
Sample All SME Large
Model Model 1 Model 1 Model 1
0.150 *** 0.156 *** -0.086 MCPRICE (0.024) (0.025) (0.057) 0.029 0.041 -0.097 NATIONAL_SDI (0.048) (0.051) (0.072) 0.007 SME (0.028) -0.009 *** -0.010 *** -0.002 *** AGE (0.001) (0.001) (0.001) -0.001 -0.000 -0.001* PROFITABILITY (0.001) (0.000) (0.001) 0.002 ** 0.001 0.001 SUBSIDIARIES (0.001) (0.002) (0.001) -0.025 *** -0.026 *** 0.027 COMPETITION (0.005) (0.005) (0.017) -1.148 -1.455 * 7.666 ** GDP_GROWTH (0.765) (0.787) (3.652) -0.096 -0.117 Year_2002 (0.208) (0.217) 0.215 *** 0.189 *** 0.437 Year_2003 (0.050) (0.054) (0.410) 0.230 *** 0.209 *** 0.469 Year_2004 (0.034) (0.036) (0.406) -0.010 -0.043 0.394 Year_2005 (0.050) (0.054) (0.403) 0.292 *** 0.263 *** 0.590 Year_2006 (0.050) (0.053) (0.409) 0.223 *** 0.183 *** 0.789* Year_2007 (0.065) (0.069) (0.418) 0.297 *** 0.353 *** -0.469 Constant (0.043) (0.035) (0.428) Observations 15 017 14 261 756 Firms 11 418 10 936 513 R2 0.06 0.06 0.09
4
Conclusions
This study focusing on the relationship between the pricing of public sector information and firm performance provides one of the first systematic empirical explorations on the econom-ic impacts of PSI preconom-icing practeconom-ices. The reported empireconom-ical findings clearly show that the PSI pricing scheme does matter for the firm growth particularly from the perspective of small and medium sized enterprises. The firm-level data concerning potential re-users of geographical information in business services sector from 15 countries during the years 2000–2007 sug-gests that the pricing of GI strongly relates to the firms’ sales growth. Firms functioning in the countries in which public sector agencies provide fundamental geographical information ei-ther freely or at maximum marginal costs have grown, on average, 15 percent more per annum than the firms in the countries in which public sector GI is priced according to the cost-re-covery principles. The difference-in-difference estimations further show that positive growth impact materializes already one year after switching to the marginal cost pricing scheme but a stronger boost to the firm growth takes place with a two year lag.
Interestingly, marginal cost pricing has not generated notable growth among the large firms; it has been SMEs that have benefited most from cheaper geographical information. It seems credible that higher PSI prices create a barrier for SMEs using geographical information to de-velop new information products and services and to enter new market areas. The switch to the marginal cost pricing may thus not only result in growing markets but also intensify competi-tion and challenge the large incumbent companies. Cheaper public sector GI is thus likely to benefit consumers by producing more product variety and also cheaper prices.
Table 4 The estimation results of the difference-in-differences models for sales
Dependent variable: log (turnover)
ALL FIRMS SME LARGE
T2=2005 T2=2006 T2=2005 T2=2006 T2=2005 T2=2006 Coef./S.E Coef./S.E Coef./S.E Coef./S.E Coef./S.E Coef./S.E
0.211 *** 0.338 *** 0.208 *** 0.357 *** 0.335 ** 0.221 ** T2 (0.025) (0.026) (0.024) (0.026) (0.151) (0.114) -0.473 *** -0.553 *** -0.487 *** -0.572 *** -0.463 *** -0.545 MCPRICE (0.036) (0.040) (0.036) (0.040) (0.160) (0.196) 0.070 *** 0.192 *** 0.074 *** 0.210 *** -0.022 -0.042 MCPRICE*T2 (0.028) (0.034) (0.028) (0.034) (0.123) (0.151) Observations 14 278 13 698 13 640 13 095 638 603 Firms 8 253 8 068 7 943 7 775 373 358 Wald (Model) 427.38 *** 551.68 *** 110.60 *** 163.78 *** 9.32 *** 24.32 *** Adj. R2 0.36 0.39 0.12 0.11 0.23 0.37
* Control variables: Constant, NATIONAL_SDI, SME, AGE, SUBSIDIARIES, COMPETITION and GDP.
The robust firm cluster-specific standard errors are reported in the parentheses. Significance levels are reported on superscripts, where *** denotes significance level of 1%, ** significance level of 5% and * significance level of 10%.
public sector information, and with no doubt, the sample comprises also firms that are neither using PSI nor offering information products and services themselves. Due to this, the order of magnitude of estimated coefficient of MCPRICE variable rather tells the average growth con-tribution of marginal cost pricing of public sector GI among all firms active in architectural and engineering activities and related technical consultancy sector than the average growth contribution of the adoption of marginal cost pricing scheme among the PSI re-users in that sector. The estimated approximately 15 percent higher growth of firms in countries using mar-ginal cost pricing, as opposed to cost-recovery pricing principles, is thus a downward estimate of the firm-level growth impacts that a change from cost-based pricing to marginal cost pric-ing would likely result among PSI re-users. The empirical evaluation of this question is left for future work requiring more detailed firm-level information on the PSI reuse.
References
Aghion, P. and Howitt, P. (1992). A model of growth through creative destruction. Econometrica 60, 323–351.
Australian Bureau of Statistics (2009). Informing the nation – open access to statistical information in Australia. UNECE Work Session on the Communication and Dissemination of Statistics. WP11.
Beck, T., Demirgűc-Kunt, A. and Maksimovic, V. (2005). Financial and legal constraints to growth: Does firm size matter? Journal of Finance LX, 137–177.
Bena, J. and Jurajda, S. (2011). Financial development and corporate growth in the EU single market.
Economica 78, 401–428.
Cassia, L., Colombelli, A. and Paleari, S. (2009). Firms growth: Does the innovation system matter?
Structural Change and Economic Dynamics, 20, 211–220.
Coad, A. (2007). Firm growth: A survey. Papers on Economics and Evolution 2007-03, Max Planck Institute of Economics, Evolutionary Economics Group.
Corsino, M. and Gabriele, R. (2011). Product innovation and firm growth: Evidence from the integrated circuit industry. Industrial and Corporate Change 20, 29–56.
Dosi, G., Fagiolo, G. and Roventini, A. (2008). The microfoundations of business cycles: an evolutionary, multi-agent model. Journal of Evolutionary Economics 18, 413–432.
Dunne, T., Roberts, M. and Samuelson, L. (1989). The growth and failure of US Manufacturing plants.
Quarterly Journal of Economics 104, 671–698.
Fitzgerald, A.M. (2010). State of play: PSI re-use in Australia. European Public Sector Information Platform Topic Report No. 13.
Fornefeld, M. Boele-Keimer, G.Recher, S. and Fanning, M. (2009). Assessment of the re-use of public sec-tor information (PSI) in the geographical information, meteorological information and legal information services. Micus Management Consulting.
Hay, M., Kamshad, K. (1994). Small firm growth: Intentions, implementation and impediments. Business Strategy Review 5, 49–68.
Klette, T.J. and Kortum, S. (2004). Innovating firms and aggregate innovation. Journal of Political Economy
112, 986–1018.
Lotti, F., Santarelli, E. and Vivarelli, M. (2003). Does Gibrat’s Law hold among young, small firms? Journal of Evolutionary Economics 13, 213–235.
Newbery, D., L. Bently & R. Pollock (2008). Models of Public Sector Information Provision via Trading Funds. Mimeo. February 26, 2008.
Pettifer, R.E.W. (2009). PSI in European meteorology – An unfilled potential. Mimeo. 25.4.2009. Pollock, R. (2008). The economics of public sector information. University of Cambridge. Mimeo. December 2, 2008.
Schennach, G. (2008). Reducing charges for national geographic reference data in Austria. Slides presented June 13, 2008 in ePSIplus Conference, Brussels. www.epsiplatform.com/content/down-load/13941/174368/.../Schennach.pdf
Stam, E. (2010). Growth beyond Gibrat: firm growth processes and strategies. Small Business Economics
ETLA
Elinkeinoelämän Tutkimuslaitos
The Research Institute of the Finnish Economy Lönnrotinkatu 4 B 00120 Helsinki ISSN 0781–6847 Puh. 09-609 900 Fax 09-601 753 www.etla.fi [email protected]
No 1245 Kari E.O. Alho, Should Sweden Join the EMU? An Analysis of General Equilibrium Effects through Trade. 06.04.2011. 16 p.
No 1246 Heli Koski – Mika Pajarinen, The Role of Business Subsidies in Job Creation of Start-ups, Gazelles and Incumbents. 07.04.2011. 21 p.
No 1247 Antti Kauhanen, The Perils of Altering Incentive Plans. A Case Study. 08.04.2011. 22 p.
No 1248 Rita Asplund – Sami Napari, Intangible Capital and Wages. An Analysis of Wage Gaps Across Occupations and Genders in Czech Republic, Finland and Norway. 11.04.2011. 18 p.
No 1249 Mari Kangasniemi – Antti Kauhanen, Performance-related Pay and Gender Wage Differences. 21.04.2011. 19 p.
No 1250 Ye Zhang, Wireless Acquisition of Process Data. 24.05.2011. 52 p.
No 1251 Rita Asplund – Erling Barth – Per Lundborg – Kjersti Misje Nilsen, Challenges of Nordic Labour Markets: A Polarization of Working Life? 08.06.2011. 21 p.
No 1252 Jari Hyvärinen, Innovaatiotoiminta: Näkemyksiä ympäristö- ja energia-alaan. 1.6.2011. 39 s. No 1253 Ari Hyytinen – Mika Maliranta, Firm Lifecycles and External Restructuring. 17.06.2011. 34 p. No 1254 Timo Seppälä – Olli Martikainen, Europe Lagging Behind in ICT Evolution: Patenting Trends of
Leading ICT Companies. 22.06.2011. 18 p.
No 1255 Paavo Suni – Pekka Ylä-Anttila, Kilpailukyky ja globaalin toimintaympäristön muutos. Suomen koneteollisuus maailmantaloudessa. 19.08.2011. 39 s.
No 1256 Jari Hyvärinen, Innovaatiotoiminta: Näkemyksiä hyvinvointialaan ja työelämän kehittämiseen. 31.8.2011. 28 s.
No 1257 Terttu Luukkonen – Matthias Deschryvere – Fabio Bertoni – Tuomo Nikulainen, Importance of the Non-financial Value Added of Government and Independent Venture Capitalists. 2.9.2011. 28 p. No 1258 Ari Hyytinen – Mika Pajarinen – Pekka Ylä-Anttila, Finpron vaikuttavuus – Finpron palveluiden käytön
vaikutukset yritysten kansainvälistymiseen ja menestymiseen. 15.9.2011. 32 p. No 1259 Kari E.O. Alho, How to Restore Sustainability of the Euro? 19.9.2011. 27 p.
Elinkeinoelämän Tutkimuslaitoksen julkaisemat ”Keskusteluaiheita” ovat raportteja alustavista tutkimustuloksista ja väliraportteja tekeillä olevista tutkimuksista. Tässä sarjassa julkaistuja monisteita on mahdollista ostaa Talous-tieto Oy:stä kopiointi- ja toimituskuluja vastaavaan hintaan.
Papers in this series are reports on preliminary research results and on studies in progress. They are sold by Taloustieto Oy for a nominal fee covering copying and postage costs.
Julkaisut ovat ladattavissa pdf-muodossa osoitteessa: www.etla.fi/julkaisuhaku.php