SSH connection to a trusted location near (or even on) a remote server, in-secure protocols can be protected from eavesdropping and attack.
While this technique may be a bit advanced for many users, network archi-tects can use SSH to encrypt traffic across untrusted links, such as wireless point-to-point links. Since the tools are freely available and run over stan-dard TCP, any educated user can implement SSH connections for them-selves, providing their own end-to-end encryption without administrator inter-vention.
OpenSSH (http://openssh.org/) is probably the most popular implementation on Unix-like platforms. Free implementations such as Putty (http://www.putty.nl/) and WinSCP (http://winscp.net/) are available for Windows. OpenSSH will also run on Windows under the Cygwin package (http://www.cygwin.com/). These examples will assume that you are using a recent version of OpenSSH.
Internet
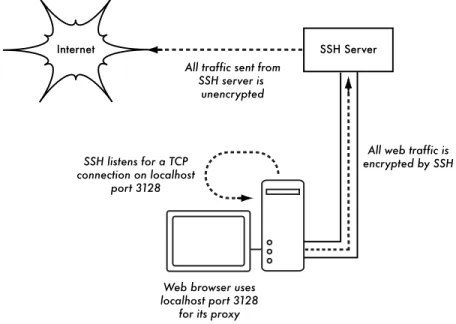
All traffic sent from SSH server is unencrypted SSH Server SSH listens for a TCP connection on localhost port 3128
Web browser uses localhost port 3128
for its proxy
All web traffic is encrypted by SSH
Figure 6.6: The SSH tunnel protects web traffic up to the SSH server itself. To establish an encrypted tunnel from a port on the local machine to a port on the remote side, use the -L switch. For example, suppose you want to forward web proxy traffic over an encrypted link to the squid server at
squid.example.net. Forward port 3128 (the default proxy port) using this command:
The -fN switches instruct ssh to fork into the background after connecting. The -g switch allows other users on your local segment to connect to the lo-cal machine and use it for encryption over the untrusted link. OpenSSH will use a public key for authentication if you have set one up, or it will prompt you for your password on the remote side. You can then configure your web browser to connect to localhost port 3128 as its web proxy service. All web traffic will then be encrypted before transmission to the remote side.
SSH can also act as a dynamic SOCKS4 or SOCKS5 proxy. This allows you to create an encrypting web proxy, without the need to set up squid. Note that this is not a caching proxy; it simply encrypts all traffic.
ssh -fN -D 8080 remote.example.net
Configure your web browser to use SOCKS4 or SOCKS5 on local port 8080, and away you go.
SSH can encrypt data on any TCP port, including ports used for email. It can even compress the data along the way, which can decrease latency on low capacity links.
ssh -fNCg -L110:localhost:110 -L25:localhost:25 mailhost.example.net
The -C switch turns on compression. You can add as many port forwarding rules as you like by specifying the -L switch multiple times. Note that in order to bind to a local port less than 1024, you must have root privileges on the local machine.
These are just a few examples of the flexibility of SSH. By implementing public keys and using the ssh forwarding agent, you can automate the crea-tion of encrypted tunnels throughout your wireless network, and protect your communications with strong encryption and authentication.
OpenVPN
OpenVPN is a free, open source VPN implementation built on SSL encryp-tion. There are OpenVPN client implementations for a wide range of operat-ing systems, includoperat-ing Linux, Windows 2000/XP and higher, OpenBSD, FreeBSD, NetBSD, Mac OS X, and Solaris. Being a VPN, it encapsulates all traffic (including DNS and all other protocols) in an encrypted tunnel, not just a single TCP port. Most people find it considerably easier to understand and configure than IPSEC.
OpenVPN also has some disadvantages, such as fairly high latency. Some amount of latency is unavoidable since all encryption/decryption is done in user space, but using relatively new computers on either end of the tunnel can minimize this. While it can use traditional shared keys, OpenVPN
really shines when used with SSL certificates and a certificate authority. OpenVPN has many advantages that make it a good option for providing end-to-end security.
Some of these reasons include:
• It is based on a proven, robust encryption protocol (SSL and RSA) • It is relatively easy to configure
• It functions across many different platforms • It is well documented
• It's free and open source.
OpenVPN needs to connect to a single TCP or UDP port on the remote side. Once established, it can encapsulate all data down to the Networking layer, or even down to the Data-Link layer, if your solution requires it. You can use it to create robust VPN connections between individual machines, or simply use it to connect network routers over untrusted wireless networks.
VPN technology is a complex field, and is a bit beyond the scope of this section to go into more detail. It is important to understand how VPNs fit into the structure of your network in order to provide the best possible pro-tection without opening up your organization to unintentional problems. There are many good online resources that deal with installing OpenVPN on a server and client, we recommend this article from Linux Journal:
http://www.linuxjournal.com/article/7949 as well as the official HOWTO:
http://openvpn.net/howto.html
Tor & Anonymizers
The Internet is basically an open network based on trust. When you connect to a web server across the Internet, your traffic passes through many differ-ent routers, owned by a great variety of institutions, corporations and indi-viduals. In principle, any one of these routers has the ability to look closely at your data, seeing the source and destination addresses, and quite often also the actual content of the data. Even if your data is encrypted using a secure protocol, it is possible for your Internet provider to monitor the amount of data transferred, as well as the source and destination of that data. Often this is enough to piece together a fairly complete picture of your activities on-line. Privacy and anonymity are important, and closely linked to each other. There are many valid reasons to consider protecting your privacy by anonymizing your network traffic. Suppose you want to offer Internet connectivity to your local community by setting up a number of access points for people to con-nect to. Whether you charge them for their access or not, there is always the
risk that people use the network for something that is not legal in your coun-try or region. You could plead with the legal system that this particular illegal action was not performed by yourself, but could have been performed by anyone connecting to your network. The problem is neatly sidestepped if it were technically infeasible to determine where your traffic was actually headed. And what about on-line censorship? Publishing web pages anony-mously may also be necessary to avoid government censorship.
There are tools that allow you to anonymize your traffic in relatively easy ways. The combination of Tor (http://www.torproject.org/) and Privoxy (http://www.privoxy.org/) is a powerful way to run a local proxy server that will pass your Internet traffic through a number of servers all across the net, making it very difficult to follow the trail of information. Tor can be run on a local PC, under Microsoft Windows, Mac OSX, Linux and a variety of BSD's, where it anonymizes traffic from the browser on that particular machine. Tor and Privoxy can also be installed on a gateway server, or even a small em-bedded access point (such as a Linksys WRT54G) where they provides ano-nymity to all network users automatically.
Tor works by repeatedly bouncing your TCP connections across a number of servers spread throughout the Internet, and by wrapping routing information in a number of encrypted layers (hence the term onion routing), that get peeled off as the packet moves across the network. This means that, at any given point in the network, the source and destination addresses cannot be linked together. This makes traffic analysis extremely difficult.
The need for the Privoxy privacy proxy in connection with Tor is due to the fact that name server queries (DNS queries) in most cases are not passed through the proxy server, and someone analyzing your traffic would easily be able to see that you were trying to reach a specific site (say google.com) by the fact that you sent a DNS query to translate google.com to the appropriate IP address. Privoxy connects to Tor as a SOCKS4a proxy, which uses host-names (not IP addresses) to get your packets to the intended destination. In other words, using Privoxy with Tor is a simple and effective way to pre-vent traffic analysis from linking your IP address with the services you use online. Combined with secure, encrypted protocols (such as those we have seen in this chapter), Tor and Privoxy provide a high level of anonymity on the Internet.
Network Monitoring
Network monitoring is the use of logging and analysis tools to accurately de-termine traffic flows, utilization, and other performance indicators on a net-work. Good monitoring tools give you both hard numbers and graphical
ag-gregate representations of the state of the network. This helps you to visu-alize precisely what is happening, so you know where adjustments may be needed. These tools can help you answer critical questions, such as:
• What are the most popular services used on the network? • Who are the heaviest network users?
• What other wireless channels are in use in my area?
• Are users installing wireless access points on my private wired network? • At what time of the day is the network most utilized?
• What sites do your users frequent?
• Is the amount of inbound or outbound traffic close to our available network capacity?
• Are there indications of an unusual network situation that is consuming bandwidth or causing other problems?
• Is our Internet Service Provider (ISP) providing the level of service that we are paying for? This should be answered in terms of available bandwidth, packet loss, latency, and overall availability.
And perhaps the most important question of all: • Do the observed traffic patterns fit our expectations?
Let's look at how a typical system administrator can make good use of net-work monitoring tools.
An effective network monitoring example
For the purposes of example, let's assume that we are in charge of a network that has been running for three months. It consists of 50 computers and three servers: email, web, and proxy servers. While initially things are going well, users begin to complain of slow network speeds and an increase in spam emails. As time goes on, computer performance slows to a crawl (even when not using the network), causing considerable frustration in your users. With frequent complaints and very low computer usage, the Board is ques-tioning the need for so much network hardware. The Board also wants evi-dence that the bandwidth they are paying for is actually being used. As the network administrator, you are on the receiving end of these complaints. How can you diagnose the sudden drop in network and computer performance and also justify the network hardware and bandwidth costs?
Monitoring the LAN (local traffic)
To get an idea of exactly what is causing the slow down, you should begin by looking at traffic on the local LAN. There are several advantages to monitor-ing local traffic:
• Troubleshooting is greatly simplified. • Viruses can be detected and eliminated. • Malicious users can be detected and dealt with.
• Network hardware and resources can be justified with real statistics.
Assume that all of the switches support the Simple Network Management Protocol (SNMP). SNMP is an application-layer protocol designed to facili-tate the exchange of management information between network devices. By assigning an IP address to each switch, you are able to monitor all the inter-faces on that switch, observing the entire network from a single point. This is much easier than enabling SNMP on all computers in a network.
By using a free tool such as MRTG (see Page 190), you can monitor each port on the switch and present data graphically, as an aggregate average over time. The graphs are accessible from the web, so you are able to view the graphs from any machine at anytime.
With MRTG monitoring in place, it becomes obvious that the internal LAN is swamped with far more traffic than the Internet connection can support, even when the lab is unoccupied. This is a pretty clear indication that some of the computers are infested with a network virus. After installing good anti-virus and anti-spyware software on all of the machines, the internal LAN traffic settles down to expected levels. The machines run much more quickly, spam emails are reduced, and the users' morale quickly improves.
Monitoring the WAN (external traffic)
In addition to watching the traffic on the internal LAN, you need to demon-strate that the bandwidth the organization is paying for is actually what they are getting from their ISP. You can achieve this by monitoring external
traf-fic.
External traffic is generally classified as anything sent over a Wide Area Network (WAN). Anything received from (or sent to) a network other than your internal LAN also qualifies as external traffic. The advantages of moni-toring external traffic include:
• Internet bandwidth costs are justified by showing actual usage, and whether that usage agrees with your ISP's bandwidth charges.
• Future capacity needs are estimated by watching usage trends and pre-dicting likely growth patterns.
• Intruders from the Internet are detected and filtered before they can cause problems.
Monitoring this traffic is easily done with the use of MRTG on an SNMP en-abled device, such as a router. If your router does not support SNMP, then you can add a switch between your router and your ISP connection, and monitor the port traffic just as you would with an internal LAN.
Detecting Network Outages
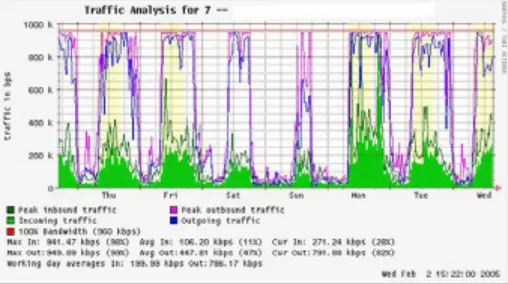
With monitoring tools in place, you now have an accurate measurement of how much bandwidth the organization is using. This measurement should agree with your ISP's bandwidth charges. It can also indicate the actual throughput of your connection if you are using close to your available capac-ity at peak times. A "flat top" graph is a fairly clear indication that you are operating at full capacity. Figure 6.7 shows flat tops in peak outbound traffic in the middle of every day except Sunday.
It is clear that your current Internet connection is overutilized at peak times, causing network lag. After presenting this information to the Board, you can make a plan for further optimizing your existing connection (by upgrading your proxy server and using other techniques in this book) and estimate how soon you will need to upgrade your connection to keep up with the demand. This is also an excellent time to review your operational policy with the Board, and discuss ways to bring actual usage in line with that policy.
Later in the week, you receive an emergency phone call in the evening. Apparently, no one in the lab can browse the web or send email. You rush to the lab and hastily reboot the proxy server, with no results. Browsing and email are still broken. You then reboot the router, but there is still no success. You continue eliminating the possible fault areas one by one until you realize that the network switch is off - a loose power cable is to blame. After applying power, the network comes to life again.
How can you troubleshoot such an outage without such time consuming trial and error? Is it possible to be notified of outages as they occur, rather than waiting for a user to complain? One way to do this is to use a program such as Nagios that continually polls network devices and notifies you of outages. Nagios will report on the availability of various machines and services, and will alert you to machines that have gone down. In addition to displaying the network status graphically on a web page, it will send notifications via SMS or email, alerting you immediately when problems arise.
With good monitoring tools in place, you will be able to justify the cost of equipment and bandwidth by effectively demonstrating how it is being used by the organization. You are notified automatically when problems arise, and you have historical statistics of how the network devices are performing. You can check the current performance against this history to find unusual behav-ior, and head off problems before they become critical. When problems do come up, it is simple to determine the source and nature of the problem. Your job is easier, the Board is satisfied, and your users are much happier.
Monitoring your network
Managing a network without monitoring is similar to driving a vehicle without a speedometer or a fuel gauge, with your eyes closed. How do you know how fast you are going? Is the car consuming fuel as efficiently as promised by the dealers? If you do an engine overhaul several months later, is the car any faster or more efficient than it was before?
Similarly, how can you pay for an electricity or water bill without seeing your monthly usage from a meter? You must have an account of your network bandwidth utilization in order to justify the cost of services and hardware pur-chases, and to account for usage trends.
There are several benefits to implementing a good monitoring system for your network:
1. Network budget and resources are justified. Good monitoring tools can demonstrate without a doubt that the network infrastructure (band-width, hardware, and software) is suitable and able to handle the re-quirements of network users.
2. Network intruders are detected and filtered. By watching your net-work traffic, you can detect attackers and prevent access to critical inter-nal servers and services.
3. Network viruses are easily detected. You can be alerted to the pres-ence of network viruses, and take appropriate action before they con-sume Internet bandwidth and destabilize your network
4. Troubleshooting of network problems is greatly simplified. Rather than attempting "trial and error" to debug network problems, you can be instantly notified of specific problems. Some kinds of problems can even be repaired automatically.
5. Network performance can be highly optimized. Without effective monitoring, it is impossible to fine tune your devices and protocols to achieve the best possible performance.
6. Capacity planning is much easier. With solid historical performance records, you do not have to "guess" how much bandwidth you will need as your network grows.
7. Proper network usage can be enforced. When bandwidth is a scarce resource, the only way to be fair to all users is to ensure that the network is being used for its intended purpose.
Fortunately, network monitoring does not need to be an expensive undertak-ing. There are many freely available open source tools that will show you exactly what is happening on your network in considerable detail. This sec-tion will help you identify many invaluable tools and how best to use them.
The dedicated monitoring server
While monitoring services can be added to an existing network server, it is of-ten desirable to dedicate one machine (or more, if necessary) to network moni-toring. Some applications (such as ntop) require considerable resources to run, particularly on a busy network. But most logging and monitoring programs have modest RAM and storage requirements, typically with little CPU power required. Since open source operating systems (such as Linux or BSD) make very efficient use of hardware resources, this makes it possible to build a very capable monitoring server from recycled PC parts. There is usually no need to purchase a brand new server to relegate to monitoring duties.
The exception to this rule is in very large installations. If your network in-cludes more than a few hundred nodes, or if you consume more than 50Mbps of Internet bandwidth, you will likely need to split up monitoring du-ties between a few dedicated machines. This depends largely on exactly what you want to monitor. If you are attempting to account for all services accessed per MAC address, this will consume considerably more resources
than simply measuring network flows on a switch port. But for the majority of installations, a single dedicated monitoring machine is usually enough.
While consolidating monitoring services to a single machine will streamline administration and upgrades, it can also ensure better ongoing monitoring. For example, if you install monitoring services on a web server, and that web server develops problems, then your network may not be monitored until the problem is resolved.
To a network administrator, the data collected about network performance is nearly as important as the network itself. Your monitoring should be robust and protected from service outages as well as possible. Without network statistics, you are effectively blind to problems with the network.
Where does the server fit in my network?
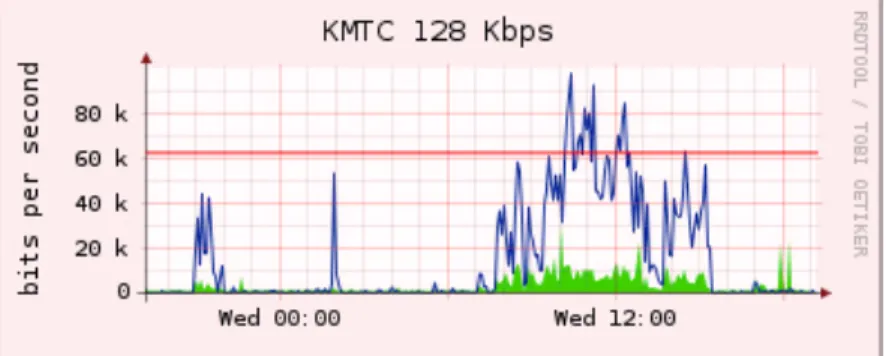
If you are only interested in collecting network flow statistics from a router, you can do this from just about anywhere on the LAN. This provides simple feedback about utilization, but cannot give you comprehensive details about usage patterns. Figure 6.8 shows a typical MRTG graph generated from the Internet router. While the inbound and outbound utilization are clear, there is no detail about which computers, users, or protocols are us-ing bandwidth.
Figure 6.8: Polling the edge router can show you the overall network utilization, but you cannot break the data down further into machines, services, and users. For more detail, the dedicated monitoring server must have access to eve-rything that needs to be watched. Typically, this means it must have ac-cess to the entire network. To monitor a WAN connection, such as the Internet link to your ISP, the monitoring server must be able to see the traf-fic passing through the edge router. To monitor a LAN, the monitoring server is typically connected to a monitor port on the switch. If multiple switches are used in an installation, the monitoring server may need a con-nection to all of them. That concon-nection can either be a physical cable, or if
your network switches support it, a VLAN specifically configured for moni-toring traffic.
Switch Monitor port
Internet
Network monitor
Figure 6.9: Use the monitor port on your switch to observe traffic crossing all of the network ports.
If monitor port functionality is not available on your switch, the monitoring server may be installed between your internal LAN and the Internet. While this will work, it introduces a single point of failure for the network, as the network will fail if the monitoring server develops a problem. It is also a po-tential performance bottleneck, if the server cannot keep up with the de-mands of the network.
Network monitor Internet
Figure 6.10: By inserting a network monitor between the LAN and your Internet con-nection, you can observe all network traffic.
A better solution is to use a simple network hub (not a switch) which con-nects the monitoring machine to the internal LAN, external router, and the monitoring machine. While this does still introduce an additional point of fail-ure to the network (since the entire network will be unreachable if the hub dies), hubs are generally considered to be much more reliable than routers. They are also very easily replaced should they fail.
Hub Internet
Network monitor
Figure 6.11: If your switch does not provide monitor port functionality, you can insert a network hub between your Internet router and the LAN, and connect the monitoring
server to the hub.
Once your monitoring server is in place, you are ready to start collecting data.
What to monitor
It is possible to plot just about any network event and watch its value on a graph over time. Since every network is slightly different, you will have to decide what information is important in order to gauge the performance of your network.
Here are some important indicators that many network administrators will typically track.
Wireless statistics
• Received signal and noise from all backbone nodes • Number of associated stations
• Detected adjacent networks and channels • Excessive retransmissions
• Radio data rate, if using automatic rate scaling
Switch statistics
• Bandwidth usage per switch port
• Bandwidth usage broken down by protocol • Bandwidth usage broken down by MAC address • Broadcasts as a percentage of total packets • Packet loss and error rate
Internet statistics
• Internet bandwidth use by host and protocol • Proxy server cache hits
• Top 100 sites accessed • DNS requests
• Number of inbound emails / spam emails / email bounces • Outbound email queue size
• Availability of critical services (web servers, email servers, etc.). • Ping times and packet loss rates to your ISP
• Status of backups
System health statistics
• Memory usage • Swap file usage
• Process count / zombie processes • System load
• Uninterruptible Power Supply (UPS) voltage and load • Temperature, fan speed, and system voltages • Disk SMART status
• RAID array status
You should use this list as a suggestion of where to begin. As your network matures, you will likely find new key indicators of network performance, and you should of course track those as well. There are many freely available
tools that will show you as much detail as you like about what is happening on your network. You should consider monitoring the availability of any re-source where unavailability would adversely affect your network users.
For example, your users may dial into modems on your site to gain remote access to your network. If all the modems are used, or if any are faulty, then users will be denied access and will probably complain. You can predict and avoid such problems by monitoring the number of available modems, and provisioning extra capacity before you run out.
Don't forget to monitor the monitoring machine itself, for example its CPU usage and disk space, in order to receive advance warning if it becomes overloaded or faulty. A monitoring machine that is low on resources can af-fect your ability to monitor the network efaf-fectively.
Types of monitoring tools
We will now look at several different classes of monitoring tools. Network detection tools listen for the beacons sent by wireless access points, and display information such as the network name, received signal strength, and channel. Spot check tools are designed for troubleshooting and normally run interactively for short periods of time. A program such as ping may be con-sidered an active spot checktool, since it generates traffic by polling a par-ticular machine. Passive spot check tools include protocol analyzers, which inspect every packet on the network and provide complete detail about any network conversation (including source and destination addresses, protocol information, and even application data). Trending tools perform unattended monitoring over long periods, and typically plot the results on a graph. Real-time monitoring tools perform similar monitoring, but notify administrators immediately if they detect a problem. Throughput testing tools tell you the actual bandwidth available between two points on a network. Intrusion de-tection tools watch for undesirable or unexpected network traffic, and take appropriate action (typically denying access and/or notifying a network ad-ministrator). Finally, benchmarking tools estimate the maximum perform-ance of a service or network connection.
Network detection
The simplest wireless monitoring tools simply provide a list of available net-works, along with basic information (such as signal strength and channel). They let you quickly detect nearby networks and determine if they are in range or are causing interference.
• The built-in client. All modern operating systems provide built-in support for wireless networking. This typically includes the ability to scan for avail-able networks, allowing the user to choose a network from a list. While
virtually all wireless devices are guaranteed to have a simple scanning util-ity, functionality can vary widely between implementations. These tools are typically only useful for configuring a computer in a home or office setting. They tend to provide little information apart from network names and the available signal to the access point currently in use.
• Netstumbler (http://www.netstumbler.com/). This is the most popular tool for detecting wireless networks using Microsoft Windows. It supports a variety of wireless cards, and is very easy to use. It will detect open and encrypted networks, but cannot detect “closed” wireless networks. It also features a signal/noise meter that plots radio receiver data as a graph over time. It also integrates with a variety of GPS devices, for logging precise location and signal strength information. This makes Netstumbler a handy tool to have for an informal site survey.
• Ministumbler (http://www.netstumbler.com/). From the makers of Netstumbler, Ministumbler provides much of the same functionality as the Windows version, but works on the Pocket PC platform. Ministumbler is handy to run on a handheld PDA with a wireless card for detecting access points in the field.
• Macstumbler (http://www.macstumbler.com/). While not directly related to the Netstumbler, Macstumbler provides much of the same functionality but for the Mac OS X platform. It works with all Apple Airport cards.
• Wellenreiter (http://www.wellenreiter.net/). Wellenreiter is a nice graphi-cal wireless network detector for Linux. It requires Perl and GTK, and sup-ports Prism2, Lucent, and Cisco wireless cards.
Spot check tools
What do you do when the network breaks? If you cant access a web page or email server, and clicking the reload button doesnt fix the problem, then youll need to be able to isolate the exact location of the problem. These tools will help you to determine just where a connection problem exists. This section is simply an introduction to commonly used troubleshooting tools. For more discussion of common network problems and how to diag-nose them, see Chapter 9, Troubleshooting.
ping
Just about every operating system (including Windows, Mac OS X, and of course Linux and BSD) includes a version of the ping utility. It uses ICMP packets to attempt to contact a specified host, and tells you how long it takes to get a response.
Knowing what to ping is just as important as knowing how to ping. If you find that you cannot connect to a particular service in your web browser (say,
http://yahoo.com/), you could try to ping it:
$ ping yahoo.com
PING yahoo.com (66.94.234.13): 56 data bytes
64 bytes from 66.94.234.13: icmp_seq=0 ttl=57 time=29.375 ms 64 bytes from 66.94.234.13: icmp_seq=1 ttl=56 time=35.467 ms 64 bytes from 66.94.234.13: icmp_seq=2 ttl=56 time=34.158 ms ^C
yahoo.com ping statistics
---3 packets transmitted, ---3 packets received, 0% packet loss round-trip min/avg/max/stddev = 29.375/33.000/35.467/2.618 ms
Hit control-C when you are finished collecting data. If packets take a long time to come back, there may be network congestion. If return ping packets have an unusually low Time To Live (TTL), you may have routing problems between your machine and the remote end. But what if the ping doesnt re-turn any data at all? If you are pinging a name instead of an IP address, you may be running into DNS problems.
Try pinging an IP address on the Internet. If you cant reach it, its a good idea to see if you can ping your default router:
$ ping 69.90.235.230
PING 69.90.235.230 (69.90.235.230): 56 data bytes
64 bytes from 69.90.235.230: icmp_seq=0 ttl=126 time=12.991 ms 64 bytes from 69.90.235.230: icmp_seq=1 ttl=126 time=14.869 ms 64 bytes from 69.90.235.230: icmp_seq=2 ttl=126 time=13.897 ms ^C
216.231.38.1 ping statistics
---3 packets transmitted, ---3 packets received, 0% packet loss round-trip min/avg/max/stddev = 12.991/13.919/14.869/0.767 ms
If you cant ping your default router, then chances are you wont be able to get to the Internet either. If you cant even ping other IP addresses on your local LAN, then its time to check your connection. If youre using Ethernet, is it plugged in? If youre using wireless, are you connected to the proper wireless network, and is it in range?
Network debugging with ping is a bit of an art, but it is useful to learn. Since you will likely find ping on just about any machine you will work on, its a good idea to learn how to use it well.
traceroute and mtr
http://www.bitwizard.nl/mtr/. As with ping, traceroute is found on most oper-ating systems (its called tracert in some versions of Microsoft Windows). By running traceroute, you can find the location of problems between your com-puter and any point on the Internet:
$ traceroute -n google.com
traceroute to google.com (72.14.207.99), 64 hops max, 40 byte packets 1 10.15.6.1 4.322 ms 1.763 ms 1.731 ms 2 216.231.38.1 36.187 ms 14.648 ms 13.561 ms 3 69.17.83.233 14.197 ms 13.256 ms 13.267 ms 4 69.17.83.150 32.478 ms 29.545 ms 27.494 ms 5 198.32.176.31 40.788 ms 28.160 ms 28.115 ms 6 66.249.94.14 28.601 ms 29.913 ms 28.811 ms 7 172.16.236.8 2328.809 ms 2528.944 ms 2428.719 ms 8 * * *
The -n switch tells traceroute not to bother resolving names in DNS, and makes the trace run more quickly. You can see that at hop seven, the round trip time shoots up to more than two seconds, while packets seem to be dis-carded at hop eight. This might indicate a problem at that point in the net-work. If this part of the network is in your control, it might be worth starting your troubleshooting effort there.
My TraceRoute (mtr) is a handy program that combines ping and traceroute into a single tool. By running mtr, you can get an ongoing average of latency and packet loss to a single host, instead of the momentary snapshot that ping and traceroute provide.
My traceroute [v0.69]
tesla.rob.swn (0.0.0.0) (tos=0x0 psize=64 bitpatSun Jan 8 20:01:26 2006 Keys: Help Display mode Restart statistics Order of fields quit Packets Pings
Host Loss% Snt Last Avg Best Wrst StDev 1. gremlin.rob.swn 0.0% 4 1.9 2.0 1.7 2.6 0.4 2. er1.sea1.speakeasy.net 0.0% 4 15.5 14.0 12.7 15.5 1.3 3. 220.ge-0-1-0.cr2.sea1.speakeasy. 0.0% 4 11.0 11.7 10.7 14.0 1.6 4. fe-0-3-0.cr2.sfo1.speakeasy.net 0.0% 4 36.0 34.7 28.7 38.1 4.1 5. bas1-m.pao.yahoo.com 0.0% 4 27.9 29.6 27.9 33.0 2.4 6. so-1-1-0.pat1.dce.yahoo.com 0.0% 4 89.7 91.0 89.7 93.0 1.4 7. ae1.p400.msr1.dcn.yahoo.com 0.0% 4 91.2 93.1 90.8 99.2 4.1 8. ge5-2.bas1-m.dcn.yahoo.com 0.0% 4 89.3 91.0 89.3 93.4 1.9 9. w2.rc.vip.dcn.yahoo.com 0.0% 3 91.2 93.1 90.8 99.2 4.1
The data will be continuously updated and averaged over time. As with ping, you should hit control-C when you are finished looking at the data. Note that you must have root privileges to run mtr.
While these tools will not revel precisely what is wrong with the network, they can give you enough information to know where to continue troubleshooting.
Protocol analyzers
Network protocol analyzers provide a great deal of detail about information flow-ing through a network, by allowflow-ing you to inspect individual packets. For wired networks, you can inspect packets at the data-link layer or above. For wireless networks, you can inspect information all the way down to individual 802.11 frames. Here are several popular (and free) network protocol analyzers:
Kismet
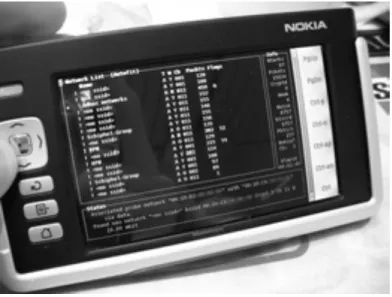
http://www.kismetwireless.net/. Kismet is a powerful wireless protocol ana-lyzer for many platforms including Linux, Mac OS X, and even the embedded OpenWRT Linux distribution. It works with any wireless card that supports passive monitor mode. In addition to basic network detection, Kismet will passively log all 802.11 frames to disk or to the network in standard PCAP format, for later analysis with tools like Ethereal. Kismet also features associ-ated client information, AP hardware fingerprinting, Netstumbler detection, and GPS integration.
Since it is a passive network monitor, it can even detect “closed” wireless networks by analyzing traffic sent by wireless clients. You can run Kismet on several machines at once, and have them all report over the network back to a central user interface. This allows for wireless monitoring over a large area, such as a university or corporate campus.
Figure 6.12: Kismet running on a Nokia 770 Internet Tablet
Since Kismet uses the radio card's passive monitor mode, it does all of this without transmitting any data. Kismet is an invaluable tool for diagnosing wireless network problems.
KisMAC
http://kismac.macpirate.ch/. Exclusively for the Mac OS X platform, KisMAC does much of what Kismet can do, but with a slick Mac OS X graphical inter-face. It is a passive scanner that will log data to disk in PCAP format com-patible with Wireshark. It supports passive scanning with AirportExtreme cards as well as a variety of USB wireless adapters.
tcpdump
http://www.tcpdump.org/. tcpdump is a command-line tool for monitoring network traffic. It does not have all the bells and whistles of wireshark but it does use fewer resources. Tcpdump can capture and display all network pro-tocol information down to the link layer. It can show all of the packet headers and data received, or just the packets that match particular criteria. Packets captured with tcpdump can be loaded into wireshark for visual analysis and further diagnostics. This is very useful if you wish to monitor an interface on a remote system and bring the file back to your local machine for analysis. The tcpdump tool is available as a standard tool in Unix derivatives (Linux, BSD, and Mac OS X). There is also a Windows port called WinDump available at
http://www.winpcap.org/windump/.
Wireshark
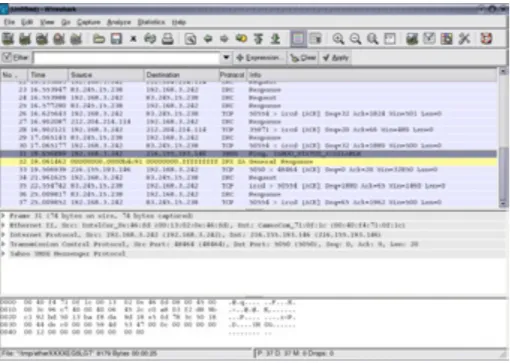
http://www.wireshark.org/. Formerly known as Ethereal, Wireshark is a free network protocol analyzer for Unix and Windows. It is billed as "The World's Most Popular Network Protocol Analyzer."
Figure 6.13: Wireshark (formerly Ethereal) is a powerful network protocol analyzer that can show you as much detail as you like about any packet.
Wireshark allows you to examine data from a live network or from a capture file on disk, and interactively browse and sort the captured data. Both summary and detailed information is available for each packet, including
the full header and data portions. Wireshark has several powerful features, including a rich display filter language and the ability to view the recon-structed stream of a TCP session.
It can be daunting to use for first time users or those that are not familiar with the OSI layers. It is typically used to isolate and analyze specific traffic to or from an IP address, but it can be also used as a general purpose fault finding tool. For example, a machine infected with a network worm or virus can be identified by looking for the machine that is send out the same sort of TCPIP packets to large groups of IP addresses.
Trending tools
Trending tools are used to see how your network is used over a long period of time. They work by periodically monitoring your network activity, and dis-playing a summary in a human-readable form (such as a graph). Trending tools collect data as well as analyze and report on it.
Below are some examples of trending tools. Some of them need to be used in conjunction with each other, as they are not stand-alone programs.
MRTG
http://oss.oetiker.ch/mrtg/. The Multi Router Traffic Grapher (MRTG) monitors the traffic load on network links using SNMP. MRTG generates graphs that provide a visual representation of inbound and outbound traffic. These are typically displayed on a web page.
MRTG can be a little confusing to set up, especially if you are not familiar with SNMP. But once it is installed, MRTG requires virtually no maintenance, unless you change something on the system that is being monitored (such as its IP address).
Figure 6.14: MRTG is probably the most widely installed network flow grapher.
RRDtool
http://oss.oetiker.ch/rrdtool/. RRD is short for Round Robin Database. RRD is a database that stores information in a very compact way that does not