Memorandum
To: Matthew Gerken
From: Christine Safriet, Feliz Ventura, Alexander Quinn, Melissa Higbee
Date: March 3, 2015
Subject: Market Demand Study: Proposed Whole Foods Market at 2025 L Street, Sacramento CA
EXECUTIVE SUMMARY
This memo evaluates market demand for an approximately 40,000 square foot Whole Foods grocery store in addition to existing grocery-anchored retail centers or competitive grocery stores in the Central City area of the city of Sacramento.
AECOM defined the competitive market area (primary trade area) for the proposed Whole Foods Market based on the expected shopping patterns of residents and workers. The primary trade area was further broken out into two subareas, the 0-6 minute drivetime for residents, and the 0-5 minute drivetime for employees, to tailor retail demand estimates to the different expenditure profiles of the two segments. The primary trade area definition corresponds with trade area definitions used in other retail grocery studies1, is consistent with shopping center trade areas defined by the Urban Land Institute, and is consistent with AECOM’s observations on potential customers and the retail context in the Central City area of Sacramento.
Within the primary trade area, AECOM identified five primary competitors: two Safeway supermarkets, the Sacramento Natural Foods Co-Op, a Grocery Outlet discount grocery store, and a Target with a grocery department. Based on estimates of sales per square foot and store size, the existing stores are estimated to total approximately $83 million in annual sales.2 The addition of an approximately 40,000 square foot Whole Foods Market in 2017 would generate an increase in annual grocery store sales in the primary trade area to approximately $121 million.
1 For example: Historic Downtown Sonora Market Opportunities 2013; Downtown Mountain View Grocery Study, 2011; Northeast Oklahoma City Grocery Store Location Analysis.
The primary trade area typically accounts for 60 to 80 percent of total sales at a typical retailer,3 with sales from customers living or working outside the primary market accounting for the remainder of purchases.
In 2014, households and office workers in the primary trade area will generate approximately $98 million in demand for grocery stores. The difference between demand and supply suggest a surplus of
approximately $31 million in demand in in 2014.
In 2017, households and office workers in the primary trade area will generate approximately $101 million in demand for grocery stores. The difference between demand and supply suggests a surplus of nearly $5 million in demand in 2017, when the Whole Foods Market is anticipated to open.
In 2027, households and office workers in the primary trade area will generate approximately $114 million in demand for grocery stores. The difference between demand and supply suggest a surplus of approximately $18 million in demand in 2027.
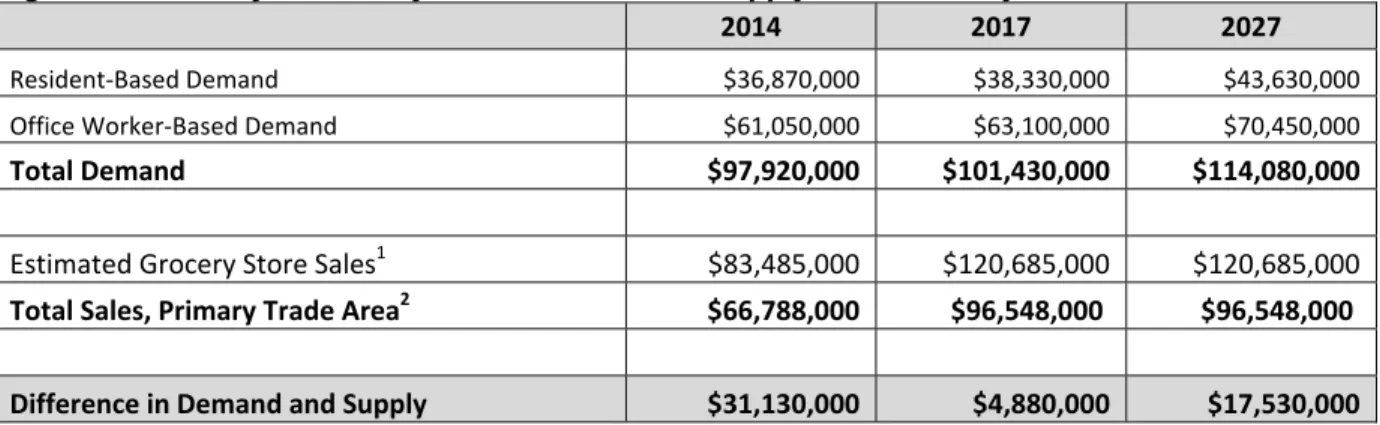
Based on this analysis, market demand is sufficient to support the existing competitive grocery stores in the primary trade area as well as the proposed Whole Foods Market in the opening year through 2027. Figure 1: Summary of Grocery Store Demand and Supply in the Primary Trade Area
2014 2017 2027
Resident‐Based Demand $36,870,000 $38,330,000 $43,630,000
Office Worker‐Based Demand $61,050,000 $63,100,000 $70,450,000
Total Demand $97,920,000 $101,430,000 $114,080,000
Estimated Grocery Store Sales1 $83,485,000 $120,685,000 $120,685,000
Total Sales, Primary Trade Area2 $66,788,000 $96,548,000 $96,548,000
Difference in Demand and Supply $31,130,000 $4,880,000 $17,530,000
Note 1: Estimated Grocery Store Sales includes proposed Whole Foods Market in 2017 and 2027.
Note 2: Primary Trade Area sales typically account for 60%‐80% of total sales. This figure assumes that 80% of sales result from demand in the primary trade area.
Source: Figure 19
In addition to providing sufficient demand to support the expected majority of sales of existing and proposed grocery stores, the retail real estate market in the primary trade area is strong. Vacancy rates have been decreasing and very little new retail supply has been delivered to the market in the last several years. As such, the introduction of the Whole Foods Market is unlikely to cause vacancies. Please note that all values are in constant 2014 dollars, unless stated otherwise.
INTRODUCTION
This memo evaluates market demand for an approximately 40,000 square foot Whole Foods grocery store in addition to existing grocery-anchored retail centers or other competitive grocery stores in the Central City area of the city of Sacramento.
OVERVIEW OF THE GROCERY INDUSTRY
Grocery Industry Market Conditions and Trends
The grocery industry is considered a mature industry with stable revenues, high levels of competition, and rapid consolidation.4 Disposable income is a key driver of industry revenue, as it determines an individual’s or household’s ability to purchase goods and services.5 In fact, households earning over $70,000 accounted for an estimated 55% of grocery industry revenue in 2014.6 As disposable income has grown in the last five years, the supermarket and grocery store industry has grown as well.7 In addition to growing disposable income, the switch to premium, organic, and all-natural brands by some consumers has helped lift industry revenue.8 Consumer concerns regarding health and wellness are expected to continue to grow and as a result, it is anticipated that consumers will seek “natural” and organic brands, which are often priced at a premium.9 Fresh format stores, such as Whole Foods, that emphasize perishables, ethnic, natural, and organic items are anticipated to see a relative gain in market share and store footprint thanks to robust sales growth in these segments. Market share sales for “fresh format” grocery stores are expected to grow from 3.9% in 2013 to 5.4% in 2018.10
In addition to competition from “fresh format” stores, traditional grocery stores face competition from alternative retailers, such as warehouse clubs, superstores, and department stores like Costco, Walmart, and Target. Other sources of competition include online retailers, dollar stores, and
convenience stores.11 Since 2005, traditional grocery stores have not been growing in terms of square footage. At the same time, other formats, including convenience stores, supercenters, and dollars stores have expanded rapidly.12 In the next few years, traditional supermarkets are anticipated to experience a decline in market share from 40.2% of sales revenue in 2013 to 37.2% in 2018 due to shifts in customer spending to alternative retailers.13
Other notable trends in the grocery industry include a shift to smaller footprint stores for new development, more frequent trips by shoppers, and more purchases of prepared items.14 Several demographic changes might explain the shifting grocery shopping habits. Decreasing household size is likely the primary reason why the once-a-week trip is no longer the norm for food shopping.
Furthermore, consumers in urban locations, tend to purchase groceries more frequently from industry establishments instead of wholesale clubs and supercenters.15 At the same time, the number of households with two wage earners has increased, yielding less time to prepare food and clean up after meals, thus making prepared foods more desirable.16
4 Ibis World, Supermarkets and Grocery Stores in the U.S. Industry Report (2014) 5 Ibis World, Supermarkets and Grocery Stores in the U.S. Industry Report (2014)
6 ibid.
7 ibid.
8 ibid.
9 ibid.
10 Jones Lang LaSalle, Shop Topic, 2014
11 Ibis World, Supermarkets and Grocery Stores in the U.S. Industry Report; FMI Food Retailing 2013 12 FMI, U.S. Grocery Shopper Trends, 2012
13 Jones Lang LaSalle, Shop Topic, 2014
14 Urban Land Magazine, 2004, “Rethinking Grocery Stores.”
15 Ibis World, Supermarkets and Grocery Stores in the U.S. Industry Report 16 Urban Land Magazine, 2004, “Rethinking Grocery Stores.”
Also of note is the trend towards convergence of supermarket and drug store business models, as each industry tries to attract the others’ customer base. Drug stores, such as Walgreens, increasingly stock more fresh food and groceries. At the same time, many supermarkets have expanded their pharmacy departments in an effort to capture sales in new retail categories.17
Supermarket Format Types
Definitions are provided below for terms frequently used in the grocery industry and in this study. 18 Traditional/conventional supermarket: Retail stores that sell dry groceries, canned goods, nonfood products and perishables having annual sales of $2 million or more. These stores typically carry between 15,000 and 60,000 stock keeping units (SKUs) and tend to have multiple service departments including but not limited to bakery, butcher, deli, fishery, floral, pharmacy, photo, etc. Traditional supermarkets vary significantly in size but typically range between 20,000 square feet (SF) and 65,000 SF. Examples include Save Mart (formerly Albertsons), Ralphs, and Safeway.
Limited assortment supermarkets: Limited assortment supermarkets are retail stores that carry a limited selection of items in a reduced number of categories and typically have few, if any, service departments. Of the 4,000 SKUs or less offered, a higher percentage are private label relative to traditional
supermarkets. Store size varies; however, the stores are typically between 13,000 SF and 25,000 SF. Examples include Trader Joes and Aldis.
Superettes: Smaller stores that sell mostly packaged and perishable food items with a basic, narrow selection of SKUs and having annual sales of less than $2 million. These stores tend to have few service departments and are sometimes called “mom & pop” stores or corner stores. These stores tend to carry limited private label products.
Supercenters: Large stores, averaging over 170,000 SF in size, which offer general merchandise plus discount stores services in a single location. These stores devote as much as 40% of their space to grocery items. Examples include Walmart and Target.
Fresh format: A specialty retail store focused on healthy living and/or gourmet prepared foods. These stores tend to emphasize perishables and offer ethnic, natural, and organic items while having a limited selection of general merchandise. Store size varies significantly. Examples include Whole Foods Market and The Fresh Market.
Convenience stores: Small outlets that carry primarily dry groceries and have a limited selection of perishables, prepared foods and general non-food merchandise. They usually carry about 800 to 3,000 items. Examples include AM/PM and 7-Eleven.
Dollar Stores:Small store format selling food and consumables at aggressive price points. Food items account for 20% to 66% of their volume. Examples include the 99 Cent Store, Family Dollar, and Dollar General.
17 Supermarket News, “Blurring Channels: Supermarket vs. Drug Stores, 2010. http://supermarketnews.com/blog/blurring-channels-supermarkets-vs-drug-stores
18 Sources: The Reinvestment Fund, 2011. “Understanding the Grocery Industry,” Jones Lang LaSalle, Shop Topic, 2014.
About Whole Foods
Whole Foods Market is a leading natural food retail chain, specializing in natural and organic foods. The grocer has benefited from the popularity of its private brand labels, such as 365 Organic Everyday Value.19 In addition, one of the most distinct qualities of a Whole Foods Market location is its lunch and deli area with hot bars of food sold by the pound, organic pizzerias, and smoothie and coffee bars.20 While average grocery industry sales per square foot are about $500,21 Whole Foods Market has an average of $930.22
LOCAL TRADE AREA CONDITIONS
Demographic, economic, and real estate conditions and trends in the city of Sacramento are presented below. For readers unfamiliar with these terms, this section describes the people, businesses, and physical environment shaping the retail grocery market. Most importantly, the conditions and trends outlined in this section provide a baseline understanding of the primary trade area, in order to evaluate how the proposed Whole Foods grocery store may impact its competitors.
Description of the Primary Trade Area
This analysis frequently references the primary trade area. A trade area is the geography from which an individual retailer, retail center, or retail district draws the majority of its customers. For the purposes of this analysis, the trade area is defined as the combined five- and six-minute drive times from the proposed development site at 2025 L Street in midtown Sacramento, as shown in Figure 2.
The five-minute employee trade area is roughly equivalent to the Central City area bounded by Interstate 5 on the west, U.S. Highway 50 on the south, Business Interstate 80 on the east, and the American River on the north.
The one and a half-mile, 6-minute resident trade area extends to Interstate 5 on the west, 5th Avenue at Freeport Road on the south, East Lawn Memorial Cemetery at 42nd Street on the east, and up to State Route 160 on the north.
The employee trade area falls fully within the city of Sacramento. The resident trade area just intersects the city of West Sacramento.
The primary trade area boundaries are based on the expected shopping behavior of employees and residents. For purposes of this study, it is assumed that residents in the Sacramento region will typically travel up to one and a half miles (approximately equivalent to a 6-minute, non-peak drive time from the project site) to shop at a grocery store, based on generally accepted industry standards.23 The primary trade area is drawn based on an unconstrained/off-peak travel period. During peak travel hours, traffic may extend the actual travel time within the primary trade area to 10 minutes or longer.
19 Ibis World, Supermarkets and Grocery Stores in the U.S. Industry Report (2014) 20 Chain Store Guide, “The 50 Fastest Growing Supermarket Chains,” 2010
21 According to Jones Lang LaSalle, Shop Topic, 2014, the grocery store industry average sales per square foot in 2014 was $507. According to the 2008 ULI report “Dollars and Centers of Shopping Centers,” the national median sales per square foot for supermarkets in neighborhood retail centers is $437 while the western median is $418. The Reinvestment Fund’s 2011 report “Understand the Grocery Industry” estimates traditional or conventional supermarket sales per square foot at approximately $465.
22 Jones Lang LaSalle, Shop Topic, 2014
In addition, it has been assumed that workers will drive a maximum of five minutes to go to a grocery store or a prepared food eatery given time constraints during the work day combined with a traditional one-hour lunch break. As a result, demand from workers is not counted beyond the five-minute drive time, since round trip travel time for workers beyond this distance, after accounting for parking and travel between the office and vehicle, could amount to a substantial portion of the traditional lunch hour. Figure 2: Map of Primary Trade Area
Source: ESRI 2015
Employee Trade Area (5-minute drivetime)
Resident Trade Area (1.5 mile, 6-minute drivetime)
Demographic and Economic Trends Population and Income
The resident trade area was home to approximately 41,900 residents in 2014.24 The resident trade area accounted for 9% of the overall population of the city of Sacramento in 2014.
The resident trade area saw a slight loss in population (466 people) from 2000 to 2010,25 most likely related to job and housing changes resulting from the recession. The resident trade area added 1,109 residents from 2010 to 2014 and is anticipated to grow at an annual rate of 0.8% from 2014 to 2019, which will add nearly 2,000 additional residents over the five-year period.26 Projected growth rates in the resident trade area from 2014 to 2019 are lower than projected growth rates in the city of Sacramento overall (1.3%).27
Median household incomes in the resident trade area are lower than the city overall. In 2014, median household income in the resident trade area was $37,525, compared to $45,533 in the city overall.28 Average household sizes in the resident trade were considerably smaller than in the city overall. The average household size in the resident trade area in 2014 was 1.65, compared to 2.65 in the city overall. This difference in average household sizes is likely due to the urban character of the resident trade area, where there is a greater share of multi-family housing and renters than other areas of Sacramento.
Figure 3: Population, Household, and Income Trends*
Year Annualized Growth Rate
2000 2010 2014 2019 2000‐ 2010 2010‐ 2014 2014‐ 2019 Sacramento Population 406,690 466,488 475,303 493,416 1.38% 0.47% 0.75% Households 154,408 174,624 177,125 183,151 1.24% 0.36% 0.67%
Average Household Size 2.58 2.62 2.64 2.65
Median Household Income dna dna $45,533 $51,255
Resident Trade Area
Population 41,212 40,746 41,855 43,644 ‐0.11% 0.67% 0.84%
Households 22,421 22,472 23,139 24,139 0.08% 0.44% 0.74%
Household Size dna 1.65 1.65 1.65
Median Household Income dna dna $37,525 $42,407
Sources: ESRI, 2015; AECOM, 2015. Notes: Population includes group quarters. Household size excludes group quarters. *Inflation adjustment to 2014$. “dna”= data not available.
24 Source: ESRI Business Analyst, 2015
25 ibid.
26 ibid.
27 City of Sacramento General Plan Update Environmental Impact Report, 2015.
Housing Construction
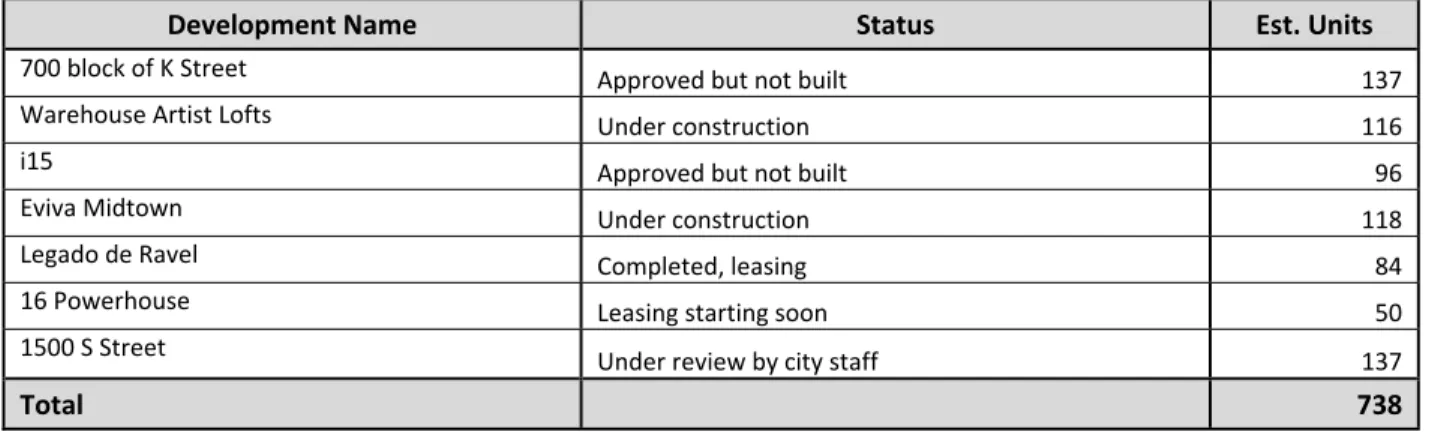
Several apartment and condominium projects are under construction or proposed in the Central City area, which closely corresponds to the resident trade area. Most projects are mid-rise structures of four to five stories – many with ground-floor retail. The addition of an estimated 738 units in the coming months with an average household size of 1.5629 would results in an additional 1,151 residents in the five-minute resident trade area. As such, population growth in the trade area may be greater than the estimate of 990 new residents from 2014-2019 provided in the table above.30 In addition, residents in the trade area purchasing new condos or leasing new apartments may have higher incomes than existing residents, which would result in additional demand that could be captured by retail outlets in the area.
Figure 4: Housing Development in the Central City Area
Development Name Status Est. Units
700 block of K Street Approved but not built 137
Warehouse Artist Lofts Under construction 116
i15 Approved but not built 96
Eviva Midtown Under construction 118
Legado de Ravel Completed, leasing 84
16 Powerhouse Leasing starting soon 50
1500 S Street Under review by city staff 137
Total 738
Sources: http://www.sacbee.com/news/business/real‐estate‐news/article2606630.html; http://www.kcra.com/news/local‐news/news‐
sacramento/vote‐tonight‐could‐prove‐coup‐for‐k‐street‐comeback/28986402
Note: The table above does not include the 141 units proposed as a part of the 2025 L Street / 2101 Capitol Avenue Mixed‐Use Project (which also includes the Whole Foods Market).
Employment
The area surrounding the project site is job-rich. In 2011, the five-minute trade area had approximately 130,000 primary jobs31, representing 47% of total jobs citywide, respectively. Job growth has been especially high in the employment trade area, which experienced an annualized job growth rate of 6.1% from 2002-2011. Growth in this area outpaced job growth in citywide.
Over 60% of the jobs in the five-minute trade area are in public administration, which results from the presence of state government offices.32
29 1.56 is the 2014 average household size in the five-minute trade area from ESRI Business Analyst, 2015 30 ESRI Business Analyst, 2015
31 Primary job for an individual is defined as the job that earned the individual the most money. Constructed this way, the number of primary jobs should be equal to the number of workers and avoids double counting employees who may hold more than one position (such as part time workers).
32 Note: 2011 is the most recent data available. Source: U.S. Census Bureau, OnTheMap Application and LEHD Origin-Destination Employment Statistics, 2011
Figure 5: Employment Trends
2002 2011 2002‐2011 Annualized
Growth Rate
Sacramento
Employees 198,801 282,380 3.98%
5‐Minute Trade Area
Employees 76,303 130,028 6.10%
Source: U.S. Census Bureau, OnTheMap Application and LEHD Origin-Destination Employment Statistic, 2011; AECOM, 2015.
Long-Term Population, Housing, and Employment Projections
The City of Sacramento is projecting the addition of 164,900 new residents from 2012 to 2035,
representing an average annual growth rate of 1.30%. Housing units are expected to grow at a slightly faster pace, at 1.33% average annual growth. The Central City Community Planning Area (CPA), which closely corresponds with the five-minute trade area, is anticipated to add approximately 24,200 housing units by 2035, which accounts for approximately 35% of the total housing unit growth citywide. Almost all of those units are anticipated to be in multi-family structures.33
The City of Sacramento is also projecting the addition of more than 68,000 jobs from 2012 to 2035, representing an annual average growth rate of 1.11%. This growth rate is considerably lower than the growth rates experienced in the employment trade area and citywide from 2002-2011.
Figure 6: Projected Population, Housing, and Employment Growth in the City of Sacramento, 2012-2035 2012‐2035 2012 2035 Change % change Average annual growth rate Population 475,500 640,400 164,900 35% 1.30% Housing Units 192,352 260,699 68,347 36% 1.33% Employment 299,732 386,215 86,483 29% 1.11%
Source: 2035 General Plan Update EIR
Time-Trend Analysis of Taxable Sales
The city of Sacramento experienced stable to moderate growth in taxable sales from 2009 to 2012. Total taxable sales increased 3.5% in that time period, while taxable sales from retail and food services increased by 5.6%. From 2009 to 2010, total taxable sales from all outlets fell very slightly, but taxable sales from retail and food services remained stable.
Only three quarters of taxable sales are available for 2013, but if the trend from Q1- Q3 continues into Q4, 2013 taxable sales would be higher than 2012.
33 E-mail communication with Jim McDonald, City of Sacramento, January 6, 2015 regarding growth projections in the Draft 2035 City of Sacramento General Plan.
Figure 7: Taxable Sales in the City of Sacramento, 2009-2012*
* Inflation adjusted to 2014$
Source: California Board of Equalization; AECOM, 2015.
Time Trend Analysis of Sales Permits
The number of taxable sales permits for supermarkets and other grocery stores remained stable from 2009 to 2012 at approximately 400. However, other store formats experienced growth, especially specialty food stores, which increased 73% to 335 permits during those same four years. As a share of total food and beverage store sales permits, supermarkets and grocery stores fell from 42% to 35%. These trends suggest increasing competition in the food and beverage sales market in Sacramento, which corresponds to nationwide trends.
Figure 8: Taxable Sales Permits for Food and Beverage Stores, City of Sacramento, 2009-2012
Source: CA Bureau of Equalization
$‐ $1,000,000 $2,000,000 $3,000,000 $4,000,000 $5,000,000 $6,000,000 2009 2010 2011 2012 Taxable Transactions (in thousands, 2014$) Total All Outlets Retail and Food Services ‐ 100 200 300 400 500 2009 2010 2011 2012 Number of Taxable Sales Permits Supermarkets and Other Grocery Stores Convenience Stores Specialty Food Stores Beer, Wine, and Liquor Stores
Analysis of Retail Space Trends
Retail sales and the demand for space by retailers are connected as retailers use revenue from sales to pay for retail space. Trends in the retail real estate market in the downtown/midtown/east Sacramento submarket, which closely corresponds to the six-minute resident trade area, were analyzed as part of this analysis.
There are approximately 5.7 million square feet of rentable retail building area in the submarket. Over the last four years, the submarket has seen a net loss of over 170,000 square feet of retail space. Retail space increased by just 34,250 square feet from the first quarter of 2011 to the second quarter of 2014. Then, in the third quarter of 2014, the submarket saw a loss of over 200,000 square feet (or 3.5%) of rentable retail building area.34 This loss was the result of demolition of the eastern portion of the
Downtown Plaza Mall to make room for a new Downtown Entertainment and Sports Complex (with new arena for the Sacramento Kings).35
Occupied square footage has remained steady for the last four years at 5.4 million square feet. The highest point occurred in third quarter of 2013, with 5.6 million occupied square feet with the lowest point occurring the very next quarter (fourth quarter 2013) at 5.38 million square feet.
Vacancy rates declined to 3.9% in the third quarter of 2014, their lowest point in the last four years. This decline occurred after a peak vacancy rate of 9.2% in fourth quarter of 2013. The fourth quarter 2014 vacancy rate in the submarket (4.4%) is lower than the city of Sacramento vacancy rate (9.6%) and county of Sacramento vacancy rate (10.6%).36 These vacancy rates suggest a stronger retail market (higher demand for space) in the submarket than in the city and county overall.
Very little new rentable building area has been built (i.e. delivered) this market in the last four years. The largest delivery occurred in 3Q 2013 with 43,000 square feet.
34 CoStar, 2015
35 http://www.bizjournals.com/sacramento/news/2014/08/12/visible-demolition-to-begin-wednesday-at-future.html 36 CoStar, 2015
Figure 9: Retail Real Estate Market Trends in Downtown/Midtown/East Sacramento Submarket Period Number of Buildings Total Rentable Building Area (SF) Total Vacant Square Footage Percent Vacant Occupied Square Footage Direct Net Absorption Rentable Building Area Delivered Direct Average Rate (nnn) 2014 4Q 839 5,721,609 251,849 4.4% 5,469,760 (26,498) 0 $17.90 3Q 839 5,721,609 225,351 3.9% 5,496,258 (55) 0 $18.98 2Q 840 5,927,284 430,971 7.3% 5,496,313 68,909 5,019 $17.47 1Q 841 5,929,240 501,836 8.5% 5,427,404 42,295 0 $16.38 2013 4Q 841 5,929,240 544,131 9.2% 5,384,359 (218,272) 0 $16.24 3Q 841 5,929,240 325,859 5.5% 5,600,181 50,642 43,072 $16.04 2Q 840 5,900,168 347,429 5.9% 5,551,539 12,844 0 $14.96 1Q 840 5,900,168 360,273 6.1% 5,539,895 (1,979) 0 $15.37 2012 4Q 840 5,900,168 358,294 6.1% 5,541,874 (6,517) 10,808 $15.57 3Q 838 5,889,360 340,969 5.8% 5,548,391 11,254 0 $15.44 2Q 838 5,889,360 352,223 6.0% 5,537,137 41,475 0 $15.76 1Q 840 5,895,592 399,930 6.8% 5,495,662 (8,823) 0 $15.18 2011 4Q 840 5,895,592 391,107 6.6% 5,504,485 12,900 0 $15.38 3Q 840 5,895,592 404,007 6.9% 5,491,585 9,550 0 $15.84 2Q 840 5,895,592 413,557 7.0% 5,480,123 (2,451) 0 $14.99 1Q 839 5,893,034 408,548 6.9% 5,484,486 (50,199) 2,558 $15.28
“nnn” = triple net lease
Sources: CoStar, 2015; AECOM, 2015
Planned and Proposed Grocery Anchored Retail Projects
Other than the project site, there are no other known planned or proposed grocery stores in the resident trade area. Slightly beyond the resident trade area, there is a proposed grocery store at Curtis Park Village (Sutterville Road and Crocker Drive), approximately 2.6 miles from the project site.
Below are additional planned or proposed grocery stores outside of the primary trade area:37
► The CVS project at Fair Oaks/Howe Avenue has a future building for a grocer that is 27,870 square
feet. It is not fully entitled because the developer needs to complete Site Plan and Design Review for the building; City staff do not have an anticipated application date. The existing approval was for the CVS Pharmacy only. There is an existing Safeway across the street from this project site.
► Delta Shores, a master planned development in the southern part of the City, includes a conditional
use permit for a Super Walmart, which includes a grocery component.
► A VIVA grocery store is planned near Marysville and Grand Avenue in the North area.
37 CoStar 2015
Characterization of Local Grocery Stores
The discussion of local grocery stores focused on those that might be competitive with a Whole Foods, and as a result, could experience reduced sales revenue. Larger-format grocery stores (at least 13,000 square feet) offering a high number of SKUs, including meats, produce, and household goods were assessed for this study. These stores fall into the categories traditional supermarket, limited assortment supermarket, and natural/gourmet/fresh format. Understanding the differences in offerings and customer experience is important in order to assess how the proposed Whole Foods Market may compete, or not compete, with existing grocery retail centers within the primary trade areas.
Five competitive grocery stores (including one Target) were identified in the primary trade area, which are mapped and described below. Typically, a store will generate 60-80% of sales from this trade area, its primary market.38 Grocery stores, warehouse clubs, and supercenters outside the competitive market areas were also mapped to help illustrate some of the other options that Sacramento residents and works have for groceries. However, they were not considered directly competitive grocery supply, due to their distance from the site and the definition of the primary trade area boundaries. One specialty grocer within the primary trade area, Taylor’s Market, was also excluded from the competitive supply due to its limited size, scale, and specialty offerings. Convenience and small-format grocery stores within the primary trade area were excluded from the competitive analysis. The calculation of supportable grocery demand accounts for the share of household grocery store spending at the competitive set (traditional supermarkets, those offering a full line of groceries, meats, and produce with at least $2 million in annual sales).
Figure 10: Map of Competitive Grocery Stores & Supercenters in the Primary Trade Area
Source: Google Earth; ESRI, AECOM, 2015.
R Street Safeway, 1814 19th Street
R Street Market, located 0.7 miles south of the project site, is anchored by a Safeway. The gross leasable retail area of the neighborhood center is approximately 100,000 square feet, with the Safeway comprising 52,000 square feet.39 Safeway stores are considered traditional supermarkets (see
definitions in the Supermarket Format Types section). As a more recently constructed Safeway store, it is modeled in a “lifestyle” format with a wider variety of perishable foods, organic products, and high-end groceries to compete with grocery offerings at upscale specialist stores.40 It also contains a deli with
39 CoStar, 2015
prepared foods and a Starbucks. Given its proximity to the project site and “lifestyle” format, it would likely be competitive with the proposed Whole Foods Market.
The neighborhood center also includes inline retail, including a Panda Express, UPS Store, and a dry cleaner. In addition, the center includes two freestanding retail buildings (pad sites) with a Peets Coffee, a ramen restaurant, and Wells Fargo. This site was redeveloped in 2005 and also includes 6 one-bedroom and 5 two-one-bedroom loft apartments.41
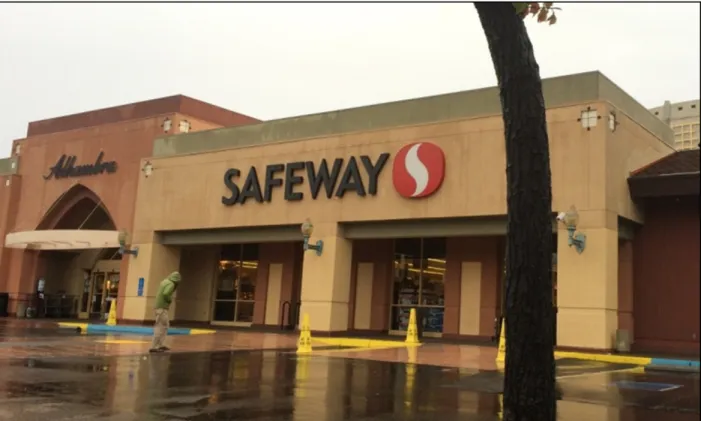
Alhambra Safeway, 1025 Alhambra Boulevard
The Safeway at 1025 Alhambra Boulevard is a standalone grocery store located 1.1 miles east of the project site and near Business Interstate 80/Capital City Freeway. The Safeway is approximately 48,500 square feet42 and is a more traditional format compared to more recently renovated stores with a
“lifestyle” format. The store includes a deli offering prepared foods and a Starbucks kiosk. Given its proximity to the proposed Whole Foods Market, this is likely a competitor.
A Rite Aid is located across Granada Way from the Safeway store. A taqueria and U.S Bank are located in the same shopping center, but on separate retail pads. Across the street from the supermarket there are a number of fast food establishments, a Bank of America, and a neighborhood restaurant.
Figure 11: Alhambra Boulevard Safeway
Source: AECOM 2015.
41 http://petrovichdevelopment.net/doc.aspx-19.htm 42 CoStar, 2015
Sacramento Natural Foods Co-Op, 1900 Alhambra Boulevard
This store is located on the southwest corner of Alhambra Boulevard and S Street, approximately 1.4 miles southeast of the project site. It falls into the category of a natural/gourmet/fresh format store. It is approximately 16,000 square feet in total size, with approximately 12,000 square feet of retail space, offering43 a selection of 100% organic produce, bulk items, meat, coffee, wines, cheese, and prepared foods. Compared to other supermarkets in the primary trade area, this one has very limited parking. The store will be relocating in 16 to 24 months to a larger location two blocks west, where they will be able to add a bakery and gelato bar. The new store is expected to total 40,000 square feet on two levels, with its retail offering expanding to 16,000 square feet, and the balance of space devoted to meeting space, restaurant-style café service, and back of house functions.44 Given the similarity in product offerings to a Whole Foods Market and proximity to the project site, this would likely be competitive with the proposed Whole Foods.
Grocery Outlet, 1700 Capitol Avenue
Grocery Outlet is approximately one-half mile west of the project site, on Capitol Avenue between 17th Street and 18th Street. This is a limited assortment supermarket, about 13,000 square feet in size. Offerings are focused on the discount buyer, and include overstock inventory of non-perishable goods, frozen foods, produce, dairy, wine and beer. The store has a small parking lot adjacent to the site, but it easily accessible on foot. The focus on discount and overstock products reduce its competitiveness for Whole Foods’ target market.
Target, 2505 Riverside Boulevard
Target is located approximately one mile from the project site, on Riverside Boulevard between
Broadway and Beverly Way. This supercenter discount department store is over 100,000 square feet. In addition to household goods, Target’s offerings include produce, frozen foods, wine and it also has a pizza café. Target has a more limited selection of grocery items and greater selection of household goods compared to Whole Foods. Although Target may be competitive within the primary trade area for grocery sales, it is more oriented towards shoppers primarily seeking household goods rather than grocery items or dining.
Full Service Grocers
A broad selection of additional full service grocery retailers are located within three miles of the project site, including but not limited to Trader Joe’s, Save Mart, Costco, multiple Raley’s, and Sprouts. These stores have a focus on grocery or else offer a mix of products including a major grocery component, and are oriented toward suburban markets surrounding Sacramento’s urban core.
RETAIL SUPPLY AND DEMAND
Supply & Estimated Sales
The primary trade area currently contains five competitive grocery retailers totaling approximately 240,000 square feet. The proposed Whole Foods Market would add approximately 40,000 square feet of additional competitive grocery store retail supply to the primary trade area.
43 http://www.bizjournals.com/sacramento/news/2014/07/31/what-does-whole-foods-news-mean-for-sacramento-co.html?page=all ; CoStar 2015
44
Sales per square foot were determined for each competitive store category or specific chain, as data was available. By multiplying store size by average sales per square foot for each store chain or format, the existing competitive grocery stores were estimated to gross approximately $83,485,000 in annual sales in 2014. The proposed 40,000 square foot Whole Foods Market is expected to generate $37 million in total sales. The addition of the proposed Whole Foods Market to the primary trade area would increase total estimated sales to $120,685,000 annually, as shown in Figure 12.
The primary trade area typically accounts for 60 to 80 percent of total sales at a typical retailer,45 with sales from customers living or working outside the primary market accounting for the remainder of purchases. Using a conservative estimate that 80% of total sales will be generated by the primary trade area, the estimated grocery sales total $96.5 million, as shown in
Figure 13.
Figure 12: Competitive Grocery Store Sales
Store Name Sales per Square Foot Store Size in Square Feet Estimated Total Sales Primary Trade Area R Street Safeway $570 52,000 $29,640,000
Alhambra Street Safeway $570 48,500 $27,645,000
Sacramento Natural Foods Co‐Op $900 16,000 $14,400,000
Grocery Outlet $400 13,000 $5,200,000
Target $60* 110,000 $6,600,000
Total 239,500 $83,485,000
Additional Supply
Proposed Whole Foods $930 40,000 $37,200,000
Total Including Whole Foods 279,500 $120,685,000
* Sales per square foot at Target are sales attributable to grocery (21%); total sales per square foot at Target were calculated at $297 per foot based on annual report data, then rounded to the nearest $10
Sources: Store sizes: CoStar, 2015 and Google Earth, 2015 ; Sales per square foot: JLL Shop Topic, 2014 for Whole Foods Market sales per square foot; Co-op estimated based on Whole Foods sales; Safeway Annual Report (Form 10-K), 2013; Target Annual Report (Form 10-K), 2013.
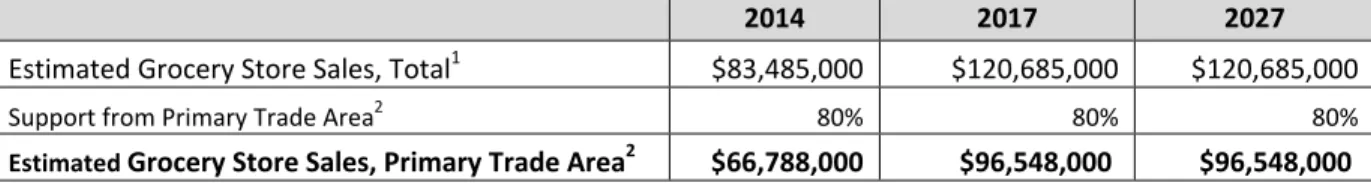
Figure 13: Competitive Grocery Store Sales Supported by Primary Trade Area
2014 2017 2027
Estimated Grocery Store Sales, Total1 $83,485,000 $120,685,000 $120,685,000
Support from Primary Trade Area2 80% 80% 80%
Estimated Grocery Store Sales, Primary Trade Area2 $66,788,000 $96,548,000 $96,548,000 Note 1: Estimated Grocery Store Sales includes proposed Whole Foods Market in 2017 and 2027. See Figure 12.
Note 2: Primary Trade Area sales typically account for 60%-80% of total sales. This calculation takes a conservative approach and assumes that 80% of sales result from demand in the primary trade area.
Household-Based Demand
Demand originating from households in the primary trade area for product categories sold in grocery stores as a percent of household expenditures is a key source of grocery store sales. These product categories include Food at Home, Food Away from Home, Alcoholic Beverages, Personal Care Products and Services, and Housekeeping Supplies. A conservative approach was used in the
calculation of Household-Based Demand and did not include purchases of “Personal Care Products and Services” or “Housekeeping Supplies” in its household-based demand estimation, as there is not a reliable source to understand what share of the category is purchased from grocery stores.
Nevertheless, both the proposed Whole Foods Market and some of the existing competitive grocery stores sell these product categories. As such, sales in this product category will provide another source of revenue for both existing grocery stores and the proposed Whole Foods Market.
In 2014, demand from households in the primary trade area for these product categories was more than $111 million. Demand was also assessed in 2017, the year the proposed Whole Foods Market is anticipated to open, and 10 years after opening in 2027. The City of Sacramento General Plan’s average annual growth rate for population was applied to estimate the number of households living in the primary trade area in 2017 and 2027. Based on the increase in the number in households living in the primary trade area, demand is projected to increase to approximately $115 million in 2017 and $131 million in 2027.
Figure 14: Resident Trade Area Expenditures in Select Categories
Households 23,139 24,055 27,380
Median Household Income $37,525
Average Household Income $55,128
Household Expenditures $30,771
% of
Expenditures 2014 2017 2027
Food at Home 7.6% $54,111,894 $56,254,602 $64,028,864
Food Away from Home 5.0% $35,599,930 $37,009,606 $42,124,252
Alcoholic Beverages 0.9% $6,407,987 $6,661,729 $7,582,365
Personal Care Products & Services 1.1% $7,831,985 $8,142,113 $9,267,336
Housekeeping Supplies 1.0% $7,119,986 $7,401,921 $8,424,850
Total Expenditures $111,071,782 $115,469,972 $131,427,667
Sources: U.S. Census Bureau 2010 Decennial Census; ESRI Business Analyst 2014; Consumer Expenditure Survey; AECOM, 2015. Note: Total household expenditures were estimated to be 82% of household income according the Bureau of Labor Statistics Consumer Expenditure Survey
Capture rates were applied to this total pool of household expenditures based on the estimated spending distribution of total sales to grocery stores in each of the categories. The US Department of Agriculture Economic Research Services produces annual estimates of the capture of sales of food at home and away from home by type of outlet. Estimates for the capture of alcoholic beverages were based on data from the Bureau of Labor Statistics. Sales from Personal Care Products and
Figure 15: Resident Trade Area Grocery Demand in Select Categories
Capture Rate 2014 2017 2027
Food at Home 63% $34,252,829 $35,609,163 $40,530,271
Food Away from Home 0.5% $184,808 $192,126 $218,677
Alcoholic Beverages 38% $2,433,754 $2,530,125 $2,879,782
Personal Care Products & Services 0% $0 $0 $0
Housekeeping Supplies 0% $0 $0 $0
Total Demand $36,871,390 $38,331,414 $43,628,730
Calculation of demand equals capture rate multiplied by expenditures in Figure 15.
Source: Capture rates: US Department of Agriculture Economic Research Services, Bureau of Labor Statistics, National Public Radio.
Office Worker-Based Demand
Worker-based demand for grocery stores was estimated using the spending patterns of office workers.46 First, the number of office workers in the five-minute employee trade area was determined using employment by sector data.47 In 2011, there were nearly 70,000 office workers in the five-minute trade area.
46 International Council of Shopping Centers, 2012, “Office-Worker Retail Spending in a Digital Age.” https://www.downtowndevelopment.com/pdf/icsc-report_office-worker-spending.pdf
Figure 16: 2011 Office Workers in the Employee Trade Area Sector Number of Workers48 Share of Workers Percent that Work in an Office (e) Count of Office Workers
Public Administration (a) 80,201 62% 75% 60,151
Other Services (excluding Public Administration) 8,516 7% 25% 2,129
Professional, Scientific, and Technical Services 8,236 6% 100% 8,236
Health Care and Social Assistance 6,685 5% 0% ‐
Accommodation and Food Services 5,519 4% 0% ‐
Retail Trade 2,834 2% 0% ‐
Transportation and Warehousing 2,519 2% 0% ‐
Information 2,081 2% 100% 2,081
Finance and Insurance 1,916 1% 100% 1,916
Arts, Entertainment, and Recreation 1,845 1% 0% ‐
Admin & Support, Waste Mgmt and Remediation 1,842 1% 0% ‐
Manufacturing 1,751 1% 0% ‐
Educational Services 1,341 1% 0% ‐
Construction 1,139 1% 0% ‐
Real Estate and Rental and Leasing (c) 1,040 1% 33% 343
Utilities 1,020 1% 0% ‐
Wholesale Trade 1,011 1% 0% ‐
Management of Companies and Enterprises 499 0% 100% 499
Agriculture, Forestry, Fishing and Hunting 32 0% 0% ‐
Mining, Quarrying, and Oil and Gas Extraction 1 0% 0% ‐
Employed and Living in the Selection Area (d) (5,382)
Total 130,028 69,973
Sources: U.S. Census Bureau, OnTheMap Application and LEHD Origin-Destination Employment Statistics, 2011; AECOM, 2015. (a) Public administration includes some fire and police protection services that are not office-based. However, most are administrative jobs that would happen in an office. (b) Other Services includes repair and maintenance, personal and laundry services, religious, grantmaking, civic and similar organizations, and private households. (c) Real estate rental and leasing includes property managers and sales agents that may not work in an office on a daily basis. (d) To avoid double counting, people who live and work in the employee trade area were removed, as their demand is already captured by the household demand analysis. (e) This column is an AECOM estimate based on notes (a) through (c).
Because the most recent LEHD employment figures are from 2011, employment growth rates from the City of Sacramento 2035 General Plan EIR were applied to estimate the number of office workers in the five-minute trade area in 2014, 2017, and 2027. Next, the number of workers was multiplied by annual spending per worker in retail categories where a Whole Foods Market would be competitive to
determine total office worker demand. These retail categories include: Grocery Stores, Fast
Food/Deli/Lunch Eateries, Drug Stores, and Personal Care Shops. However, to be conservative, only the demand for Grocery Stores and Fast Food/Deli/Lunch Eateries was captured in the next stage of the analysis; assessing the competitive landscape for the other categories is beyond the scope of this analysis. Furthermore, the proposed Whole Foods Market only includes limited retail in categories beyond grocery and is thus unlikely to substantially impact the overall retail landscape in the city.
48 Workers were estimated as primary jobs. A primary job for an individual is defined as the job that earned the individual the most money. Constructed this way, the number of primary jobs should be equal to the number of workers and avoids double counting employees who may hold more than one position (such as part time workers).
In 2014, office worker spending generated nearly $62 million in demand for grocery stores and over $100 million in the other categories that a grocery store could potentially capture. Office worker
spending at grocery stores is projected to increase to nearly $64 million in 2017 and $71 million by 2027 resulting from an increase in the number of workers.
Figure 17: Office Worker Trade Area Expenditures in Select Categories
2014 2017 2027
Office workers in the trade area 72,325 74,757 83,468
Spending Categories Per worker
annual spending Total expenditures Total expenditures Total expenditures
Grocery Stores $856 $61,902,456 $63,983,535 $71,439,115
Fast Food/Deli/Lunch Eateries $688 $49,777,632 $51,451,090 $57,446,347
Drug Stores $328 $23,746,061 $24,544,372 $27,404,366
Personal Care Shops
$419 $30,331,429 $31,351,131 $35,004,272
Total $165,757,577 $171,330,129 $191,294,101
Source: ICSC Research, 2012 for annual worker spending; U.S. Census Bureau, OnTheMap Application and LEHD Origin-Destination Employment Statistics, 2011 for number of office workers; City of Sacramento 2035 General Plan EIR for employment growth rates; AECOM 2015
Capture rates were applied to this total pool of office worker expenditures based on the estimated spending distribution of total sales to grocery stores in each of the categories. The U.S. Department of Agriculture produces annual estimates of the capture of sales of food away from home by type of outlet. The International Council of Shopping Centers estimates the total value of sales at grocery outlets near a workers place of employment. Estimates for capture of sales at Drug Stores and Personal Care shops were excluded due to a lack of capture data.
Figure 18: Office Worker Trade Area Grocery Demand in Select Categories
Spending Categories Capture Rate 2014 2017 2027
Grocery Stores 95% $58,807,333 $60,784,358 $67,867,159
Fast Food/Deli/Lunch Eateries 5% $2,239,993 $2,315,299 $2,585,086
Drug Stores 0% $0 $0 $0
Personal Care Shops 0% $0 $0 $0
Total $61,047,326 $63,099,657 $70,452,245 Calculation of demand equals capture rate multiplied by expenditures in Figure 17.
Source: Capture rates: US Department of Agriculture Economic Research Services, ICSC Research, 2012 Worker Spending, adjusted down from 100 to 95% by AECOM.
Comparison of Supply and Demand
The combined household and office worker-based demand for grocery stores was compared with the existing and proposed competitive grocery store supply in the primary trade area. When demand exceeds supply, then existing grocery stores are unlikely to be negatively affected by the proposed Whole Foods. If supply exceeds demand, then proposed new Whole Foods Market could affect sales at existing stores.
As described in the preceding sections, not all of the household-based expenditures for food at home, beverages, personal care, and housekeeping products will be captured or purchased at grocery stores. Residents may also purchase these items at convenience stores, dollar stores, supercenters, online
retailers and at other outlets. As such, appropriate capture rates were applied to total expenditures to estimate the demand for items that would likely be purchased as a traditional supermarket, including limited assortment supermarket and fresh format store. Based on the capture rates identified in Figure 15, household demand for the competitive grocery stores is estimated to be approximately $37 million in 2014, $38 million in 2017, and $44 million 2027.
In addition, office worker spending is estimated to generate $61 million in grocery store demand in 2014, $64 million in 2017, and more than $70 million in 2027. This spending brings total grocery store demand from both households and office workers to $98 million in 2014, $101 million in 2017, and $114 million in 2027.
In the supply analysis, the estimated sales of competitive grocery stores supported in the primary trade area are $67 million in 2014. The addition of the Whole Foods Market would increase total estimated grocery sales to $97 million in 2017, which remains constant through 2027.
When demand is compared to supply, the primary trade area had an estimated net surplus of $31 million in excess demand in 2014. With the addition of the proposed Whole Foods Market, the trade area is projected to have excess demand of almost $5 million in 2017, and approximately $18 million by 2027. As such, sufficient demand exists in the trade area to support the addition of a Whole Foods Market and the existing competitive grocery store supply.
Figure 19: Grocery Store Demand and Supply Comparison
2014 2017 2027
Resident‐Based Demand
Food at Home $34,252,829 $35,609,163 $40,530,271
Food Away from Home $184,808 $192,126 $218,677
Alcoholic Beverages $2,433,754 $2,530,125 $2,879,782
Personal Care Products & Services $0 $0 $0
Housekeeping Supplies $0 $0 $0
Subtotal: Household‐Based Grocery Store Demand $36,871,390 $38,331,414 $43,628,730
Office Worker‐Based Demand
Grocery $58,807,333 $60,784,358 $67,867,159
Fast Food/Lunch/Deli Demand $2,239,993 $2,315,299 $2,585,086
Subtotal: Office Worker‐Based Grocery Store
Demand $61,047,326 $63,099,657 $70,452,245
Total Demand $97,919,000 $101,431,000 $114,081,000
Supply
Competitive Supply Grocery Sales $85,240,000 $85,240,000 $85,240,000
Proposed Whole Foods $37,200,000 $37,200,000
Total Sales $83,485,000 $120,685,000 $120,685,000
Total Sales, Primary Trade Area $66,788,000 $96,548,000 $96,548,000
Difference in Demand and Supply $31,131,000 $4,883,000 $17,533,000
Sources:
CONCLUSIONS
This analysis has found sufficient demand in the primary trade area to support the addition of the proposed Whole Foods Market and the existing competitive grocery supply. In 2017, the year that the proposed Whole Foods Market is anticipated to open, demand is estimated to exceed supply by approximately $5 million. In 2027, supply is estimated to exceed demand by approximately $18 million. National and local trends indicate that the traditional grocery stores will likely continue to see increased competition from alternative grocery retailers, including smaller format specialty food stores, dollar stores, supercenters, and online retailers. While these trends will continue to put pressure on grocery store performance, long-term demand is estimated to be sufficient to support the existing competitive grocery store supply and the proposed Whole Foods Market.
Finally, the retail real estate market in the primary trade area is strong. Vacancy rates have been decreasing and very little new retail supply has been delivered to the market in the last several years. As such, the introduction of a new 40,000 square foot Whole Foods Market is unlikely to cause vacancies.