Method development for gas quality determination
in the LNG storage of a LNG/LCNG refuelling station
(Mätmetodsutveckling för gaskvalitetsbestämning i en
LNG/LCNG-tankstations LNG-lager)
Karine Arrhenius, Daniel Kühnemuth, Haleh Yaghooby, Lars Ohlson
”Catalyzing energygas development
for sustainable solutions”
LNG/LCNG refuelling station (Mätmetodsutveckling för gaskvalitetsbestämning i en LNG/LCNG-tankstations LNG-lager)
Karine Arrhenius, SP Sveriges Tekniska Forskningsinstitut Daniel Kühnemuth, SP Sveriges Tekniska Forskningsinstitut Haleh Yaghooby, SP Sveriges Tekniska Forskningsinstitut Lars Ohlson, Fordonsgas Sverige AB
Denna studie har finansierats av: Energimyndigheten
E.ON GAS Sverige AB Fordonsgas Sverige AB Scania CV AB
Svenskt Gastekniskt Center AB, SGC
SGC är ett spjutspetsföretag inom hållbar utveckling med ett nationellt uppdrag. Vi arbetar under devisen”Catalyzing energygas development for sustainable solutions”. Vi samord-nar branschgemensam utveckling kring framställning, distribution och användning av energigaser och sprider kunskap om energigaser. Fokus ligger på förnybara gaser från rötning och förgasning. Tillsammans med företag och med Energimyndigheten och dess
Samverkansprogram Energiteknikutvecklar vi nya möjligheter för energigaserna att bidra till ett hållbart samhälle. Tillsammans med våra fokusgrupper inomRötning,Förgasning och bränslesyntes,Lagring och transport,Industri och hushålloch Gasformiga drivmedel
identifierar vi frågeställningar av branschgemensamt intresse att genomföra forsknings-, utvecklings och/eller demonstrationsprojekt kring. Som medlem i den europeiska gas-forskningsorganisationen GERG fångar SGC också upp internationella perspektiv på ut-vecklingen inom energigasområdet.
Resultaten från projekt drivna av SGC publiceras i en särskild rapportserie – SGC Rap-port. Rapporterna kan laddas ned från hemsidan –www.sgc.se. Det är också möjligt att prenumerera på de tryckta rapporterna. SGC svarar för utgivningen av rapporterna medan rapportförfattarna svarar för rapporternas innehåll.
SGC ger också ut faktabroschyrer kring olika aspekter av energigasers framställning, dis-tribution och användning. Broschyrer kan köpas via SGC:s kansli.
SGC har sedan starten 1990 sitt säte i Malmö. Vi ägs av E.ON Gas Sverige AB, Energi-gas Sverige, SwedeEnergi-gas AB, Göteborg Energi AB, Lunds Energikoncernen AB (publ) och Öresundskraft AB.
Malmö 2013
Martin Ragnar
Swedish Gas Technology Centre, SGC
SGC is a leading-edge company within the field of sustainable development having a na-tional Swedish assignment. We work under the vision of “Catalyzing energygas develop-ment for sustainable solutions”. We co-ordinate industry-wide technical development on the production, distribution and utilization of energygases and disseminate knowledge on energygases. Focus is on renewable gases from anaerobic digestion and gasification. Together with private companies and with the Swedish Energy Agency and its frame pro-gramCo-operational program in Energygas technologywe develop new solutions where energygases could provide benefits for a sustainable society. Together with our focus groups onAnaerobic digestion,Gasification and fuel synthesis,Storage and transporta-tion,Industry and householdandGaseous fuelswe identify issues of common interest in the industry to conduct joint research, development and/or demonstrations projects on. As a member of the European gas research organization GERG, SGC provides an interna-tional perspective to the development within the Swedish energygas sector.
Results from the SGC projects are published in a report series – SGC Rapport. The re-ports can be downloaded free of charge from our website –www.sgc.se. It is also possible to subscribe to the printed reports. SGC is responsible for the publishing of the reports, whereas the authors of the report are responsible for the content of the reports.
SGC also publishes fact brochures and the results from our research projects in the report seriesSGC Rapport. Brochures can be purchased via the website.
SGC is since the start in 1990 located in Malmö. We are owned by E.ON Gas Sverige AB, Energigas Sverige, Swedegas AB, Göteborg Energi AB, Lunds Energikoncernen AB (publ) and Öresundskraft AB.
Malmö, Sweden 2013
Martin Ragnar
Authors’ foreword
This project, ” Method development for gas quality determination in the LNG stor-age of a LNG/LCNG refuelling station”,has been carried out between September 2012 and September 2013 (with a measurement campaign from May to August 2013). The project has been carried out by SP technical Research Institute of Sweden in collaboration with the project partners. The project has been carried out through a literature survey and a measurement campaign which has been per-formed at Stig’s Center in Gothenburg. During the project, two meetings have been held with the reference group.
The project partners and financiers have been: E.ON GAS Sverige AB
Fordonsgas Sverige AB Scania CV AB
A reference group has been linked to the project consisting of the following per-sons:
Mattias Svensson, SGC (projektkoordinator) Hans Johansson, Fordonsgas Sverige AB Lars Ohlson, Fordonsgas Sverige AB Johan Zakrisson, E.ON GAS Sverige AB Anders Larsson, E.ON GAS Sverige AB
The project report has been written by Karine Arrhenius (main author), Daniel Kühnemuth, Haleh Yaghooby and Lars Ohlson.
Författarnas förord
Detta projekt, ” Mätmetodsutveckling för gaskvalitetsbestämning i en LNG/LCNG-tankstations LNG-lager”, har utförts under perioden september 2012 till september 2013 (mätkampanj från maj till augusti 2013). Huvudutförare har varit SP Sveriges Tekniska Forskningsinstitut, tillsammans med projektpartners nedan. Projektet har bedrivits dels genom litteraturstudier, dels genom mätkampanjer som har utförts vid Fordonsgas LCNG-tankstation på Stigs Center i Göteborg. Under projektarbe-tet har två referensgruppmöten hållits.
Projektpartners tillika finansiärer har varit: E.ON GAS Sverige AB
Fordonsgas Sverige AB Scania CV AB
Till projektet har en referensgrupp funnits knuten bestående av följande personer; Mattias Svensson, SGC (projektkoordinator)
Hans Johansson, Fordonsgas Sverige AB Lars Ohlson, Fordonsgas Sverige AB Johan Zakrisson, E.ON GAS Sverige AB Anders Larsson, E.ON GAS Sverige AB
Projektrapporten har författats av Karine Arrhenius (huvudförfattare), Daniel Kühnemuth, Haleh Yaghooby och Lars Ohlson.
Borås, september 2013
Summary
LNG (liquefied natural gas) is a mixture of low-molecular-weight hydrocarbons with nitrogen as a principal inert impurity and methane as major component. LBG (Liq-uefied Bio Gas) is basically the same as liq(Liq-uefied natural gas but is produced from biogas. The introduction of liquefied gas is an important measure in terms of achieving Sweden’s objective of a reduced environmental impact from road traffic.
To determine the composition of LNG/LBG, it is essential to calculate its proper-ties such as calorific value, density and methane number. It is also important to optimize the operations of LNG/LCNG refuelling stations so as the product deliv-ered fulfills the requirements set to ensure a proper functioning of the LNG-trucks.
The goal of this study has therefore been to develop a sampling and analysis method to determine the quality of the LNG/LBG delivered at LNG/LCNG refuelling stations and to give recommendations to optimize the operations at the stations.
All tests were performed at Fordonsgas LNG/LCNG refuelling station at Stigs Center in Gothenburg from May to August 2013. The station under normal condi-tions delivers LBG to heavy and light trucks. However, from the 2ndto the 28thof August, the tank was filled with LNG. Samples have been taken when the station delivered LBG and LNG respectively and during the transition periods (from LBG to LNG and from LNG to LBG).
Sampling is the most critical point of the LNG/LBG measurement chain. The fluid must be conditioned from its initial state, liquid at low temperature, to a final state, gas at ambient temperature, without partial vaporization or loss of product.
There is currently no standard or document relative to the sampling of LNG/LBG for refuelling stations and the LNG samplers commercially available have been designed for larger installations such as ship-terminals.
Therefore in this project it has been decided to build a home-made sampler for the determination of LNG/LBG composition. This sampler consists of an in-house electrically heated vaporizer and a sampling section. The capability of the sampler to take representative samples of LNG has been tested by comparing the compo-sition obtained experimentally to the expected compocompo-sition of LNG, LBG or mix-tures of those. For this purpose, the in-house vaporizer has been found to work properly even if the heat transfer is not optimal. Before future works with this sam-pler, the heat transfer should be improved.
From the measurement campaigns, it can be concluded that the composition does not significantly vary as the level of fuel in the tank decreases. However, with LBG, the concentration of methane slightly decreases in the liquid phase and in-creases in the gas phase as the level of the LBG in the tank dein-creases. For LNG, a trend showing that ethane concentration in both the liquid and gas phases de-creases while the LNG level in the tank dede-creases could be observed. This obser-vation must be confirmed by new measurements.
The composition of the liquid phase has been found to fulfill the requirements listed SS 15 54 38 for LBG and by CARB (SAE J2699) for LNG regardless of the level of fuel in the tank.
Sammanfattning
LNG (Liquefied Natural Gas) är en blandning av lågmolekylviktskolväten med kväve som huvudsaklig förorening och metan som huvudkomponent. Genom kyl-ning kondenseras den till vätska.
LBG (Liquefied Bio Gas) är i grunden detsamma som flytande naturgas men framställs från biogas.
Gasdrivna fordon innebär sänkta utsläpp av kväveoxider, koldioxid, partiklar samt lägre buller. Dagens konventionella gaslastbilar för komprimerad gas funge-rar utmärkt i städerna men räckvidden räcker inte till för en lastbil i långfärds- eller linjetrafik. Längre räckvidd uppnås genom att använda förvätskligad, det vill säga flytande, fordonsgas. Energiinnehållet per volymenhet för LNG respektive LBG är 590 gånger högre än för CNG respektive biometan vid atmosfärstryck och 2,6 gånger högre jämfört med CNG vid 200 bar. LNG och LBG är därför ett attraktivt alternativ för att bidra till att uppnå Sveriges höga krav på låga utsläpp av förore-ningar och hög utnyttjandegrad av förnybar energi i transportsektorn.
Att bestämma LNG/LBG-sammansättning är viktigt för att kunna beräkna dess egenskaper som densitet, värmevärde och metantal. Detta är väsentligt också för att optimera driften i tankstationer så att den levererade produkten uppfyller de fastställda kraven som säkerställer en bra funktion för de lastbilar som använder bränslet.
Målet med denna studie har därmed varit att utveckla en provtagnings- och ana-lysmetod för att bestämma kvaliteten på den LNG och LBG som levereras vid tankställen. Ett andra mål har varit att ge några rekommendationer för att optimera driften vid stationerna.
Alla tester utfördes vid Fordonsgas LCNG-tankstation vid Stigs Center i Göte-borg från maj till augusti 2013. Stationen levererar under normala förhållanden LBG till lastbilar. Men från och med den 2 augusti till och med den 28 augusti fyll-des tanken med LNG. Prov har tagits på LBG, LNG samt på blandningar
LNG/LBG. Det flytande bränslet lagras i en 61 m3tank som innehåller max 54 m3 LBG vid max 11 bar. Tankens säkerhetventil öppnar på 11,5 bar. LBG levereras i trailer från Lidköping flytande biogasanläggning var 7:e till 10:e dag beroende på hur mycket bränslet som har förbrukats.
Provtagningen är den mest kritiska punkten i LNG/LBG-mätkedjan. Varje steg måste göras utan att ändra sammansättningen. LNG/LBG måste konditioneras från sitt ursprungliga tillstånd, flytande vid låg temperatur, till sitt slutliga tillstånd, gas vid rumstemperatur, utan partiell förångning eller förlust. Det finns i nuläget inga standarder som hänför sig till provtagning av LNG/LBG vid tankstationer. De kommersiella LNG-provtagare som finns har utformats för större installationer som till exempel LNG-terminaler.
Vi har därför i detta projekt beslutat att bygga en egen provtagare för bestäm-ning av LNG/LBG-sammansättbestäm-ning. Denna provtagare består av en egenutvecklad förångare och en provtagningsdel. Förångaren är uppvärmd med ett elektriskt värmeband. Det förångade bränslet når sedan provtagningsdelen där en påse kan kopplas till en ventil. Innehållet i gaspåsar analyseras sedan på labb med gaskro-matografi/ termisk konduktivitetsdetektor och flamjonisationsdetektor med avse-ende på metan, koldioxid, syrgas, kvävgas och kolväten med 2 till 6 kolatomer.
Vätskeprov har tagits vid en ventil lokaliserad mellan LNG/LBG-tanken och pumpen som leder LBG/LNG från tanken till dispensern. Prov togs när stationen var i så kallat ”force mode”. Cirkuleringen av LBG/LNG mellan tanken och pumpen tvingas då fram genom att öppna de två ventilerna mellan dessa.
Gasprov har tagits vid V33-ventilen som är lokaliserad på en av de tre rörled-ningar som finns i toppen på tanken. Eftersom ventilen efter V33 under normaldrift alltid är stängd är denna rörledning fylld med samma gas som den som finns ovanpå vätskefasen av LNG/LBG.
Provtagarens kapacitet att ta representativa prov av LNG/LBG har testats ge-nom att jämföra den experimentellt erhållna sammansättningen med den förvän-tade sammansättningen av LNG, LBG eller blandningar av dem. Exempelvis har prov tagits samma dag som tanken fylldes igen, denna gång med LBG. Det fanns då 4500 kg LNG kvar i tanken. Därmed kunde man beräkna en förväntad sam-mansättning motsvarande 21 % LNG (dess samsam-mansättning har bestämts genom att ta prov före tankning) och 79 % av LBG (dess sammansättning har bestämts tidigare i projektet). Förångarens funktion har därmed visats fungera tillfredsstäl-lande (förväntade halter: metan, 97,9%-vol, etan, 1.1%-vol, propan, 1350 ppmv, isobutan, 70 ppmv, butan, 80 ppmv, pentaner, 16 ppmv, hexaner, 2 ppmv, syrgas, 0,2%-vol och kvävgas, 0.6%-vol, experimentella halter: metan, 97,6%-vol, etan, 1.3%-vol, propan, 1350 ppmv, isobutan, 50 ppmv, butan, 40 ppmv, pentaner, 9 ppmv, hexaner, 1 ppmv, syrgas, 0,2%-vol och kvävgas, 0.7%-vol). Däremot är värmeöverföringen inte optimal eftersom temperaturen efter förångaren mättes till -40°C som kan jämföras med den förväntade temperaturen av +40°C. Före fram-tida arbeten med provtagaren bör värmeöverföringen förbättras.
Resultat visade också att när stabila förhållanden i termer av flöde, temperatur och tryck i provtagaren har uppnåtts, bör man vänta minst 20 minuter med att ta första provet.
Resultat av mätningar utförda när tanken innehöll ren LBG eller ren LNG visar att dess sammansättning inte varierar signifikant när nivån på bränslet i tanken minskar.
Emellertid, för LBG har det noterats att metanhalten minskar något i vätskefasen och ökar i gasfasen när LBG-nivån i tanken sjunker. Metanhalten var 99.0 %-vol när tanken precis var nyfylld och sjönk ner till 97.9%-vol när det kvarstod 1/4 av bränslet i tanken.
För LNG observerades en trend som visar att koncentrationen av etan i både vätske -och gasfas minskar när nivån i tanken sjunker. Tyvärr är underlaget för begränsat för att dra slutsatser och denna observation måste bekräftas med nya mätningar.
Sammansättningen av den flytande fasen har befunnits uppfylla de krav som anges i SS 15 54 38 för biogas (LBG) och av CARB ( SAE J2699 ) för LNG oav-sett bränslenivån i tanken.
En annan slutsats är att LNG och LBG blandas snabbt i tanken vid byte av bränslekvalitet. Bara en till två timmar efter påfyllning av tanken, har sammansätt-ningen av vätskefasen befunnits vara i god överensstämmelse med den förvän-tade sammansättningen av LNG/LBG- blandning i sina respektive andelar.
Innehåll
1. Background ... 12
1.1 Analytical methods to analyse LNG/LBG ... 14
1.2 Methods to sample LNG ... 15
1.3 Calculation of LNG properties from the composition... 17
2. Experimental ... 20
2.1 Sampling place ... 20
2.2 LBG/LNG sampler... 23
3. Results and discussion... 27
3.1 Effectiveness of the heating cable ... 27
3.2 Reproducibility of the results for the determination of the composition ... 27
3.3 Effect of outlet gas flow on the composition determined with the sampler .. 29
3.4 Monitoring of transition period in tank from LBG to LNG... 30
3.5 Monitoring of transition period in tank from LNG to LBG... 31
3.6 Influence of the level of LBG in the tank on the LBG composition ... 32
3.7 Influence of the level of LNG in the tank on the LNG composition... 35
4. Conclusions... 38
5. Tack ... 40
1. Background
LNG (liquefied natural gas) is a mixture of low-molecular-weight hydrocarbons with nitrogen as a principal inert impurity and methane as major component. Minor-component concentrations vary with the source of the raw gas, the liquefaction pre-treatment, the liquefaction process and the storage conditions.
LBG (Liquefied Bio Gas) is basically the same as liquefied natural gas but is pro-duced from biogas. Consequently, the liquefied biogas and liquefied natural gas are miscible and can be used the same way [1].
Gas in liquid form has a very high distribution capacity as the energy content per unit of volume for liquid gas is 590 times higher than for gas at atmospheric pres-sure and 2.6 times higher than for compressed gas at 200 bar [1].
LNG/LBG can be used [2]:
in the European gas grid as a backup to cover peak loads in distribution. in industry as a replacement for fossil fuels, especially oil.
as a fuel for heavy transport to partly replace diesel. as propulsion fuel within maritime shipping,
and may also be used for air separation, production of liquid carbon dioxide and cooling for food industry processes.
Used as an automotive fuel, LNG/LBG must be stored inside on-board cryogenic tanks (vacuum-isolated stainless-steel vessels) which can have different operating pressure ranges.
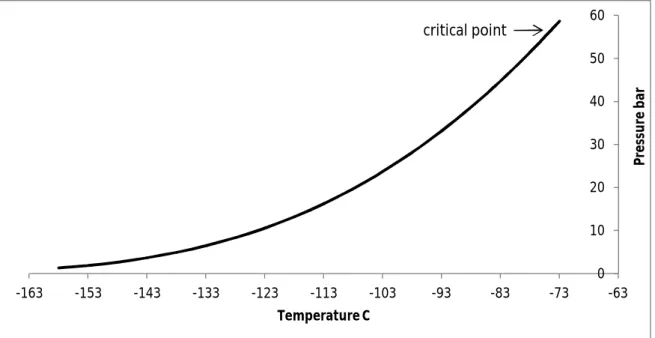
For a given composition, the prevailing pressure and temperature conditions will determine if the fluid state is all liquid (single-phase), all gas (single-phase) or gas-liquid (two-phase). Consequently, in order to understand how LNG/LBG should be stored, it is necessary to study the phase behavior (P-V-T data) of the fluid as shown on Figure 1.1 for pure methane [3]. LNG contains fractions of ethane and propane etc and as a result its phase diagram is different from that of pure me-thane.
Pure liquefied methane boils at -162°C at ambient pressure.
Instead of a vapor pressure curve, an LNG mixture has a phase envelope con-sisting of a bubble point curve and a dew point curve as illustrated in Figure 1.2. The envelope represents a thermodynamic boundary separating the two-phase conditions (inside the envelope) from the single-phase region (outside). The dew point curve (where the transition from two-phases to single-gas occurs) and the bubble point curve (where the transition from single-liquid to two-phase occurs) meet at the critical point.
The critical point for a multicomponent mixture is referred to as the state of pres-sure and temperature at which all intensive properties of the gas and liquid phases are equal.
The cricondenbar ,B is defined as the maximum pressure above which no gas can be formed regardless of temperature.
The cricondentherm, T, is defined as the maximum temperature above which liquid cannot be formed regardless of pressure.
Figure 1.1:Phase behaviour of pure methane 0 10 20 30 40 50 60 -163 -153 -143 -133 -123 -113 -103 -93 -83 -73 -63 Pr es su re ba r Temperature C critical point Methane, 84%-vol Ethane, 12%-vol Propane, 3%-vol n-Butane, 1%-vol
Liquid Liquid+gas Gas
Dew point Bubble point Critical point
Figure 1.2: LNG mixture phase envelope
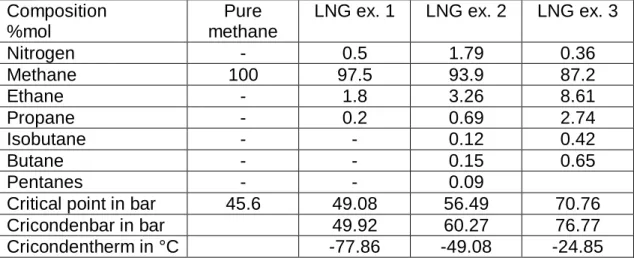
Examples of values for B, C and T for three LNG compositions are given in standard ISO 12838 [4], see table 1.1.
Table 1.1: Values for B, C and T for three LNG compositions Composition
%mol
Pure methane
LNG ex. 1 LNG ex. 2 LNG ex. 3
Nitrogen - 0.5 1.79 0.36 Methane 100 97.5 93.9 87.2 Ethane - 1.8 3.26 8.61 Propane - 0.2 0.69 2.74 Isobutane - - 0.12 0.42 Butane - - 0.15 0.65 Pentanes - - 0.09
Critical point in bar 45.6 49.08 56.49 70.76
Cricondenbar in bar 49.92 60.27 76.77
Cricondentherm in °C -77.86 -49.08 -24.85
Determining the LNG/LBG composition is essential for a number of reasons [5]:
To calculate LNG/LBG properties as density and the calorific value, me-thane index. In a custody transfer of LNG, it is common practice to deter-mine the quantity transferred on a calorific-content basis. The total calorific content of quantities of LNG is determined by the liquid volume, the liquid density and gross calorific value of the LNG delivered
To study how the LNG quality evolves through different operating modes: as example during periods of high consumption of the stored LNG, during periods with low consumption of the stored LNG
To determine how a refuelling mixes with the storage tank’s current content.
To check for possible contaminants in the LNG which is a concern because it may have safety and reliability consequences in relation to LNG transfer system, sampling system and analytical instruments, systems and equip-ment exposed to vaporized LNG
1.1 Analytical methods to analyse LNG/LBG
Most of the analysis methods to determine the composition of LNG/LBG are based on gas chromatography (GC) together with different detectors, often a combination of a thermal conductivity detector (TCD) with a flame ionization detector (FID).
As LNG/LBG will be analysed after vaporization, the standards applying for CNG/biogas apply also for LNG/LBG.
ISO 6974 [6] “Natural gas -- Determination of composition with defined uncertainty by gas chromatography” is composed of 6 parts where parts 3 to 6 describe differ-ent set of chromatographic columns that can be used to determine hydrogen, heli-um, oxygen, nitrogen, carbon dioxide and hydrocarbons up to C8.
1.2 Methods to sample LNG
Sampling is the most critical point of the LNG/LBG measurement chain. Every step must always be taken without changing its composition.
It is therefore necessary to condition the fluid sampled from its initial state, liquid at low temperature, to a final state, gas at ambient temperature, without partial vapor-ization or loss of product.
If the LNG/LBG begins to vaporize uncontrolled, the nitrogen and methane may boil off first, producing pockets of gas in the liquid stream resulting in varying com-positions. The liquid sample is then rich in heavier components together with va-pours rich in methane (and possibly nitrogen).
If LNG/LBG doesn´t fully vaporize, the heaviest compounds may remain as liquid while the lightest compounds are vaporized resulting in a non-representative sam-ple.
There is no standard or document relative to the sampling of LNG/LBG for refu-elling stations. But some standards or articles are available describing how to sample LNG as for example when LNG is transferred between LNG ships and LNG terminals.
LNG Custody Transfer Handbook, GIIGNL[5] is a reference manual describing
the procedures and equipment available to determine the energy quantity of LNG transferred between LNG ships and LNG terminals. Although it may contain useful information, it is not specifically intended to work out procedures for ship-to-ship LNG transfer, custody transfer for LNG carriers with type C cargo tanks (IGC Code) or overland LNG custody transfer operations involving LNG trucks or trains.
In this handbook, three methods of sampling are considered:
Continuous sampling of LNG with continuous sampling of regasified LNG
Continuous sampling of LNG with discontinuous sampling (also called in-termittent) of regasified LNG
Discontinuous sampling of LNG also called Spot sampling
Spot sampling:
An appropriate quantity of LNG is injected in a purged and cooled chamber. The chamber is thus partially filled with LNG, and then isolated. The LNG sample is then brought to ambient temperature and vaporizes. Thus the regasified LNG fills the whole volume of the chamber which is designed to withstand the correspond-ing pressure increase. Gas samples are then withdrawn from the chamber via pressure reducing valves to fill gas sampling bottles.
Continuous sampling of regasified LNG:
LNG is continuously collecting during the loading/unloading operation from the main LNG flow line by continuous vaporization. A part is continuously stored in a gasholder.
LNG is also continuously collecting during the loading/unloading operation from the main LNG flow line by continuous vaporization. But this time, the regasified LNG is sampled at specified intervals.
For these two methods, the sampler consists of:
A sampling probe
A vaporizer and its control devices
A transfer line between the sampling probe and the vaporizer
And a system to sample the gas or a system to transfer the gas to a gas analyzer.
All these elements need to fulfill special requirements.
The sampling probe and the transferline shall be such as to ensure that total and continuous vaporization of a quantity of LNG occurs in the vaporizer and not par-tially before. For this purpose, LNG must be kept below its boiling point at a given temperature (LNG is then in a sub-cooled condition). How to calculate the degree of sub-cooling is well described in ISO 8943 [7].
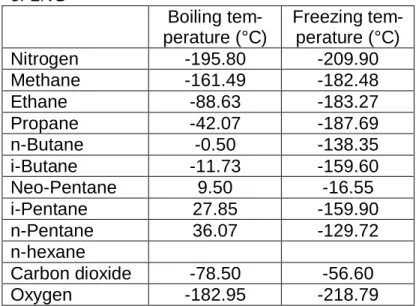
The vaporizer (electric or water or steam) must be designed in order to avoid fractionation. To that effect heating to a sufficiently high temperature ( 50°C or more but not less than 20°C at a suitable flow) is required to ensure immediate vaporization of even the heaviest trace components. In table 1.2 the boiling points for the most common compounds in LNG are reported:
Table 1.2: Boiling temperature and freezing temperature for the main compounds of LNG Boiling tem-perature (°C) Freezing tem-perature (°C) Nitrogen -195.80 -209.90 Methane -161.49 -182.48 Ethane -88.63 -183.27 Propane -42.07 -187.69 n-Butane -0.50 -138.35 i-Butane -11.73 -159.60 Neo-Pentane 9.50 -16.55 i-Pentane 27.85 -159.90 n-Pentane 36.07 -129.72 n-hexane Carbon dioxide -78.50 -56.60 Oxygen -182.95 -218.79
The vaporizer control devices allow supervision of the condition of vaporization, protecting the equipment and insuring safety. It shall include devices to monitor and read pressures, flows (gas), and temperatures and other devices to ensure safety (in case of too high pressure, too high or too low temperature), to prevent retro-diffusion and to ensure gas homogeneity.
During sampling it is essential that the process conditions of the sampling sys-tem (flow sys-temperature and pressure) remain in a stable and stationary condition. Sudden changes in gas off-take (for example due to the opening of a valve or the removal of a sample cylinder) that will affect the gas flow should be avoided at all times.
Standard ISO12838:2000[4] specified the tests to be carried out in order to
as-sess the suitability of LNG sampling systems. The accuracy of a LNG sampling system shall be determined by comparing density and gross calorific value that are obtained from the LNG composition determined with the sampling system to be tested together with density and gross calorific value that are obtained from the composition determined with a sampling system allowing supercritical
regasification of LNG.
Companies that can provide systems compliant to ISO 8943 standard and guide-lines described in the GIIGNL-LNG Custody Transfer Handbook[5] have been con-tacted. They could not provide solutions for the application covered by this project and within the budget of the project. Moreover, taking into account all the elements that are required in these sampling systems, it would be almost impossible to transport the sampling system to another site which is also a goal of this project.
1.3 Calculation of LNG properties from the composition
Once the LNG composition has been determined, some properties as methane number, density and calorific value can be calculated from the composition.
1.3.1 Methane number
The methane number is the measure of resistance of a gas fuel to knock. A fuel's methane number consequently describes how likely it is to combust uncontrollably.
It is assigned that pure methane is used as the knock resistant reference fuel. Thus, the methane number of pure methane is 100. Pure hydrogen is used as the knock sensitive reference fuel, thus the methane number of pure hydrogen is 0.
There are two common ways [8] to calculate the methane index, the CARB/GRI method and the AVL method.
CARB/GRI
Linear coefficient relation
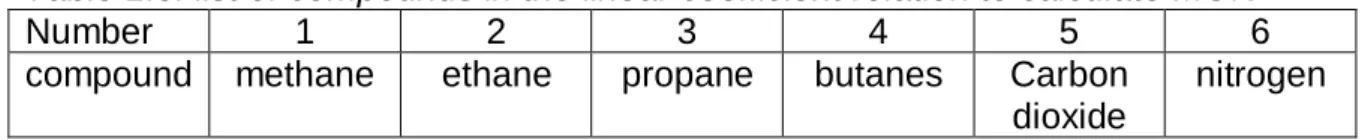
MON = 137.78 x1+ 29.948 x2– 18.193 x3– 167.062 x4+ 181.233 x5+ 26.994 x6 Where x is the mole fraction of compounds as followed (table 1.3):
Table 1.3: list of compounds in the linear coefficient relation to calculate MON
Number 1 2 3 4 5 6
compound methane ethane propane butanes Carbon dioxide
nitrogen
Hydrogen/carbon ratio relation
MN=1.445MON-103.42
If the mole fraction of a natural gas fuel is known, MN can be calculated. Since there are two equations for MON, two MNs of the gas can be calculated. The two results should both be reported in the calculation report.
If the difference between the two MN results is more than 6, the user should consider that the two MNs are in doubt, and a test method such as AVL method should instead be utilized to determine MN for the gas.
If the difference between the two MNs is more than 10, then this is extraordinary. For example, the gas may be diluted by LPG gas, or the gas may contain more nitrogen or CO2.
AVL method
The AVL method uses a proprietary program to calculate methane number. From the experimental results, a procedure was developed to predict the methane num-ber of a natural gas using the chemical composition of the gas. The procedure in-cludes several steps: by first neglecting the inert gases, the methane number of the reduced gas is calculated with methane number diagrams. Finally, the influ-ence of inert gases is taken into account by using other diagrams.
DGC (Dansk Gasteknik Center)[9] has developed an algorithm for the methane number determination for natural gasesbased on the AVL studies. This algorithm also determines the methane number (MN) for a gas in two steps. First, the me-thane number for the gas free of inert gases is determined, then the contribution from the inert gases.
1.3.2 Density
A variety of calculation methods exist [5,10,11] such as:
State equations in their integral form
Method of extended corresponding states
Hard sphere model method
Watson method
Elf-Aquitaine method
Graphic method of RC MILLER
HIZA method
Revised KLOSEK-McKINLEY method
The GERG 2004 – GERG 2008 equations
The revised KLOSEK-McKINLEY method In LNG custody transfer handbook,
the preferred method is the revised KLOSEK-McKINLEY method, which only re-quired the LNG temperature and composition to be taken into account.
The method is limited to LNG where methane concentration is over 60%, the sum of isobutane and butane concentration is less than 4%, the sum of isopentane and pentane concentration is less than 2% and the nitrogen concentration is less than 4%-vol. The temperature shall be less than -158°C (???).
The density of LNG is calculated as: ܦேீ = ெ ೣ
Mmix: Molecular weight of the mixture =∑ݔ.ܯ xi: molar fraction of component i
Mi: Molecular weight of component i
Vmix: molar volume of the mixture expressed in l/mol Vmix=∑ݔܸ− [݇ଵ+(k2-k1).(.ସଶହ௫ಿ మ))].ݔுర
Vi: volume of the component i at the temperature of the LNG k1, k2: correction factors
Equations of state GERG-2004 and GERG-2008
The two equations of state, GERG-2004 and GERG-2008, have the same form. The only difference is that the summations are performed up to N= 18 for GERG-2004 and up toN= 21 for GERG-2008, the three added compounds being n-nonane, n-decane and hydrogen sulfide.
They are valid for wide ranges of temperature, pressure and compositions and also covering the gas phase, the liquid phase, and the supercritical region).
A software package that enables to calculate several thermodynamic properties in the homogeneous gas, liquid, and supercritical regions is available at a price of around 5000 euros [12].
1.3.3 Calorific value
The gross calorific value can be determined [5]:
by measurement with calorimeters,
by computation on the basis of the composition of the gas and the refer-ence data.
When basing the calculation on the composition, the volumetric gross calorific val-ue, GCVvolis calculated by one of the following formula [5]:
GCV୴୭୪= ∑ଡ଼∑ୋେଡ଼. (ౣ ౢ ) or GCV୴୭୪= ∑X୧GCV୧(୫ ୭୪).ୖ. (ideal gas)
ܩܥܸ௩= ∑(∑ீ.ெ (ೡ).) (real gas)
Xi: Molar fraction of component I obtained from composition GCVi(mol):molar gross calorific value of component i (kJ/m3) GCVi(vol): volumetric gross calorific value of component I MVi: molar volume of component i (m3/vol)
Pv, Tv: gas volume metering conditions R: molar gas constant (8.314510 J/mol/K)
Z: compressibility factor of the gas mixture (can be calculated from composi-tion, see ISO6976 [13])
2. Experimental 2.1 Sampling place
All tests were performed at Fordonsgas LNG/LCNG refuelling station at Stigs Cen-ter in Gothenburg. The station has been in operation since the 1stof October 2010. The station delivers liquefied biomethane to heavy and medium duty trucks.
The liquefied biomethane is stored in a 61m3 tank (max filling 54 m3) at max 11 bar. The tank is filled with LBG (since summer 2012) delivered by trucks from Lidköping liquefied biogas plant approximately every 7 days (depending on how much LBG has been used). However, at one occasion (in Mars 2013) a trailer which had been used to transport LNG was used to transport LBG to the station. Consequently, some LNG may have entered the tank at that occasion. Moreover, in the middle of the summer as the LBG produced was too warm, the tank was filled with LNG (from the 2st of august until the 28th of august, three fillings in all). From the 28thof august, the tank was again filled with LBG.
Before the filling of a truck’s tank can be started, two conditions must be fulfilled: the pump leading the LBG from the tank to the dispenser must be cooled to at least -75°C (can take up to 20 minutes) and the dispenser must be cooled at -100°C (takes about 2 minutes). There are two ways to start the cooling of the pump. The first way is when clients press the start button on the dispenser, the process of cooling the pump starts. The cooling of the pump can also be started with a timer so the waiting time for clients before filling starts is significantly re-duced.
In both cases, if no other filling occurs, the pump/ station goes back to standby mode after 20 minutes.
Sampling of liquid phase LBG has consistently been performed at the V66 valve (as described in Figures 2.1, 2.2, 2.3, 2.4) which is located between the LBG tank and the pump. In order to minimize the heat transfer to the tank, the pump opera-tion is minimized. The staopera-tion is normally in standby mode as shown on Figure 2.1 and the pump is only cooled down when clients are about to tank.
Figure 2.1: standby mode on the station
HV41 V66 HV40 V65 pump off T202 dispenser
Figure 2.2: “Cooling of the pump“ mode
Figure 2.3: “filling” mode
During the first sampling occasions (30thof January 2013, 14th of Mars 2013, 22th of May 2013), the sampling was planned to be performed during the cooling mode. But it was not possible to hold the pump on for more than 30 minutes. For this rea-son, some samples were also taken during the standby mode.
Valve HV41 can also be controlled manually as shown in Figure 2.4:
Figure 2.4: Mode “force”
HV41 V66 HV40 V65 pump on T202 dispenser HV41 V66 HV40 V65 pump on T202 dispenser HV41 V66 HV40 V65 pump off T202 dispenser
25thof June 2013 until the end of the project were taken in this mode, called here forced mode. The flow between the tank and the pump is probably lower in the forced mode than the flow during the cooling mode but enough for the sampling to be performed.
The quantity of LNG/LBG and the pressure in the tank can be read from the con-trol panel. In the beginning of the project, the LBG quantity was expressed in m3. From the middle of June 2013, the LBG quantity is expressed in kg. When using the reading of quantity in the tank in m3, the density in the system was set at 423 kg/m3(value for natural gas).
Sampling occasions:
Samples have been taken at 14 occasions as described in table 2.1
The minimum level of LBG in the tank is 3000 kg (11.6%) and the maximum level is 22800 kg (88.5%).
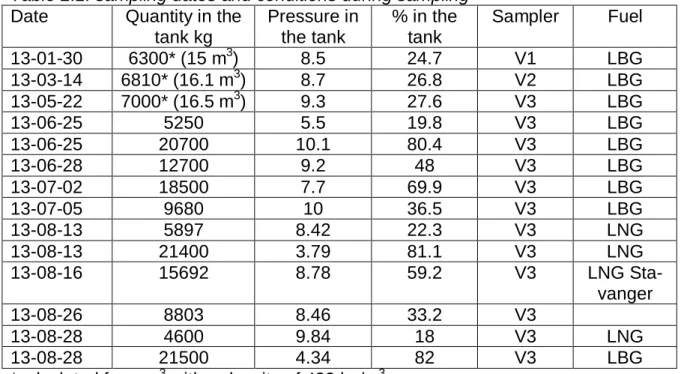
Table 2.1: sampling dates and conditions during sampling Date Quantity in the
tank kg Pressure in the tank % in the tank Sampler Fuel 13-01-30 6300* (15 m3) 8.5 24.7 V1 LBG 13-03-14 6810* (16.1 m3) 8.7 26.8 V2 LBG 13-05-22 7000* (16.5 m3) 9.3 27.6 V3 LBG 13-06-25 5250 5.5 19.8 V3 LBG 13-06-25 20700 10.1 80.4 V3 LBG 13-06-28 12700 9.2 48 V3 LBG 13-07-02 18500 7.7 69.9 V3 LBG 13-07-05 9680 10 36.5 V3 LBG 13-08-13 5897 8.42 22.3 V3 LNG 13-08-13 21400 3.79 81.1 V3 LNG 13-08-16 15692 8.78 59.2 V3 LNG Sta-vanger 13-08-26 8803 8.46 33.2 V3 13-08-28 4600 9.84 18 V3 LNG 13-08-28 21500 4.34 82 V3 LBG
*calculated from m3with a density of 423 kg/m3
Sampling of the gas phase in the tank is performed at V33 valve from one of the three pipes connected at the top of the intern tank. This pipe is the one used for the top-filling of the tank. Under normal operational parameters, the valve V2 (fig-ure 2.5) is closed and the press(fig-ure everywhere in the pipe is the same as the pressure of the gas phase in the tank. When a top-filling is performed, the V2 is opened. Otherwise, as V2 is closed, the pressure inside the pipe from the tank to V2 is at the same pressure than the tank. In order to take a representative sample of the gas phase in the tank, it is necessary to flush the pipe.
Figure 2.5: Sampling point for the gas phase
2.2 LBG/LNG sampler
All the parts used for the LNG/LBG sampler must be ATEX-certified (the certifica-tion for equipment intended for use in explosive atmospheres). The refuelling sta-tion has been divided into zones with respect to the ATEX directives. The area under the tank is classified as a zone 2 (an area in which an explosive mixture is not likely to occur in normal operation and if it occurs it will exist only for a short time) while other areas of the refuelling stations are classified as zone 1 (an area in which an explosive mixture is likely to occur in normal operation).
The first tests were performed on the 30th of January 2013 and on the 14th of March 2013. The goal of these tests was to learn about the refuelling station, the sampling points and how to take LNG/LBG samples safely. The samplers V1 (30th of January) and V2 (14thof mars) had no “vaporizer” and no reading for gas flow or temperatures. The LBG was consequently vaporized inside the metal hose (2 m long the 30th of January and 4 m long on the 14th of Mars). The results obtained during these two sampling occasions clearly highlighted the need to work under more controlled conditions. Consequently, the sampler V3 was equipped with a simple in-house vaporizer, reading for temperatures at the sampling point and af-ter the in-house vaporizer, flow-meaf-ter (rotameaf-ter) to measure the gas flow afaf-ter vaporization.
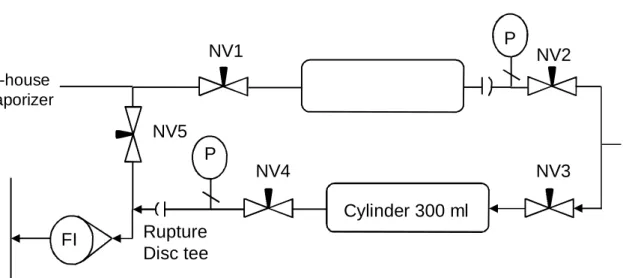
The sampling point has a 3/8” R connection. The sampler V3 consists of:
An in-house vaporizer
A by-pass section
A sampling section
The in-house vaporizer consists of (figures 2.6 and 2.7):
A 2 meter long FM4 metal hose (316L), with 6 mm end connections
A 7 m ATEX certified heating cable (40FSS2-CF, Backer) connected to a Bottom-filling V33 Safety valve Top-filling HV2 Trailer
Another 2 meter long FM4 metal hose (316L)
Figure 2.6: Picture of vaporizer connected to V66
Figure 2.7: Scheme of vaporizer
To ensure vaporization of even the heaviest trace components, it is recommended [5] to heat to a sufficiently high temperature, e.g. 50°C or more but not below
Heated 2m long metal hose T Refuelling station L N G /L B G p ip e V66 T
20°C. Suitable sample flow rates [5] with electrically heated vaporizers are report-ed to be about 1500 l/h (25 l/min).
The heat input required to vaporize and heat the gasified LNG from the tempera-ture in the tank (T LNG in tank) to a desired temperature (Tgas) is the sum of the heat needed to heat the liquid LNG to its vaporization temperature (Tevap), the heat needed to vaporize the LNG/LBG and the heat needed to heat the gasified LNG to the desired temperature according to the following equation (heat transfer formu-la):
Q = m*[cp(liquid)*(Tevap– TLNG in tank) + Δhevap+ cp(gas)*(Tgas– Tevap)] m is the mass flow rate of fluid
Cp is the specific heat of fluid at constant pressure
∆T is the change in temperatures between inlet and outlet of the fluid
Δhevapis the enthalpy of vaporization, also known as the heat of vaporization The heat input has been roughly evaluated to be 210 W based on an outlet tem-perature of 40°C, a gas flow of 18 l/min (and a LNG density of 420 kg/m3) , a evaporation enthalpy of 530 kJ/kg [14] and a specific heat (for both gas and liquid) of 2.1 kJ/(kg·K) [15].
A 7m long heating cable from Backer AB (classified for zone 2) delivering a max-imum of 40 W per meter has been used in this study. The resulting heat-input is then 280 W (max.) under optimal heat transfer conditions.
The heating cable is winded around the first metal hose and isolated with miner-al wool. One probe is placed at the sampling point (after the V66) and one probe is placed at the end of the heated metal hose. In this way, it is possible to measure temperature before and after the in-house vaporizer in order to control its effect. At the end of the in-house vaporizer, the gasified LNG/LBG passes through another 2 meter long metal hose before reaching the sampling section.
After the vaporizer, a union tee allows the gas to either reach the by-pass sec-tion or the sampling secsec-tion.
These two sections consist of:
A union tee
Five needle valves, 1/4 in. Male NPT (SS-3NKRM4)
Two 316L SS Double-Ended DOT-Compliant Sample Cylinder, 1/4 in. FNPT, 300 cm3, 344 bar (316-50DF4-300)
Two 316L Stainless Steel Rupture Disk Tees, 1/4 in. Male NPT x 1/4 in. Female NPT, 130 bar (SS-RTM4-F4-1)
Two Pressure gauges
A Brass low-flow metering valve
Figure 2.8: experimental set-up, sampling part
When starting sampling, the gasified LBG/LNG should pass through the by-pass section in order to control that the LBG/LNG is fully gasified coming out from the in-house vaporizer. In that way, droplets of LBG/LNG cannot reach the sampling section where they could expand 600 times by vaporization. To by-pass, the nee-dle valves NV1 and NV4 are closed while NV5 is opened.
When it has been controlled that the LBG coming out from the vaporizer is gasi-fied, the needle valve NV5 is closed and needle valves NV1 and NV4 are opened to flush the sampling section.
To take a sample, a gas-tight bag can be connected to the low-flow metering valve (easiest way) while gasified LBG/LNG flows through the sampler or could be sampled in the second cylinder by closing NV3 and NV4.
NV1 NV2 Brass low-flow mete-ring valve P Refuel-ling station FI rotameter Rupture Disc tee NV4 Cylinder 300 ml NV3 P NV5 In-house vaporizer
3. Results and discussion
3.1 Effectiveness of the heating cable
The effect of the heating cable on the outlet temperature of the vaporizer has been evaluated at three different gas flows. The results are presented in Table 3.1: Table 3.1: Effect of the heating on the outlet and inlet temperatures of the vaporiz-er
Outlet Gas flow About 4 l/min About 18 l/min About 35 l/min
Heat off on off on off on
T inlet (T1) Not measured -70 -110 -110 -130 -130 T outlet (T2) Not measured 20 -90 -40 -130 -130
The results indicate that heating has a positive effect on the outlet temperature up to at least 20 l/min. The effect is less pronounced than what has been calculated at a gas flow of 18 l/min (expected outlet temperature about 40°C). This can be explained by the fact that the heat transfer is not optimal. One of the possible rea-sons is the difficulty to optimally wind the heating cable around the metal hose. However, the use of the heating cable facilitates the sampling, as the valves being at ambient temperature are easier to handle.
This first test shows clearly that it would have been necessary to add before the vaporizer a butterfly valve directly connected to valve. When cold LNG has passed through the existing valve at V66, this valve becomes difficult to handle and the regulation of the outlet gas flow at desired values is really challenging.
3.2 Reproducibility of the results for the determination of the composition
In order to evaluate if the sampler allows determining the composition of LNG without changing its composition, it is first necessary to control that several sam-ples taken under the same conditions will give reproducible results.
To test this assumption, 6 samples were taken with five minutes interval (at a gas flow of 20 l/min). The results are presented on Table 3.2 and on figures 3.1 and 3.2.
Table 3.2: Reproducibility tests for the determination of the liquid phase
Units Sample 1 Sample 2 Sample 3 Sample 4 Sample 5 Sample 6
Nitrogen %-vol 0.3 0.3 0.3 0.3 0.3 0.3 Methane %-vol 93.7 92.5 92.7 92.4 92.2 92.4 Ethane %-vol 5.7 6.4 6.1 6.4 6.4 6.4 Propane ppm-vol 2630 7560 8000 7990 9150 8320 Isobutane ppm-vol 40 390 500 390 520 530 Butane ppm-vol 45 440 640 470 630 630 Pentanes ppm-vol 25 50 180 95 160 140
Figure 3.1: Ethane, propane (left axis) and methane (right axis) concentrations vs time since the optimized conditions for sampling are reached
Figure 3.2: Isobutane, Butane, Pentanes and hexanes concentrations vs time since the optimized conditions for sampling are reached
80 82 84 86 88 90 92 94 96 0 1 2 3 4 5 6 7 8 9 10 0 5 10 15 20 25 30 35 %-vol Methane %-vol Ethane propane minutes Ethane Propane Methane stabilisation time 0 100 200 300 400 500 600 700 800 900 1000 0 5 10 15 20 25 30 35 pp m -v ol minutes Isobutane Butane Pentanes Hexanes
stabilisation time The pump to CNG delivery switched off between
The results show that once the optimized conditions for the sampling are reached, 15 minutes stabilization time is needed before the sampling can be performed. Then by taking at least 4 samples and removing the eventual outsiders, relative standard deviation better than 15% can be achieved for all compounds as shown on Table 3.3.
Table 3.3: Average and relative standard deviation for the determination of individ-uals components of the liquid phase:
Units Average Samples 3 to 6 Rel. stan-dard deviat-ion in % Nitrogen %-vol 0.3 10 Methane %-vol 92.4 0.2 Ethane %-vol 6.3 2.5 Propane ppmv 8370 6.5 Isobutane ppmv 490 13 Butane ppmv 590 14 Pentanes ppmv 160 13 Hexanes ppmv 28 7
To work with stable parameters in the LNG sampler (stable outlet gas flow leads to stable T1 and T2) has been found to be crucial. On one occasion, as the V31 was cooled by LNG flowing through it (tests at lower flows were first performed), it was difficult to regulate the gas flow at the setpoint of 20 l/min. When stable parame-ters were finally reached, the results of the determination of individual components in the liquid phase and even after 15 minutes stabilization time were found to be varying from sample to sample when sampling every 5 minutes (rel. standard de-viation of more than 70%).
With these results, it can be concluded that to perform the sampling in the opti-mal conditions, the vaporizer should be heated up before opening valve V31. Valve V31 should then be opened carefully so that the gas flow is set to be 16 ± 3 l/min. When the temperatures T1 and T2 are becoming stable, the gas flow will have increased to the intended 20 ± 3 l/min.
3.3 Effect of outlet gas flow on the composition determined with the sampler
In order to determine if the optimized conditions for the sampling are the one pre-dicted by theoretical calculations (outlet gas flow of 20 l/min), tests have been per-formed where the outlet gas flow has been increased and decreased from the op-timized conditions. The results of the composition of the liquid phase are present-ed in table 3.4.
Table 3.4: Effect of the outlet gas flow in the LNG composition determined with the sampler Flow l/min 0.75 17 33 M 21500* 15700 15700 units Average rel. Stdev Average rel. Stdev Average rel. Stdev Methane %-vol 98.0 0 92.4 0.2 94.7 0 Ethane %-vol 1.2 8 6.35 2.5 4.7 5 Propane %-vol 0.028 5 0.84 6.5 0.31 7 Butane %-vol 0.001 6 0.05 13 0.006 2 Isobutane %-vol 0.001 12 0.06 14 0.005 11 Pentanes %-vol 0.001 49 0.02 13 0.001 66 Hexanes %-vol 0.000 18 0.003 7 0.001 142 Nitrogen %-vol 0.8 18 0.3 10 0.3 17
*the results at low flow have been obtained at a different level of filling in the tank but the results are consid-ered to not significantly being influenced by the level in the tank.
The results obtained with an outlet gas flow of 17 l/min are consistent with the ex-pected LNG composition (methane typically 88-93vol, ethane 5-7
%-vol).Working at both too low and too high flows result in the discrimination of hy-drocarbons other than methane. At high flow, the LNG will not fully vaporize in the vaporizer (outlet temperature -130°C, see table 3.1), the heaviest hydrocarbons may thus remain in the liquid state when reaching the sampling part.
At low flows, the LNG begins to vaporize even before it reaches the vaporizer (inlet temperature -70°C, see table 3.1). This is due to the fact that the section be-tween the sampling point and the inlet of the vaporizer is not sufficiently isolated. This section includes V66 which needs to be maneuvered during sampling. As a consequence, the gasified LNG will be richer in methane and nitrogen (which boil first) when reaching the sampling part.
In the following tests, the parameters have been set so as to let the outlet gas flow be 20 ± 3 l/min. The temperature T1 (inlet of the vaporizer) has then been measured to be around -110 ± 10°C, the temperature T2 (outlet of the vaporizer) has been measured to be around -30 ± 10°C.
3.4 Monitoring of transition period in tank from LBG to LNG
Samples have been taken the same day the tank was filled with LNG. As it was the second time the tank was filled with LNG, it was expected that the tank would still contain 1/16 of LBG. The theoretical composition of the LNG in the tank is thus expected to be 1/16 of LBG and 15/16 of LNG (Table 3.5).
Table 3.5: LNG composition given by the provider, experimentally determined and calculated from 15/16 of LNG and 1/16 of LBG
Units LNG com-position given by the supplier LBG compo-sition when the tank is almost emp-ty* Expected composition in the tank (15LNG + 1LBG) Experimental Results Methane %-vol 92.1 97.9 92.5 92.9 Ethane %-vol 6.7 6.3 6.0 Propane %-vol 0.74 0.69 0.64 Isobutane %-vol 0.04 0.037 0.028 Butane %-vol 0.05 0.047 0.029 Pentanes %-vol 0.02 0.019 0.010 Hexanes %-vol 0 0 0.007 Nitrogen %-vol 0.35 1.6 0.4 0.4 syrgas % 0.5 0.03 <0.1
*results from table 3.7.
The results of experimental determination of the composition in the tank and the expected calculated composition are in good agreement showing that the sampler allows taking representative samples of the LNG in the tank.
3.5 Monitoring of transition period in tank from LNG to LBG
Samples have been taken the same day the tank was filled again with LBG. As it was 4500 kg LNG left in the tank, it was expected that the tank would still contain around 1/5 of LNG mixed with LBG.
The results (Table 3.6) show that there is good agreement between the compo-sition determined experimentally and the expected calculated compocompo-sition for a mixture of 21% LNG and 79% LBG. This in turn indicates that the sampler allows taking representative samples of the LBG/LNG in the tank.
Table 3.6: LNG composition determined with the sampler before the filling of the tank, LBG/LNG composition determined with the sampler after filling and theoreti-cal composition for a mixture 21%LNG/79% LBG
Ex-pected LBG compo-sition* LNG compo-sition before filling Rel. stdev % Fuel com-position efter refu-elling Rel. stdev % theoretical composition (21%LNG -79% LBG) Fuel kg 17200 4500 Methane %-vol 99.1 93.3 0.2 97.6 0.2 97.9 Ethane %-vol - 5.4 4 1.3 12 1.1 Propane ppmv - 6500 2 1350 31 1350 Isobu-tane ppmv -340 8 50 23 70 Butane ppmv - 380 11 40 14 80 Pen-tanes ppmv -76 14 9 27 16 Hexanes ppmv - 10 14 1 52 2 Oxygen %-vol 0.25 <0.1 - 0.2 <1 0.2 Nitrogen %-vol 0.65 0.5 <1 0.7 <1 0.6
*results from table 3.7.
From these results, it can also been concluded that LNG and LBG are rapidly mixed in the tank as in both cases (transition LBG to LNG and transition LNG to LBG), the sampling was performed less than 2 hours after the tank was filled with another fuel quality.
3.6 Influence of the level of LBG in the tank on the LBG composition
The influence of the level of LBG in the tank on the LBG composition has been studied by taking samples with 6 different levels of LBG in the tank. The results are presented in table 3.7 (in the liquid phase) and in table 3.8 (in the gas phase) as well as in figures 3.3 (methane), 3.4 (nitrogen), 3.5 (oxygen) and 3.6 (hydro-gen).
Table 3.7: Results for the determination of individual components in the liquid phase vs the level of LBG in the tank
Refuelling date Unknown 16 may 25 jun 25 jun 1 jul? 25 jun sampling date 25 jun 22 may 5 jul 28 jun 2 jul 25 jun Masse in kg 5250 7000 9680 12700 18500 20761 Filling level in % 20 28 36 48 70 80 Methane %-vol 97.9 98.5 99.0 98.9 99.0 99.1 Oxygen %-vol 0.5 0.3 0.3 0.3 0.3 0.2 Nitrogen %-vol 1.6 1.3 0.6 1.0 0.8 0.6 Hydrogen %-vol < 0.1 < 0.1 < 0.1 < 0.1 < 0.1 < 0.1
Table 3.8: Results for the determination of individual components in the gas phase vs the level of LBG in the tank
Refuelling date 16 may 25 jun 25 jun 1 jul 25 jun sampling date 25 jun 22 may 5 jul 28 jun 2 jul 25 jun Masse kg 5250 7000 9680 12700 18500 20760 % 20 28 36 48 70 80 Methane %-vol 97.7 96.85 * 96.5 95.7 93.45 Oxygen %-vol 0.6 0.4 * 0.6 0.8 0.9 Nitrogen %-vol 1.6 2.3 * 2.5 3.0 4.2 Hydrogen %-vol 0.2 0.4 * 0.3 0.5 1.4 *not measured
Figure 3.3: Methane concentrations in the liquid phase and in the gas phase vs. the mass of LBG in the tank, respectively
92,0 93,0 94,0 95,0 96,0 97,0 98,0 99,0 100,0 0 5000 10000 15000 20000 25000 % -v ol kg LBG in the tank
Methane in liquide phase Methane in gas phase
Figure 3.4: Nitrogen concentrations in the liquid phase and in the gas phase vs. the mass of LBG in the tank, respectively
Figure 3.5: Oxygen concentrations in the liquid phase and in the gas phase vs. the mass of LBG in the tank, respectively
0,0 0,5 1,0 1,5 2,0 2,5 3,0 3,5 4,0 4,5 5,0 0 5000 10000 15000 20000 25000 % -v ol kg LBG in the tank
Nitrogen in gas phase Nitrogen in liquid phase
T2 was +10C at the same flow
0,0 0,2 0,4 0,6 0,8 1,0 1,2 0 5000 10000 15000 20000 25000 % -v ol kg LBG in the tank
Oxygen in the gas phase Oxygen in the liquide phase
Figure 3.6: Hydrogen concentrations in the gas phase vs. the mass of LBG in the tank
The results show that the LBG composition does not vary significantly with the level of LBG in the tank. However, the concentration of methane in the liquid phase slightly decreases as the level of LBG decreases in the tank. The concen-tration of methane in the gas phase exhibits an opposite trend. Both oxygen and nitrogen concentrations in the liquid phase increase as the level of LBG in the tank decreases. Hydrogen could only be measured in the gas phase and its concentra-tion decreases as the level of LBG decreases in the tank.
3.7 Influence of the level of LNG in the tank on the LNG composition
The influence of the level of LNG in the tank on the LNG composition has been studied by taking samples at 4 different levels of LNG in the tank. The results are presented in table 3.8 (in the liquid phase) and in table 3.9 (in the gas phase).
0,0 0,2 0,4 0,6 0,8 1,0 1,2 1,4 1,6 1,8 2,0 0 5000 10000 15000 20000 25000
Hydrogen in the gas phase
kg LBG in the tank
%
-v
o
Table 3.8: Results for the determination of individual components in the liquid phase vs. level of LNG in the tank
Refuelling
date 13 aug 13 aug 22 aug 22 aug sampling date 13 aug 16 aug 26 aug 28 aug Masse kg 21450 15692 8803 4500 Filling level % 81% 59% 33% 18% Methane %-vol 92.9 92.4 93.0 93.3 Ethane %-vol 6.1 6.3 5.7 5.4 Propane ppmv * 8370 * 6500 Isobutane ppmv * 490 * 340 butane ppmv * 590 * 380 Pentanes ppmv * 160 * 70 Hexanes ppmv * 28 * 7 Nitrogen %-vol * 0.3 * 0.5
Table 3.9: Results for the determination of individual components in the gas phase vs. level of LNG in the tank
Refuelling
date 13 aug 13 aug 22 aug 22 aug sampling date 13 aug 16 aug 26 aug 28 aug Masse kg 21450 15692 8803 4500 % 81% 59% 33% 18% Methane %-vol * (58) 96.7 96.3 97.6 Ethane %-vol *(40) 0.95 0.82 0.63 Propan ppmv * 2700 11400 210 Isobutane ppmv * 185 1100 15 butane ppmv * 240 1500 20 Pentanes ppmv * 70 620 10 Hexanes ppmv * 16 200 6 Nitrogen %-vol <0.3 1.7 1.4 1.6
Unfortunately, the results are difficult to interpret:
The results for propane, butanes, pentanes and hexanes from the 13thand the 26th of august are not reported as the relative standard deviation from several samplings was high (more than 70%)
The campaign covers two different fillings of the tank and the qualities of the LNG filled in the tank may have been slightly different
The gas samples taken directly after the filling of the tank (13th Aug.) may not be representative of the gas in the tank. The composition was found to be varying much and up to 40% ethane was found in the first sample.
However, the LNG composition seems not to vary significantly as the level of LNG decreases in the tank. Eventually, it can be seen a little trend that ethane concen-tration decreases with decreasing level of LNG in the tank. If this trend is con-firmed, one possible hypothesis is a possible gradient of ethane in the tank, ethane concentration being slightly higher in the bottom of the tank. As vehicles are refuelled, the layers slightly richer in ethane are removed from the tank and the overall concentration of ethane decreases in the liquid and the gas phase.
4. Conclusions
In this project it has been decided to in-house design and build a sampler for the determination of LNG/LBG composition. This sampler consists of an electrically heated in-house vaporizer and a sampling section.
It is well documented that taking a representative sample of LNG/LBG is chal-lenging due to the risks that:
The LNG/LBG vaporizes uncontrolled, producing pockets of gas in the liq-uid stream resulting in turn in varying compositions
The LNG/LBG do not vaporize completely, the heaviest compounds remain-ing as liquid.
Unfortunately, the samplers commercially available have been designed for bigger installations.
Ideally, the sample shall be taken in the middle of the LNG pipe with the help of a probe. In this study, the samples could only be taken at the top of the pipe.
The capability of the sampler to take representative samples of LNG has been tested by comparing the composition obtained experimentally to the expected composition of LNG, LBG or mixtures of those. For this purpose, the in-house va-porizer has been found to work properly even if the heat transfer is not optimal. Before future work is carried on with this sampler, the heat transfer should be im-proved.
It has been found that it is crucial to regulate the outlet gas flow (gas flow of the gasified LNG/LBG) to around 20 ± 3l/min. In order to achieve these optimized conditions, the sampling point should be equipped with a valve allowing a precise regulation of the outlet gas flow as a butterfly valve. The valve needs to be working at low temperatures (down to -160°C). A provider of appropriate valves has been contacted at the end of the project.
The results obtained during this study show that:
LBG composition does not vary significantly as the level of LBG in the tank de-creases. However, concentration of methane slightly decreases in the liquid phase and increases in the gas phase as the level of the LBG in the tank decreases. As a consequence, air exhibits an opposite trend.
Even when the tank contains around 20% of LBG (with a current interval of 7-10 days between two fillings), the composition of the liquid phase fulfills the require-ments of the Swedish standard SS 15 54 38 “requirerequire-ments for biogas used as ve-hicle fuel” [16].
However, it could be expected that at longer intervals (more than 2-3 weeks be-tween two fillings) and/or if the level of the tank goes significantly lower than 20%, the gas will eventually be richer in nitrogen and oxygen, having a negative impact on the methane number, that is decreasing, (at least when calculating from the content) because of increasing inerts.
If the gas phase is used as automotive fuel, one should be aware that at high levels of LBG in the tank, the gas has been found to contain up to 1.4% hydrogen and 4% nitrogen. The limit for hydrogen in all automotive standardization is 2%. A higher share of inerts than standardized in SS 15 54 38 will not be detrimental to engines,but may result in a sub-standard heating value.
LNG composition does not vary significantly as the level of LNG in the tank de-creases. However a trend showing that ethane concentration in both the liquid and gas phases decreases while the LNG level in the tank decreases could be ob-served. However, this observation must be confirmed by new measurements.
The composition can be compared to the CARB commercial CNG requirements [17]: Methane: min. 88% Ethane: max 6% C3 and higher 3% C6 and higher 0.2% Hydrogen: max. 0.1%
Carbon monoxide: max 0.1%
Oxygen: max 1%
Inert gases: max. 4.5%
The composition of the liquid phase fulfills most of these requirements regardless of the level of LNG in the tank (ethane can be up to 6.7% according to specifica-tions from the LNG provider).
LNG and LBG are rapidly mixed in the tank when changing fuel quality. Only 1 to 2 hours after the filling of the tank, the composition of the liquid phase has been found to be in good agreement with the expected composition of LNG/LBG mixture at their respective proportions.
However, when changing fuel quality from LNG to LBG or from LBG to LNG, as the resulting composition will be a mixture of approximately 1/4 to 1/5 of one quali-ty and 3/4 to 4/5 of the “other qualiquali-ty until the next filling of the tank, it can have some influence on the drivability if the trucks are programmed for either pure LBG or pure LNG.
The most challenging aspect is the temperature in the tank. If the delivered LNG/LBG has a temperature higher than the temperature of the LNG/LBG in the tank or higher than optimal temperatures, this will cause an increase of the pres-sure in the tank which can only be controlled by partly releasing the boil-off gas. This aspect could not be studied here. However, this could be studied by simulat-ing the mixsimulat-ing of two LBG fuels at different temperatures as example ussimulat-ing the OpenFoam software (Jan Gersl, Czech Metrology Institute (personal message, 22ndof august 2013).
With the same software, the flow of LNG/LBG through the vaporizer and the heat
transfer during this process can be simulated in order to determine where in the system the conditions for re-gasification are reached for various input parameters such as inlet/outlet temperatures and flow rate of the gasified LNG/LBG.
5. Tack
Projektgruppen vill tacka finansiärer som möjliggjort detta projekt, E.ON GAS Sve-rige AB, Fordonsgas SveSve-rige AB och Scania CV AB samt projektpartners
som aktivt deltagit i genomförandet och delat med sig av sin kunskap
och information från sitt område under projektmöten eller vid provtagningen. Stort tack.
Acknowledgements
The project group would like to thank the financiers who made this project possi-ble, E.ON GAS Sverige AB, Fordonsgas Sverige AB och Scania CV AB as well as the project partners who has participated in the realization of the project and
shared their expertise and information during the project meetings and the sam-pling.
6. Literature
[1] Energigas Sverige,
http://www.energigas.se/Energigaser/FAQ/FAQBiogas/FAQFlytandeBiogas [2] Rapport SGC 236 ”Förutsättningar för utbyggnad av landbaserad infrastruktur för flytande gas (LNG/LBG)”, Maria Stenkvist, Hanna Paradis, Kristina Haraldsson, Ronja Beijer, Peter Stensson, ÅF Industry AB, 2011
[3] http://en.wikipedia.org/wiki/Methane_(data_page)
[4] ISO12838:2000 “Installations and equipment for liquefied natural gas - suitabil-ity testing of LNG sampling systems”
[5] GIIGL (Groupe International des Importateurs de Gaz Naturel Liquéfié) LNG Custody Trasnfer Handbook, 3rdedition, 2010
[6] ISO 6974-3,4,5,6:2000/2002, “Natural gas -- Determination of composition with defined uncertainty by gas chromatography”
[7] ISO 8943:2007 “Refrigerated light hydrocarbon fluids – Sampling of liquefied natural gas – continuous and intermittent methods”
[8] www.arb.ca.gov/regact/cng-lpg/appd.PDF
[9] DGC, Project report, june 1999, “Algorithm for methane number determination for natural gases”, Paw Andersen
[10] D4784-93 (reapproved 2010), “standard specification of LNG density calcula-tion models”
[11] ISO 6578 (also using the revised KLOSEK-Mc KINLEY method) [12] http://www.thermo.rub.de/en/prof-w-wagner/software/gerg-2004-gerg-2008.html
[13] ISO 6976:1995 Natural gas -- Calculation of calorific values, density, relative-density and Wobbe index from composition
[14] Vogt, G.J.; Pitzer, K.S., “Entropy and heat capacity of methane, spin-species conversion”, J. Chem. Thermodynam., 1976, 8, 1011-1031.
[15] Gurvich, L.V.; Veyts, I.V.; Alcock, C.B., Thermodynamic Properties of Individ-ual Substances, 4th ed.; Vols. 1 and 2,Hemisphere, New York, 1989.
[16] SIS, 1999, “SS 15 54 38 Motorbränslen – Biogas som bränsle till snabbgå-ende ottomotorer (Motor fuels – biogas as fuel for high-speed otto engines)” [17] SAE J2699, july 2007, Liquefied Natural Gas (LNG) Vehicle Fuel