Discovery of Potential
Parallelism in Sequential
Programs
Entdeckung von potentieller Parallelität in sequentiellen Programmen Zur Erlangung des Grades eines Doktors der Naturwissenschaften (Dr. rer. nat.) genehmigte Dissertation von Zhen Li, M.Sc. aus Tianjin, China
Tag der Einreichung: September 1, 2016, Tag der Prüfung: October 28, 2016 Darmstadt 2016 — D 17
1. Gutachten: Prof. Dr. Felix Wolf 2. Gutachten: Prof. Dr. Philippe Clauss
Fachbereich Informatik Parallele Programmierung
Discovery of Potential Parallelism in Sequential Programs
Entdeckung von potentieller Parallelität in sequentiellen Programmen
Genehmigte Dissertation von Zhen Li, M.Sc. aus Tianjin, China
1. Gutachten: Prof. Dr. Felix Wolf 2. Gutachten: Prof. Dr. Philippe Clauss
Tag der Einreichung: September 1, 2016 Tag der Prüfung: October 28, 2016
Darmstadt 2016 — D 17
Please cite this document as:
URN: urn:nbn:de:tuda-tuprints-57412
URL: http://tuprints.ulb.tu-darmstadt.de/5741
This document is provided by tuprints, E-Publishing-Service of the TU Darmstadt http://tuprints.ulb.tu-darmstadt.de
This work is published under the following creative commons license: Attribution – Non Commercial – No derivative works 4.0 International http://creativecommons.org/licenses/by-nc-nd/4.0/
Erklärung zur Dissertation
Hiermit versichere ich, die vorliegende Dissertation ohne Hilfe Dritter nur mit
den angegebenen Quellen und Hilfsmitteln angefertigt zu haben. Alle Stellen, die
aus Quellen entnommen wurden, sind als solche kenntlich gemacht. Diese Arbeit
hat in gleicher oder ähnlicher Form noch keiner Prüfungsbehörde vorgelegen.
Darmstadt, den November 4, 2016
(Zhen Li)
Abstract
In the era of multicore processors, the responsibility for performance gains has been shifted onto software developers. Once improvements of the sequential algorithm have been exhausted, software-managed parallelism is the only option left. However, writing parallel code is still difficult, especially when parallelizing sequential code written by someone else. A key task in this process is the identification of suitable parallelization targets in the source code. Parallelism discovery tools help developers to find such targets automatically. Unfortunately, tools that identify parallelism during compilation are usually conservative due to the lack of runtime information, and tools relying on runtime information primarily suffer from high overhead in terms of both time and memory. This dissertation presents a generic framework for parallelism discovery based on dynamic program analysis, supporting various types of parallelism while incurring practically affordable overhead. The framework contains two main components: an efficient data-dependence profiler and a set of parallelism discovery algorithms based on a language-independent concept called Computational Unit.
The data-dependence profiler serves as the foundation of the parallelism discovery frame-work. Traditional dependence profiling approaches introduce a tremendous amount of time and memory overhead. To lower the overhead, current methods limit their scope to the subset of the dependence information needed for the analysis they have been created for, sacrificing generality and discouraging reuse. In contrast, the profiler shown in this thesis addresses the problem via signature-based memory management and a lock-free parallel design. It produces detailed dependences not only for sequential but also for multi-threaded code without caus-ing prohibitive overhead, allowcaus-ing it to serve as a generic base for various program analysis techniques.
Computational Units (CUs) provide a language-independent foundation for parallelism dis-covery. CUs are computations that follow the read-compute-write pattern. Unlike other con-cepts, they are not restricted to predefined language constructs. A program is represented as a CU graph, in which vertexes are CUs and edges are data dependences. This allows parallelism to be detected that spreads across multiple language constructs, taking code refactoring into consideration. The parallelism discovery algorithms cover both loop and task parallelism.
Results of our experiments show that 1) the efficient data-dependence profiler has a very competitive average slowdown of around 80×with accuracy higher than 99.6%; 2) the frame-work discovers parallelism with high accuracy, identifying 92.5% of the parallel loops in NAS benchmarks; 3) when parallelizing well-known open-source software following the outputs of the framework, reasonable speedups are obtained. Finally, use cases beyond parallelism discov-ery are briefly demonstrated to show the generality of the framework.
Kurzfassung
In Zeiten stagnierender Performanz von Einzelprozessoren obliegt die Leistungssteigerung von Programmen deren Entwicklern. Sind alle Möglichkeiten sequentieller Optimierung erschöpft, ist softwaregesteuerte Parallelität die einzig verbleibende Option. Das Schreiben von paral-lelem Code stellt jedoch immer noch eine Herausforderung dar, besonders wenn der Autor der sequenziellen Version nicht mehr verfügbar ist. Eine Hauptaufgabe ist deshalb die Erkennung potenzieller Parallelität im Quellcode. Werkzeuge zur Entdeckung potenzieller Parallelität vol-lziehen diese Suche automatisch. Geschieht dies zur Compilezeit, ist das Ergebnis aufgrund mangelnder Laufzeitinformationen eher konservativ. Hingegen leiden Tools, die auf Laufzeit-informationen basieren, vor allem unter großem Overhead – sowohl hinsichtlich Zeit als auch Speicher. Gestützt auf eine dynamische Programmanalysetechnik, präsentiert diese Disserta-tion ein allgemeines Framework zur Entdeckung verschiedener Arten potenzieller Parallelität mit geringem Overhead. Das Framework besteht aus zwei Hauptkomponenten: einem effizien-ten Profiler zur Erfassung von Daeffizien-tenabhängigkeieffizien-ten sowie einer Menge von Algorithmen zur Entdeckung von Parallelität. Den Algorithmen zugrunde liegt das sprachunabhängige Konzept der Computational Units.
Der Profiler dient als Eckpfeiler des Frameworks. Traditionelle Ansätze zum Profiling von Datenabhängigkeiten verursachen signifikanten Overhead. Um diesen zu senken, konzentrieren sich aktuelle Ansätze unter Vernachlässigung von Allgemeingültigkeit und Wiederverwend-barkeit auf diejenige Teilmenge der Abhängigkeitsinformation, die für die jeweilige Analyse benötigt wird. Im Gegensatz dazu begegnet der in dieser Arbeit vorgestellte Profiler der Herausforderung durch signaturbasierte Speicherverwaltung sowie eine lockfreies paralleles Design. Er produziert sowohl für sequentiellen als auch für Thread-parallelisierten Code de-taillierte Abhängigkeiten mit praktisch vertretbarem Overhead. Dadurch kann er als allgemeine Basis für ein breites Spektrum an Programmanalysetechniken eingesetzt werden.
Das Konzept der Computational Units (CUs) schafft ein sprachunabhängiges Funda-ment zur Entdeckung potenzieller Parallelität. CUs sind eleFunda-mentare Programmschritte, die dem Read-Compute-Write Muster folgen. Im Gegensatz zu alternativen Konzepten sind sie nicht auf vordefinierte Sprachkonstrukte beschränkt. Ein Programm wird durch einen CU-Graphen repräsentiert, in dem die Knoten den CUs und die Kanten den Datenabhängigkeiten entsprechen. Dadurch kann Parallelität unter Berücksichtigung von Code-Refaktorisierung auch über die Grenzen einzelner Sprachkonstrukte hinweg erkannt werden.
Die Ergebnisse unserer Experimente zeigen: 1) Der effiziente Abhängigkeitsprofiler bewirkt im Durchschnitt eine sehr konkurrenzfähige Verlangsamung von etwa einem Faktor 80 mit einer Genauigkeit von mehr als 99,6%. 2) Das Framework erkennt Parallelität in NAS Benchmarks mit hoher Genauigkeit. Es identifiziert 92,5% der parallelen Schleifen. 3) Beim Parallelisieren III
bekannter Open Source-Software gemäß der Ausgabe des Frameworks werden angemessene Geschwindigkeitsgewinne erzielt. Um schließlich die universelle Verwendbarkeit des Frame-works zu demonstrieren, werden beispielhaft Anwendungen jenseits der Erkennung von Paral-lelität diskutiert.
Acknowledgment
I would like to thank all the people who contributed in a certain way to the work described in this dissertation. First and foremost I offer my sincerest gratitude to my supervisor Prof. Dr. Felix Wolf, head of the Laboratory for Parallel Programming at Technische Universität Darmstadt. He has been supportive since the day I join LPP with his patience and knowledge while giving me the room to work in my own way. Felix has not only guided me academically, but also encouraged me emotionally through the rough road to finish this thesis. Thanks to him I had the opportunity to work on DiscoPoP and presents this thesis, a milestone in almost five years of work. I have been always feeling comfortable working with Felix, and I simply could not wish for a better supervisor.
In my past few years at LPP, I have been advised and aided intensively by Dr. Ali Jannesari, an experienced and enthusiastic researcher in parallel programming. Ali has offered much advice and insight throughout my work on DiscoPoP. Without his inspiration, I could never come up to the idea of computational units. I also want to thank my second referee, Prof. Dr. Philippe Clauss, for being interested in my work and being my thesis reader.
It was a great pleasure to work with a friendly and cheerful group of colleagues at LPP, and I would like to thank them all for their help. Zia Ul Huda, a sincere friend who shared the same office with me for more than three years, made key contributions to DiscoPoP on parallel pattern detection. Rohit Atre spent much time and effort in studying computational units and static parallelism discovery methods. Arya Mazaheri provided a great application of DiscoPoP, which detects parallel communication patterns in programs running on multicore platforms. Mohammad Norouzi made a lot of suggestions on improving DiscoPoP, and has been working on energy-oriented code optimization based on computational units. Additionally, I want to thank Suraj Prabhakaran, a great colleague and my neighbor in 2015, and Elisabeth Altenberger, for their kind help in work and daily life. I also thank Sebastian Rinke and Alexandru Calotoiu for their collaborative assistance in teaching courses at both RWTH Aachen and TU Darmstadt.
I would also like to thank my master students and student assistants for their coding support. Wolfram Gottschlich implemented the original version of the signature described in this thesis. Tuan Dung Nguyen implemented the lock-free parallel version of the DiscoPoP profiler. Michael Beaumont tested the memory skipping technique. Daniel Fried implemented the method of characterizing DOALL loops using machine learning and DiscoPoP.
I want to say thank you to my wife, Mengyu Zhu, for her constant love and support. Thank you for listening to me when I grumble, comforting me when I feel disappointed, encouraging me when I lose faith, and accompanying me when I am alone. It would not be possible for me to finish writing this thesis without your support. I feel lucky to have you as my significant other. You are not just my companion, you are my inspiration.
Finally, I thank my parents for supporting me throughout all my studies at universities, and for always providing me a cozy place whenever I stay in China. Every time I sit at the old wooden table with you, eating tasty home-made food and watching TV, I regret to not having planned a longer stay at home.
Contents
List of Figures XI
List of Tables XIII
1 Introduction 1
1.1 Parallel Computing . . . 2
1.2 Parallelism Discovery . . . 3
1.2.1 Data Dependences . . . 3
1.2.2 Control Dependences . . . 4
1.3 Parallelism Discovery Tools . . . 6
1.3.1 Data-Dependence Analyzers . . . 6
1.3.2 Semi-Automatic Parallelism Discovery Tools . . . 8
1.3.3 Automatic Parallelization Tools . . . 12
1.3.4 Review of the Existing Tools and the Scope of This Thesis . . . 17
1.4 Introduction to LLVM . . . 18
1.4.1 The LLVM Intermediate Representation . . . 19
1.4.2 The LLVM Pass Framework . . . 21
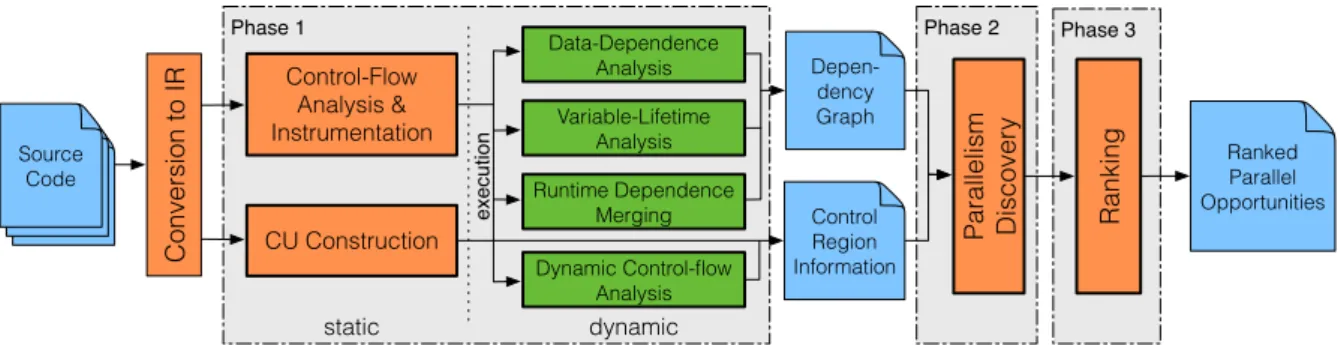
1.5 Approach Overview . . . 22
1.5.1 Phase 1: Control-Flow Analysis and Data-Dependence Profiling . . . 22
1.5.2 Phase 2: Parallelism Discovery . . . 23
1.5.3 Phase 3: Ranking . . . 23
1.6 Contributions of This Thesis . . . 23
2 Data-Dependence Analysis 25 2.1 Static Approaches . . . 25
2.2 Dynamic Approaches . . . 28
2.3 DiscoPoP Profiler . . . 29
2.3.1 Representation of Data Dependences . . . 29
2.3.2 Signature-Based Profiling . . . 30
2.3.3 Parallel Data-Dependence Profiling . . . 33
2.3.4 Supporting Multi-Threaded Target Programs . . . 35
2.3.5 Optimization . . . 38
2.3.6 Control Structure Information . . . 40
2.3.7 Limitations . . . 41
2.4 Skipping Repeatedly-Executed Memory Operations in Loops . . . 42
2.4.1 Condition onaddr . . . 44 VII
2.4.2 Condition onaccessInfo . . . 44
2.4.3 Example . . . 45
2.5 Evaluation . . . 47
2.5.1 Accuracy of Profiled Dependences . . . 48
2.5.2 Performance . . . 50
2.6 Summary . . . 59
3 Computational Units 61 3.1 Definition . . . 61
3.2 Construction . . . 62
3.2.1 Global and Local Variables . . . 62
3.2.2 Dynamic Control-Dependence Analysis . . . 64
3.2.3 The Algorithm of Building CUs . . . 65
3.2.4 Example of Building CUs Using the Top-Down Appoach . . . 67
3.2.5 Special Variables in Building CUs . . . 69
3.3 Granularity . . . 70
3.4 Computational Unit Graph . . . 71
3.5 Computational Units and Pure Functions . . . 74
3.6 Summary . . . 75
4 CU-Based Parallelism Discovery 77 4.1 Parallelism in Loops . . . 77 4.1.1 DOALL Loops . . . 77 4.1.2 DOACROSS Loops . . . 78 4.2 Parallel Tasks . . . 79 4.2.1 SPMD-Style Tasks . . . 79 4.2.2 MPMD-Style Tasks . . . 81
4.3 Ranking of Parallelization Targets . . . 83
4.3.1 Instruction Coverage . . . 83 4.3.2 Local Speedup . . . 83 4.3.3 CU Imbalance . . . 84 4.4 Evaluation . . . 85 4.4.1 DOALL Loops . . . 85 4.4.2 DOACROSS Loops . . . 89 4.4.3 SPMD Tasks . . . 93 4.4.4 MPMD Tasks . . . 94 4.4.5 Ranking Method . . . 97 4.5 Limitations . . . 98 4.6 Summary . . . 98
5 Further Applications of the Framework 101 5.1 Characterizing Features for DOALL Loops . . . 101
5.2 Determining Optimal Parameters for Software Transactional Memory . . . 103 5.3 Detecting Communication Patterns on Multicore Systems . . . 104 5.4 Summary . . . 106
6 Conclusion and Outlook 107
Bibliography XV
List of Figures
1.1 Control-dependence graph and control-flow graph of the code snippet shown in
section 1.2.2. . . 5
1.2 The content of an LLVM assembly file. . . 20
1.3 Parallelism discovery workflow. . . 22
2.1 A fragment of profiled data dependences in a sequential program. . . 30
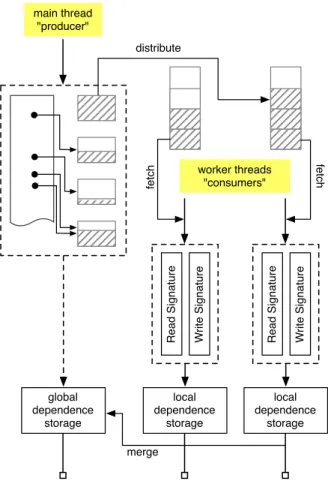
2.2 Architecture of the parallel DiscoPoP data-dependence profiler for sequential pro-grams. . . 33
2.3 A fragment of data dependences from a parallel program captured by our profiler. Thread IDs are highlighted. . . 35
2.4 Thread scheduling affects the correctness of recorded data dependences. push_read() and push_write() are operations to push memory accesses into chunks. . . 36
2.5 A lock-free multiple-producer-single-consumer queue. . . 37
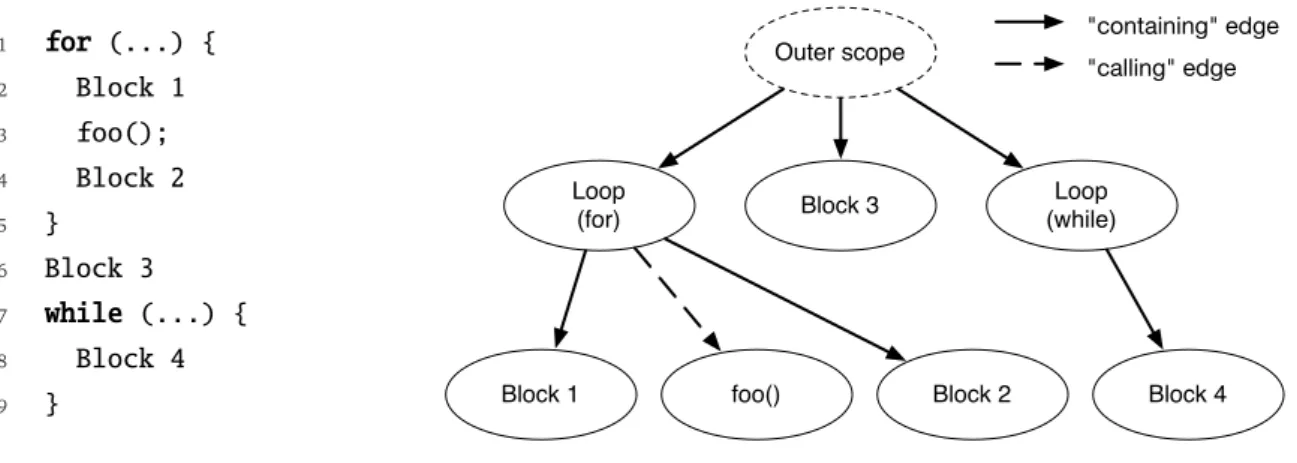
2.6 An example of the program execution tree (PET). . . 41
2.7 A simple loop where data dependences will not change over iterations. . . 43
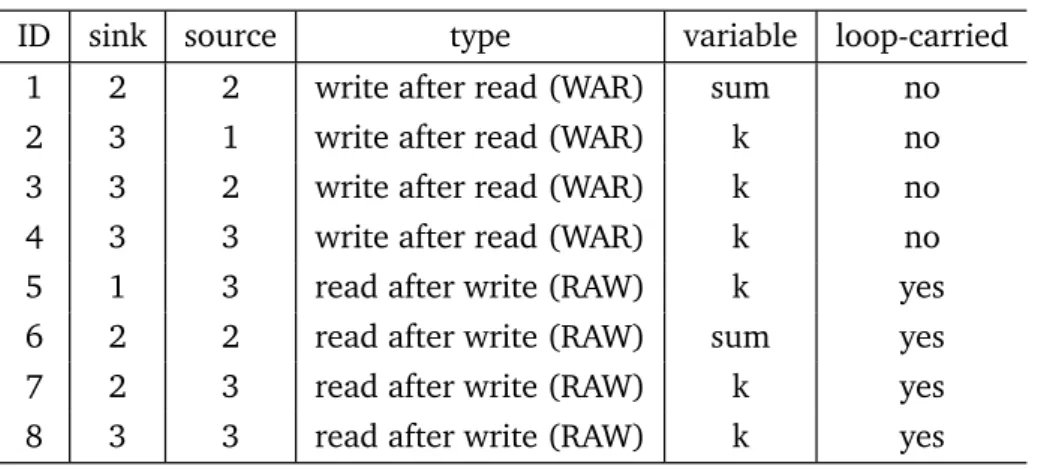
2.8 A loop containing four memory operations on the same memory address. . . 46
2.9 Performance results of the data-dependence profiler on sequential NAS and Star-bench Star-benchmarks. . . 52
2.10 Slowdown of the profiler for parallel Starbench programs (pthread version, T = thread for profiling, Tn = thread for benchmark). . . 53
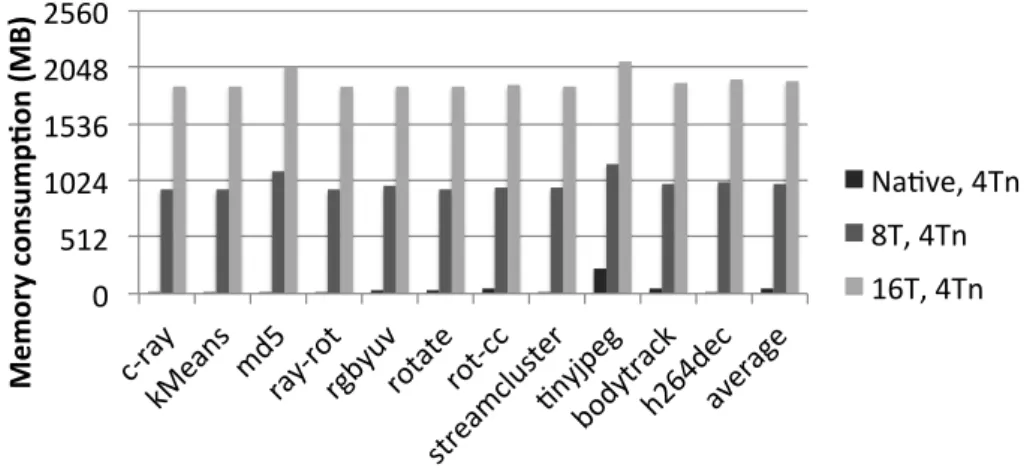
2.11 Memory consumption of the profiler for parallel Starbench programs (pthread version, T = thread for profiling, Tn = thread for benchmark). . . 53
2.12 Slowdowns of the DiscoPoP profiler when applied to NAS and Starbench bench-marks with (DiscoPoP+opt) and without (DiscoPoP) skipping repeatedly exe-cuted memory operations. . . 54
2.13 Distribution of skipped memory instructions according to the type of data depen-dences they would create. . . 57
2.14 Write-after-write dependences are frequently built in FT because of the use of variabledummy. . . 58
3.1 Finding the re-convergence point (solid black circle). . . 64
3.2 A simple code example. . . 65
3.3 Re-convergence points of the example in Figure 3.2. . . 65
3.4 Building a CU. . . 69
3.5 The LLVM IR of a sample C++ code section. . . 70
3.6 Part of the CU graph ofrot-cc. . . 72 XI
3.7 Part of the CU graph ofCGcombined with control region information. . . 73
4.1 The nested loops in functionevolveof the SNU NAS benchmarkFT. . . 78
4.2 A loop in the BOTS benchmarknqueens. . . 79
4.3 A program that computes thenth Fibonacci number. . . 80
4.4 A code snippet showing the role of control dependence in MPMD-style tasks. . . . 81
4.5 Simplifying CU graph by substituting SCCs and chains of CUs with vertices. . . 82
4.6 Scenarios with different degrees of CU imbalance. . . 84
4.7 The target loop inrgbyuv(bmark.c, line 151). . . 90
4.8 CU graphs of the loop body of the loop inrgbyuv(bmark.c, line 151). . . 90
4.9 Souce code fragments of functionfft_twiddle_16in the BOTS benchmarkfft. . . 94
4.10 Work flow and flow graph of FaceDetection. . . 96
4.11 FaceDetection speedups with different numbers of threads. . . 97
4.12 A simple but common time measurement method in benchmarks. . . 98
5.1 Communication patterns of splash2x benchmarks derived from the output of the DiscoPoP profiler. . . 105
List of Tables
2.1 Subset constraints in Andersen’s algorithm. . . 27 2.2 Data dependences of the loop shown in Figure 2.7. . . 43 2.3 Data dependences of the loop shown in Figure 2.8. . . 46 2.4 How the values of lastStatusRead and lastStatusWrite are changed during
the profiling process for the loop shown in Figure 2.8. . . 46 2.5 How the status in shadow memory is changed during the profiling process for the
loop shown in Figure 2.8. . . 46 2.6 False positive and false negative rates of profiled dependences for Starbench. . . . 49 2.7 Statistics of memory instructions that lead to data dependence but are skipped
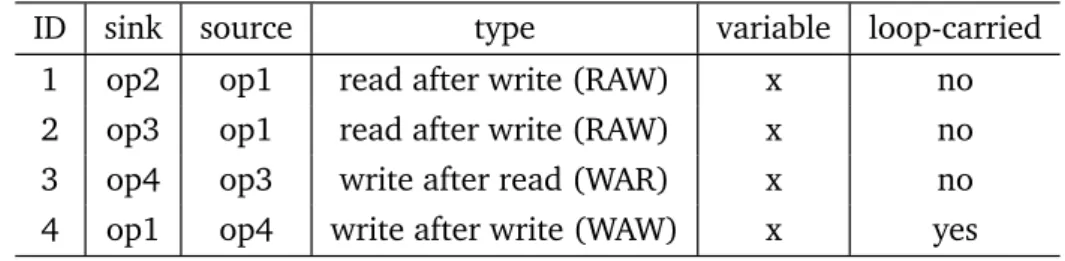
by the profiler when profiling NAS benchmarks and Starbench. . . 56 3.1 Possible forms of an edge in a CU graph. . . 71 4.1 Detection of parallelizable loops in NAS Parallel Benchmark programs. . . 86 4.2 Speedups achieved when parallelizing textbook programs adopting the
sugges-tions produced by our method using four threads. . . 87 4.3 Suggestions for histogram visualization. . . 88 4.4 Detection of DOACROSS loops in benchmarks from Starbench and NAS. The
biggest hot loops in terms of execution time of each benchmark are summarized in the table. . . 89 4.5 Parallelism discovery results of gzip 1.3.5 and bzip2 1.0.2 compared to existing
parallel implementations. The table summarizes the number of suggestions and the most important parallelization opportunity for each application. . . 91 4.6 SPMD-style tasks in BOTS benchmarks. . . 93 4.7 Detection of MPMD tasks in PARSEC benchmarks and the multimedia
applica-tions libVorbis, and FaceDetection. . . 95 5.1 Dynamic features used for DOALL loop classification. . . 101 5.2 Feature importance in decision trees, calculated using weighted error reduction
in an AdaBoost ensemble of trees. . . 102 5.3 Classification scores on the held-out evaluation set, separated by loops with
prag-mas and loops without pragprag-mas. . . 103 5.4 Number of transactions in NAS benchmarks. Transactions are determined by
analyzing the output of the DiscoPoP profiler. . . 104
1 Introduction
Although the component density of microprocessors is still rising according to Moore’s law, single-core performance is stagnating for more than ten years now. As a consequence, extra transistors are invested into the replication of cores, resulting in the multi- and many-core ar-chitectures popular today. The only way for developers to take advantage of this trend if they want to speed up an individual application is to match the replicated hardware with thread-level parallelism. This, however, is often challenging – especially if the sequential version of the application was written by someone else. Unfortunately, in many organizations this situation is more the rule than the exception. Most software systems are created by modifying earlier source code, and most of the work and cost of software development is after the first release, that is, during evolution [1]. To find an entry point for the parallelization of an organization’s application portfolio and lower the barrier to sustainable performance improvement, tools are needed that identify the most promising parallelization targets in the source code. These would not only reduce the required manual effort but also provide a psychological incentive for devel-opers to start and a structure for managers along which they can orchestrate the parallelization work flow.
However, constructing parallelism discovery tools is a great challenge. Parallelism is dis-covered by analyzing dependences in the target program, which so far cannot be obtained both accurately and efficiently. Methods to discover potential parallelism fall into one of two categories: static and dynamic methods. Being closely related to compiler technology, static approaches analyze source or intermediate code and are restricted to information that can be obtained before running the program. Static approaches are fast, but also conservative because they have limited support for objects allocated or identifiable only at runtime. In contrast, dynamic approaches identify dependences only if they exist at runtime. Although dynamic ap-proaches relax the conservative assumptions made by static apap-proaches on dynamic objects, they are input sensitive, that is, their outcome may depend on the particular execution config-urations. A more serious limitation of dynamic approaches is their high runtime overhead in terms of both time and space. So far, the high overhead prevents dynamic approaches from practical use.
This thesis presents a generic framework for parallelism discovery based on dynamic depen-dence analysis, supporting various types of parallelism while incurring practically affordable overhead. The framework contains two main components: an efficient data-dependence pro-filer (Chapter 2) and a set of parallelism discovery algorithms (Chapter 4) based on a language-independent concept called computational unit (Chapter 3).
In the remainder of this chapter, we first introduce the reason why parallelism discovery tools are needed. After that, data and control dependences, the main obstacle to parallelism, 1
are introduced. Furthermore, we survey the state-of-the-art parallelism discovery tools, and present a summary of the open problems based on the survey. Through the summary, we define the scope of this thesis. Next, we give a brief introduction of LLVM, a collection of compiler and tool chain technologies on top of which our method is built. In the end, we present an overview of our approach and summarize the contributions of this thesis.
1.1 Parallel Computing
Parallel computing is a type of computation in which many calculations are carried out simul-taneously, [2] operating on the principle that large problems can often be divided into smaller ones that are then solved at the same time. Nowadays, parallel computing is the key to improve the performance of computer programs.
Moore’s law [3] is the empirical observation that the number of transistors in a microproces-sor doubles every 18 to 24 months. The additional transistors are used for many architectural improvements, including multi-level caches, sophisticated instruction unit that supports pipelin-ing, support of simultaneous multi-threadpipelin-ing, and so on. However, from the mid-1980s until 2004, the additional transistors are mainly used for ramping up processor frequency (know
as frequency scaling), which was the dominant reason for improvements in computer
perfor-mance. Increases in frequency also increase the amount of power used in a processor. On May 8, 2004, Intel canceled its Tejas and Jayhawk processors due to their high power consumption, which is generally cited as the end of frequency scaling as the dominant vehicle for performance improvement.
However, Moore’s law is still in effect. With the end of frequency scaling, the additional transistors have been used to add extra hardware for parallel computing, leading to the emer-gence of multi-core processors. A multi-core processor is a single computing component with two or more independent actual processing units called “cores”, which are the units that read and execute program instructions. These multiple cores can run multiple instructions at the same time, increasing the overall speed for programs amenable to parallelism.
Unlike frequency scaling, multi-core is not a technology from which programmers can ben-efit automatically. Sequential programs still run on a single core of a multi-core processor. So far, compilers that equipped with advanced analyses and optimization techniques are able to transform well-formed sequential loops into equivalent parallel loops. These compilers are very successful in scientific computing area since scientific computing programs usually con-tains many well-formed loops that perform heavy computations. In terms of general-purposed application that usually contains parallelism beyond loops, there is no compiler that supports fully automatic parallelization, which remains a grand challenge due to its need for complex program analysis and the unknown factors (such as input data range) during compilation. As a result, parallel programs are mainly created by programmers. Compared to sequential pro-gramming, parallel programming is much more difficult and error-prone. Depending on the concrete task, it may require deep understanding of the algorithm in use, the guarantees of the programming language in use, parallel programming models, details of the target machine, or
even all of them. For this reason, tools that can help in parallelization are urgently needed. Currently, approaches to achieve parallelization can be divided into three categories:
• Annotations from programmers to guide compiler parallelization
• Interactive system between programmers and parallelizing tools/compilers to ease paral-lelization
• Hardware-supported speculative multi-threading
This thesis presents a novel parallelism discovery framework that works as an interactive system to assist parallelization. We select this category because of the following reasons. Firstly, the most efficient parallel programs are so far still written by hands. Secondly, in many cases, parallelization also means code refactoring. Adding annotations without touching the algo-rithm structure may not yield the best solution. Last but not least, understanding the code is still necessary for programmers because it is not yet possible for a machine to understand a programmer’s intention. We will discuss this point further in Chapter 4.
1.2 Parallelism Discovery
Parallelism is mainly prohibited by dependences, and dependences includes data dependences and control dependences. In this section, we introduce both of them and discuss their roles in parallelism discovery.
1.2.1 Data Dependences
A data dependence is a situation in which a program statement (instruction) refers to the data of a preceding statement. In compiler theory, the technique used to discover data dependences among statements (or instructions) is called dependence analysis.
Assuming statementS1 andS2,S2depends onS1 if:
[I(S1)∩O(S2)]∪[O(S1)∩I(S2)]∪[O(S1)∩O(S2)]6=∅ (1.1)
where:
• I(Si)is the set of memory locations read bySi
• O(Sj)is the set of memory locations written bySj
• There is a feasible runtime execution path from S1 to S2
This condition is called Bernstein Condition [4], named by A. J. Bernstein. Let → be the precedence relationship in terms of expression evaluation order. According to the Bernstein Condition, there are three cases of data dependences:
• Flow dependence: O(S1)∩I(S2) =6 ∅, S1 → S2. S2 reads a memory location after S1
writes to it. A flow dependence is also called read-after-write (RAW) dependence, or true dependence.
• Anti-dependence: I(S1)∩O(S2) =6 ∅, S1 → S2. S1 reads a memory location before S2
writes it. An anti-dependence is also called write-after-read (WAR) dependence.
• Output dependence: O(S1)∩O(S2) 6= ∅, S1 → S2. Both S1 and S2 write to the same memory location(s). An output dependence is also called write-after-write (WAW) depen-dence.
Understanding data dependences is fundamental to implementing parallel algorithms. No program can run more quickly than the longest chain of dependent calculations, known as the critical path [5], since calculations that depend upon prior calculations in the chain must be executed in order. However, most algorithms do not consist of just a long chain of dependent calculations; there are usually opportunities to execute independent calculations in parallel.
The Bernstein Condition describes whether two program statements can run in parallel or not. In condition 1.1, S1 and S2 can be replaced by P1 and P2, representing two program segments. In this case, the Bernstein Condition describes whether two program segments can run in parallel or not. In either case, the conclusion is always the same: parallelism can be explored if there is no data dependence between them.
In the scenario of parallelism discovery, the three kinds of data dependences are not equally important. Usually, flow dependences (RAW) cannot be fully resolved, and that is also why they are also called “true dependences”. In contrast, anti-dependences (WAR) and output depen-dences (WAW) can usually be resolved by renaming the variable where the program statement writes. Thus, anti-dependences and output dependences are also calledname dependences.
1.2.2 Control Dependences
A program statement (instruction) is control dependent on a preceding statement if the outcome of latter determines whether former should be executed or not. Formally, a statementS2 is said to be control dependent on another statementS1if and only if:
• There exists a path P from S1 to S2 such that every statement Si 6= S1 within P will be followed byS2 in each possible path to the end of the program (S2 post-dominates allSi) • S1will not necessarily be followed byS2, that is, there is an execution path fromS1 to the
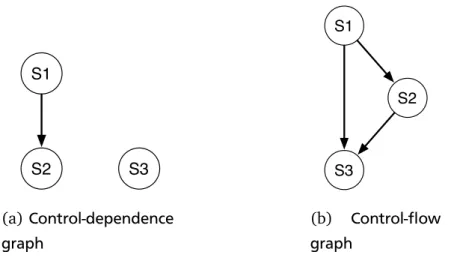
end of the program that does not go throughS2(S2 does not post-dominateS1) [6] For example, consider the following code section:
1 S1. if (a == b)
2 S2. a = a + b
S1 S2 S3 (a) Control-dependence graph S1 S2 S3 (b) Control-flow graph
Figure 1.1:Control-dependence graph and control-flow graph of the code snippet shown in sec-tion 1.2.2.
Statement S2 is control dependent on statement S1. However, S3 is not control dependent upon S1 because S3 is always executed irrespective of the outcome of S1.
Similar to data dependences, control dependences also produce execution-order constraints between program statements. Unlike data dependences, control dependences can be broken using a technique calledspeculative execution. In the above example, S2 can be executed on another processor speculatively without waiting for the outcome of S1. Later on, if the condition in S1 is evaluated to be true, then the program finishes immediately since S2 is already executed. Otherwise, S3 is executed. In this example, the performance of the program is improved by utilizing one more processor. Speculative execution is usually transparent to programmers. It exists in many schedulers, including both software and hardware implementations.
It is worth mentioning that control dependences are different from control flow, which de-scribes an execution path of a program. Again, take the above example, figure 1.1(a) shows its control-dependence graph, and figure 1.1(b) shows its control-flow graph. Usually, compilers produce the control-flow graph, and control dependences can be deduced from it.
Parallelism discovery is challenging mainly because dependences cannot be obtained both accurately and efficiently. Methods to discover potential parallelism fall into one of two cat-egories: static and dynamic methods. Being closely related to compiler technology, static approaches analyze source or intermediate code and are restricted to information that can be obtained before running the program. Static approaches are good at finding the com-plete control-flow graph and also fast. However, there are several disadvantages associated with them. First, when the program is large and has many branches, the solution search space becomes too big, a problem known asbranch explosion. Second, they have a limited support of determining dependences among objects allocated or identifiable only at runtime. This is why static approaches are usually considered conservative in their assessment of parallelization opportunities.
In contrast, dynamic methods track dependences at runtime. They treat the execution of a user program as an instruction stream interrupted by previously inserted calls to instrumen-tation functions that help detect dependences. Dynamic approaches identify control and data dependences only if they really exist at runtime. Since they track only the branches that are actually executed, they do not suffer the branch explosion problem. But the control-flow graph is usually incomplete. In general, dynamic methods are input sensitive, that is, their outcome may depend on the particular execution configuration, a disadvantage traded in for not being pessimistic like static methods. A straightforward compromise is selecting a range of represen-tative inputs and repeating the analysis with all of them. A more serious limitation of dynamic approaches is their high runtime overhead in terms of both time and space. The overhead is mainly caused by the underlying dynamic data-dependence analysis that instruments and tracks all the memory accesses of the target program. So far, the extraordinary high overhead prevents dynamic approaches from practical use.
1.3 Parallelism Discovery Tools
As described in Section 1.2.1, data dependences form the critical path of a program, which in turns dictates the upper bound of the application’s execution speed. Due to this reason, the fundamental work of parallelism discovery is to look for the absence of data dependences in sequential programs. When the target program contains a considerable number of lines of code (LOC), manually exploring data dependences through the program in program statement level is almost impossible. In this case, automatic methods to detect parallelism and predict parallel performance based on data dependences are necessary. In this section, we cover all the three categories of parallelism discovery tools: data dependence analyzers, semi-automatic parallelism discovery and modeling tools, and automatic parallelization tools.
1.3.1 Data-Dependence Analyzers
Obtaining the data-dependence graph is the first step to discover parallelism. In this section, we introduce tools that reveal data dependences but leave the actual parallelism discovery work to the user.
Usually, tools that can obtain data dependences are capable of extracing more information, such as the control flow graph, the call graph, and use/def – def/use chains. These analyses are usually integrated in the same code analysis framework.
Aristotle Analysis System
The Aristotle Analysis System [7] provides program analysis information and supports the devel-opment of software engineering tools using static analyses. It is an open-source tool developed by the Aristotle Research Group from Georgia Institute of Technology.
The Aristotle Analysis System uses a parser to gather control flow, local data flow, and symbol table information for C programs. It processes the data provided by the parser for a variety of tasks, such as data-dependence and control-dependence analysis, graph construction and graph rendering. Parser and tools use database access routines to store information in, and retrieve it from, a data repository. Users can view analysis data textually or graphically. A user interface provides menu-driven access to tools.
Frama-C
Frama-C [8] is a suite of tools dedicated to the analysis of the source code of software written in C. It is an open-source tool developed by teams from two institutions: CEA–LIST (Software Reliability Laboratory) and INRIA-Saclay.
Frama-C contains several static analysis techniques in a single collaborative framework and provides tools such as a code slicer and a dependence analyzer. The main features of Frama-C (including plugins) are:
1. Observe sets of possible values for the variables of the program at each point of the exe-cution
2. Slice the original program into smaller ones with fewer dependences among them
3. Traverse the data-flow graph of the program, from definition to use or from use to defini-tion
DMS®Software Reengineering Toolkit™
The DMS Software Reengineering Toolkit is a set of customizable tools for automatic source program analysis, code generation, and code translation. It is a commercial tool developed by Semantic Designs, Inc., a privately- held corporation headquartered in Austin, Texas. The tool is implemented using PARLANSE [9], an in-house parallel programming language.
DMS works like an extremely generalized compiler. It has a parser, a semantic analyzer, a program transformation engine to do code generation and optimization, and final output formatting components producing source code rather than binary code. However, unlike a con-ventional compiler, in which each component is specific to its task of translating one source language to one target machine language, each DMS component is highly parameterized, en-abling a stunningly wide variety of effects. This means one can change the input language, change the analysis, change the transforms, and change the output in arbitrary ways.
DMS supports control-flow graph construction and data-flow analysis. It covers both use-def chain analysis and def-use chain analysis in the graph. The graph is produced by DMS’s C Front End, thus one can infer that the control-flow and data-flow analyses are done statically.
1.3.2 Semi-Automatic Parallelism Discovery Tools
Tools that are in the middle of the spectrum try to locate the potential parallelism in sequential programs rather than showing the data-dependence graph. However, parallelism discovery is a technique much more difficult than dependence analysis. Hence, most of the parallelism discovery tools are still in a prototypical state.
Kremlin
Kremlin [10] is a research parallelism discovery tool developed at University of California, San Diego. It uses the LLVM compiler infrastructure [11] for instrumentation, discovers parallelism based on knowledge of the critical path and supports the programmer in ranking different par-allelization opportunities. To address dependences in nested code regions, Kremlin extends the traditional critical-path analysis [12] by making it hierarchical. For this purpose, it introduces a metric called self-parallelism, which quantifies the parallelism of a parent region independent of its children. Kremlin has an OpenMP planner and a Cilk++ planner to suggest parallelism in two different parallel programming models.
Alchemist
Alchemist [13] is a research parallelism discovery tool developed at Purdue University. It is built on top of Valgrind [14], an instrumentation framework for building dynamic analysis tools, to discover parallelism and issue corresponding recommendations. For each region, Alchemist decides whether the region can run asynchronously with its dynamic context by checking the distance between memory references inside and references to the same location that occur during the region’s continuation. It thus follows the parallelization strategy underlying the use of futures. A future of a write operation is the code section or construct that contains further reads of the written variable. Alchemist also builds an execution index tree at runtime. This tree is used to differentiate among multiple instances of the same static construct.
Compared to Kremlin and other semi-automatic parallelism discovery tools, Alchemist does not target any specific parallel programming model. This approach is less specific and yet more flexible since it leaves the implementation details to the users.
Parwiz
Parwiz [15] is a parallelism discovery tool developed at INRIA and Université de Strasbourg, France. The main component of Parwiz is a data-dependence profiler that works on binary code. It uses the Intel XED [16] x86 encoder decoder software library to parse the binary, and uses Pin [17] to instrument the program. Data dependences are extracted based on an execution tree. An execution tree is an unfolded static program hierarchy in one execution, including
individual instructions, loops and their iterations, and routine calls. Every memory access is an ACCESS node in the execution tree, and the path from the root to an ACCESS node is the global iteration vector of the access. By calculating the least common ancestor of two ACCESS nodes, a data dependence can become apparent on multiple levels of the execution tree. The data dependences together with the execution tree can be used to discover trivial parallel loops, bags of tasks, and code transformations.
Parwiz also includes a few optimizations to lower the overhead of dynamic data-dependence profiling. The idea is to combine contiguous memory accesses that always happen “atomically” into a single block to lower the instrumentation and profiling overhead. To achieve this, Parwiz performs static analysis to find nearby individual accesses when the program updates fields of a structure or accesses in a loop that traverses arrays. These optimizations reduce the profiling time by more than 46%.
Tareador
Tareador [18] is a parallelism discovery tool developed at Barcelona Supercomputing Center, Spain. Tareador analyzes sequential code to find a task decomposition. It provides a set of annotations for marking down tasks in the code. In Tareador 1.x, tasks should be annotated by the user. The tool then generates the data dependence graph according to the annotated tasks, the potential parallel execution of the tasks, and visualization of data usage, that is, the amount of data accessed in each task. Tareador works interactively with the user to find a good task decomposition. The user can refine the task annotation according to the output of Tareador, and determine further improvements based on the new output for the refined tasks.
Tareador 2.x automates the iterative process. It follows a top-down approach by first using the most coarse-grain task annotation, that is, taking the whole main function as a single task, and then iteratively refining the decomposition based on a cost model. The cost model contains three metrics, the length cost, the dependence cost, and the concurrency task. The algorithm breaks tasks that have high costs into smaller tasks. A task with high cost means its instances have long duration, many dependences, and low concurrency. The cost model also evaluates the quality of a decomposition, and the algorithm stops when a newly generated decomposition has a lower quality than the previous solution.
Compared to other semi-automatic parallelism discovery tools, Tareador takes a relatively brute-force approach by enumerating possible decompositions. The cost model serves as heuris-tics in the searching process. The approach does not take control flow into consideration, which may lead to tasks that are not easy to implement.
Intel®Advisor XE
Intel Advisor XE [19] is a threading prototyping tool for C, C++, C# and Fortran software architects. Intel Advisor XE answers the following questions:
1. Where to parallelize?
Intel Advisor XE profiles hot spots, that is, code sections (functions and loops, specifically) that consume lots of time to execute, as the parallelization candidates. The criterion is the time spent in a code region, and data dependences are not taken into account. Thus, a profiling in this phase is very close to whatgprofdoes. This phase is called “survey”. To accomplish the survey the source code needs to be compiled in release mode.
The programmer needs to read the code in hot spots, understand its behavior, and insert annotations (provided by Intel Advisor XE) to mark down potential parallelism. Thus, the actual parallel pattern is discovered by the programmer but not the tool. This phase is called “annotation”. To annotate the code the programmer needs to include the corre-sponding header file that contains the annotations and modify the source code slightly. 2. What is the benefit?
After the annotation, Intel Advisor XE runs the annotated code and emulates the parallel behavior of the annotated code sections. The output is a report containing:
• The estimated overall speedup
• The scalability of the program, from 2 to 512 threads
This phase is called “suitability test”. To accomplish this phase the source code needs to be compiled again with the annotations in release mode. The suitability test usually has a time overhead of less than a factor of two since it does not profile data, but emulates the behavior based on predefined parameters.
3. Which parallel programming model suits the purpose best?
The emulation model of Intel Advisor XE contains different sets of parameters for different parallel programming models. On Windows, the supported ones are TBB, Cilk+, OpenMP and Microsoft TPL. A user can compare the suitability test results in different programming models.
The emulation model covers potential synchronization overheads, too. The user can choose to include or ignore these effects, and the tool can also suggest whether these effects can be ignored or not.
4. What are the potential problems after parallelization?
Intel Advisor XE can also perform a "correctness check", which is essentially a data-race detection. This check targets potential data sharing problems that can lead to deadlocks or races.
To accomplish the correctness check the code needs to be compiled again with annota-tions in debug mode. The correctness check has a huge time overhead. According to the technical documents of the tool, a correctness check may take more than one hour on an annotated region that normally runs in 30 seconds.
Questions that Intel Advisor XE cannot answer:
• How much potential parallelism exits in the sequential code? • What pattern does the potential parallelism follow?
These two questions can only be answered by profiling data dependence dynamically. With-out such information, programmers have to answer these two questions themselves. Moreover, Intel Advisor XE cannot transform the code automatically.
SLX Tool Suite
The SLX Tool Suite [20] is a set of tools for parallel software design automation. The suite contains four tools: SLX Parallelizer, SLX Mapper, SLX Generator, and SLX Explorer. The SLX Tool Suite is developed by Silexica as a commercial product.
The SLX Parallelizer performs C code partitioning by analyzing control and data flow within the original sequential code, exposing parallelism. An additional automatic performance estima-tion allows a fast and accurate predicestima-tion of applicaestima-tion hotspots and performance gains through identified parallelism. The SLX Mapper performs a fully automated mapping of software tasks and processes onto given multi-core hardware platforms. It also computes optimized data and communication mappings, exploiting memory hierarchies, complex on-chip interconnect fab-rics and other memory subsystems, including direct hardware support for FIFO buffers. The SLX Generator follows a source-to-source translation approach that emits architecture-aware and middleware-specific C code as final output. The SLX Explorer facilitates multi-core plat-form selection by means of a flexible retargetable hardware architecture model.
The technologies behind the SLX Tool Suite originates from the MPSoC Application Pro-gramming Studio (MAPS) [21] developed by The Institute for Communication Technologies and Embedded Systems (ICE) of RWTH Aachen University, Germany. MAPS identifies task par-allelism in C applications for MPSoC platforms based on the notion of acoupled block, which is a single-entry single-exit group of statements tightly coupled by dependences. In the end, a coupled block is treated as a task.
Prism
The Prism Technology Platform [22] is an framework to develop new analysis, visualization or runtime techniques to meet the needs of a particular project. It is an in-house framework developed by Critical Blue, a company based in the UK. Regarding parallelization, the Prism Technology Platform provides the following basic analyses for sequential programs:
• Data-dependence analysis for multicore • Parallelism ’what-if’ modeling
• Multicore scalability modeling
• Dynamic and static code translation • Multicore data race detection
Prism is built on dynamic binary-level analysis which supports the dynamic instrumentation of compiled software running on most hardware platforms. This allows the capture of per-formance data down to the detail of individual instruction execution. However, since Prism is an in-house tool and not sold as a product, it is not clear how Prism perform the analyses. For example, we do not know whether the binary-level analysis checks the machine instruc-tions statically or instruments the code. According to the official website of Prism, it models the parallel behavior of sequential programs with potential parallelism marked down by users (parallelism ’what-if’ modeling) rather than suggesting the parallelism. This is similar to Intel Advisor XE.
Others
Besides the more well-known ones, there are many semi-automatic parallelism discovery tools that are tailored to specific types of programs or programming languages. JavaSlicer [23] traces Java programs to find parallelism, exploiting knowledge of the critical path. ParaMeter [24] is a tool aiming to find parallelism in task-based applications where computational tasks are added dynamically. It employs a speculative scheduler to decide whether two tasks can be executed concurrently. The tool developed by Tournavitis and Franke [25] and the tool developed by Thies et al. [26] target coarse-grained pipeline-style parallelism in multimedia applications.
1.3.3 Automatic Parallelization Tools
Parallelization assisting tools that fall into the third category aim to automatically convert the sequential code into parallel code. Such tools are known as automatic parallelization tools. Automatic parallelization tools further fall into two categories: compile-time tools and runtime tools. Compile-time tools work like compilers or plugins of a compiler. They perform compile-time analysis to identify code fragments that can run in parallel, and transform the sequential code into equivalent parallel code in either a source-to-source or source-to-binary way. Runtime tools, on the other hand, executes fragments of code that were originally intended to run se-quentially in parallel by simply assuming the fragments can be executed in parallel. To ensure correctness, runtime tools check violation of dependences on-the-fly, and fall back to sequential execution when necessary. This approach is also called speculative parallelization. Due to the difficulty of automatic task decomposition and code transformation, automatic parallelization tools usually focus on loop parallelism. This applies to both compile-time and runtime tools.
Speculative parallelization has hardware and software solutions. However, many ideas and concepts can be implemented in either way. For this reason, we focus on representative soft-ware solutions in this thesis to avoid introducing essential hardsoft-ware backgrounds, which is less
relevant to the other parts of this thesis. A complete survey on speculative parallelization can be found in the work of Estebanez et al. [27].
Intel®C++ Compiler
One well-known compile-time automatic parallelization tool is the Intel C++ Compiler [28], also known asiccoricl. The Intel C++ Compiler is a group of C and C++ compilers. Compared to other C and C++ compilers, the Intel C++ Compiler specializes in generating optimized code for Intel processors, including processors based on IA-32 and Intel 64 architectures, ATOM processors, and the Intel Xeon Phi coprocessor.
The Intel C++ Compiler supports automatic parallelization of loops. This feature can be enabled by specifying the-Qparallel (Windows) or -parallel(Linux or Mac OS X) option on the command line. When automatic parallelization is enabled, The Intel C++ compiler performs data-dependence analysis on loops, and generates parallel code that divides the iter-ations as evenly as possible for loops that are recognized as good candidates. A loop can be parallelized by The Intel C++ Compiler only if it satisfies three requirements [29]. First, the number of iterations must be known in compile time. That means awhileloop usually cannot be parallelized. Second, there are no control flow jumps into or out of the loop. That means a single break statement is usually enough to prevent parallelization. Finally, there must be no data dependences among iterations. However, data dependences due to trivial reductions scenarios such as adding the elements in an array can be resolved automatically.
A technical report [29] from Intel states that “Potential aliasing of pointers or array refer-ences is a common impediment to safe parallelization”, and “If the compiler cannot prove that pointers or array references are safe and that iterations are independent, it will not parallelize the loop”. These statements give a clear clue that the Intel C++ compiler utilizes static data-dependence analysis for parallelism discovery. Details of static data-data-dependence analysis and pointer aliasing analysis are described in Section 2.1. Moreover, the Intel C++ Compiler can-not determine the thread-safety of a loop containing external function calls because it does can-not know whether the function call has side effects that introduce dependences [29].
Polly
Polly [30] is a high-level loop and data-locality optimizer and optimization infrastructure for LLVM. It is an open-source tool originally developed by Tobias Grosser and Hongbin Zheng. Now the source code of Polly is integrated into the LLVM official repository and released according to the same schedule as LLVM.
Polly uses an abstract mathematical representation based on integer polyhedra to analyze and optimize the memory access pattern of a program. Polly mainly focuses on classical loop transformations, especially loop tiling and loop fusion to improve data locality. It can also exploit OpenMP level parallelism and expose SIMDization opportunities.
Polly adopts a static technique calledpolyhedral compilation. It uses a high-level mathemati-cal representation based on polyhedra [31] or Presburger relations [32] to analyze and optimize computer programs. The polyhedral model can be used to obtain data dependences statically. Compared to classic static data-dependence analysis (introduced in Section 2.1), polyhedral model is much more powerful in extracting data dependences from regular accesses to arrays, which is one of the most common memory access patterns in scientific numerical programs.
Results of testing Polly on Polybench 2.0, a test suite that contains computation kernels from linear algebra routines, stencil computations, image processing and data mining, are also published. The results show that 16 programs out of 30 get major speedup, where 8 programs have speedups bigger than 10 using 24 threads.
Polly is not the only polyhedral optimizer though, and polyhedral optimization is still an ac-tive area of research. GCC has a polyhedral optimization framework called Graphite [33], and there are many other polyhedral optimization frameworks such as Omega [34], PolyLib [35], and CLooG [36]. Classic polyhedral optimization requires that the loop bounds and conditions of loop statements are affine functions of the surrounding loop iterators and parameters. Benab-derrahmane et al. [37] proposed a method that extends the polyhedral model to supportwhile loops, in which loop bounds are non-affine. The method transformswhileloops intoforloops withifbranches to process the loop conditions.
LRPD test
The LRPD test [38] is the origin of software thread-level speculative parallelization. The method executes chunks of iterations of the target loop speculatively, and perform the LRPD test in the end to validate the execution. If the test failed, the target loop is re-executed sequentially.
To lower the possibility that the LRPD test fails, the method firstly transform the target loop through privatization and reduction parallelization. Privatization is to making private copies of shared variables. Reduction parallelization is to identify reduction operations at compile time and replacing the reduction operations with a parallel algorithm. The method then assumes the transformed loop has no inter-iteration dependences.
Apollo
Apollo [39, 40, 41] is a compiler framework dedicated to automatic, dynamic and specula-tive parallelization and optimization of programs’ loop nests. It is developed at Inria and the University of Strasbourg, France. Apollo is a modern runtime tool that supports speculative parallelization.
Apollo consists of two main components. The first component is a set of extensions to the CLANG-LLVM compiler that prepare the program. Specifically, the first component generate two other versions of the program along with the original sequential code: 1) an instrumented version in which memory instructions and updates of scalar values are instrumented, and 2)
code bones [42], which are essentially templates of code fragments that can be instantiated at runtime. The second component is a runtime system. The runtime system firstly executes the instrumented version for a small number of iterations to collect memory access information and scalar values. Then it builds a predication model to select an optimal polyhedral transformation for each target loop nest. Once the optimal transformation is decided, it instantiate the code bones to generate the parallel code. The generated parallel code is speculative. In case of in-validation, the original sequential version that contains the chunk of iterations are re-executed, and instrumented version is relaunched to determine a new parallelization strategy.
ParallWare
ParallWare [43] is an auto-parallelizing source-to-source compiler for sequential applications. It is a commercial tool developed by Appentra.
ParallWare automatically discovers the parallelism available in the input sequential code, and generates equivalent parallel source code annotated with compiler directives. The targets are HPC systems based on multi-core processors. ParallWare supports OpenMP and OpenACC. The technical features of ParallWare are:
• Auto-parallelization of convergence loops and propagation loops in scientific numerical applications
• Auto-parallelization of parallel reductions • Auto-parallelization of for loop nests
• Auto-parallelization of source codes with n-dimensional arrays
• Auto-parallelization of inter-procedural code (e.g., intrinsic and non-intrinsic functions)
Par4All
Par4All [44] is an automatic parallelizing and optimizing compiler that supports programs writ-ten in C and FORTRAN. It is an open-source tool maintained by the community, which is mainly supported (technically) by three organizations: SILKAN, MINES ParisTech and Institut TÉLÉ-COM/TÉLÉCOM Bretagne/HPCAS.
Par4All is based on the PIPS (Parallelization Infrastructure for Parallel Systems) source-to-source compiler framework. The “p4a” is the basic script interface to produce parallel code from user sources. It takes C or FORTRAN source files and generates OpenMP or CUDA output to run on shared memory multicore processors or GPUs, respectively.
As a compiler, Par4All concentrates on static analyses and mainly transforms loops. Par4All covers many code-generation optimizations, including loop fusion, point-to analysis, and vec-torization. Features like automatic instrumentation for loop parameter extraction at runtime are expected in version 2.0.
Par4All offers official evaluation results. On the program 410.bwaves from the SPEC CPU2006 benchmarks, Par4All achieves a speedup of 4.5 with two Intel Xeon X5670 pro-cessors at 2.93GHz (12 cores). On an ordinary matrix multiplication program, it achieves a speedup of 12.1 on the same platform.
PLUTO
PLUTO [45, 46] is an automatic parallelizer and locality optimizer for multi-core programs. It is an open-source tool developed by a team from Ohio State University and Louisiana State University.
Based on the polyhedral model [31], PLUTO transforms sequential C programs to equivalent parallel code. It focuses on coarse-grained parallelism, dealing with big code sections such as entire loop nests. The core transformation framework mainly works by finding affine transfor-mations for efficient loop tiling and loop fusion. The generated OpenMP programs can achieve outer, inner, or pipelined parallelization of loop nests purely with OpenMP directives. PLUTO also has a version generating CUDA code, but it is no longer maintained.
Cetus
Cetus [47] is a compiler infrastructure for the source-to-source transformation of software pro-grams. It is an open-source tool developed by a team from Purdue University.
Cetus is not a dedicated automatic parallelization tool itself, but provides a basic infras-tructure for writing such tools or compilers. The basic parallelizing techniques Cetus currently implements are privatization, reduction-variable recognition, and induction variable substitu-tion. The latest version of Cetus also includes a GUI, speedup calculation and graph display, and the Cetus remote server. The Cetus remote server allows users to transform C code through the server. Cetus also has an experimental Hubzero [48] version that allows users to transform C code through a web browser.
Others
Other than the tools mentioned above, Tournavitis et al. [49] applies machine learning tech-niques to find parallelism in loops and automatically parallelize them using OpenMP. Sam-bamba [50] integrates three parallelism enabling technologies into one framework: speculation, privatization, and reduction. Instead of performing the classic static analysis on the program dependence graph (PDG), Sambamba solves the problem using integer linear programming (ILP).
1.3.4 Review of the Existing Tools and the Scope of This Thesis
We have introduced the state-of-the-art parallelism discovery tools in the previous sections. Based on the available information from the published documents and papers, we summarize the existing parallelism discovery tools as follows:
1. There is still no mature parallelism discovery tool that works for general-purpose pro-grams with irregular access patterns. Companies that are strong in building program analysis tools sell “parallelism discovery for general-purpose programs” as a service since strong intervention from domain experts and experienced programmers are needed to build such tools. Moreover, automatic code transformation for general-purpose programs is considered to be far beyond the state-of-the-art.
2. On the other hand, parallelism discovery and automatic parallelization for loop-structured programs have been fully automatic. They are either based on the polyhedral model or speculative execution. Although the underlying theory is mature, the techniques build on top of it are still considered advanced. Polyhedral model is limited by its restriction to affine loop nests. Speculative execution can extract parallelism from irregular loops, but it introduces a higher runtime overhead and energy consumption. Furthermore, many tools such as ParallWare and Par4All are still under construction for supporting many core processors (GPUs or accelerators). Building a parallel compiler or front-end is the most popular approach to building automatic parallelization tools.
3. So far, static analysis has been the most widely adopted approach in state-of-the-art tools. The reason is simple: the overhead of the analyses must be low enough to make the tool practical. Among all the tools introduced in this thesis, only Intel Advisor XE and Cetus use profiled runtime data and show the users about the potential time overhead of the profiling. Consequently, there is still no mature technique to lower the overhead of dynamic analyses to a reasonable level.
To narrow the technical gap, this thesis focuses on
• A dynamic data-dependence analysis that has low overhead in terms of both time and memory
• A parallelism discovery approach for general-purpose programs
We do not cover automatic sequential-to-parallel code transformation in this thesis. For sci-entific numerical programs, several automatic parallelization tools exist. For general-purpose programs, information obtained through program analyses is usually not enough for automatic sequential-to-parallel code transformation. The semantics of the program or the programmer’s intentions must be preserved. A detailed discussion is deferred to Section 4.5.
1.4 Introduction to LLVM
The methods presented in this thesis are built on top of the Low Level Virtual Machine (LLVM), which is a collection of modular and reusable compiler and toolchain technologies. Despite its name, LLVM has little to do with traditional virtual machines, though it does provide helpful libraries that can be used to build them. The name “LLVM” itself is not an acronym; it is the full name of the project. [51]
LLVM began as a research project at the University of Illinois, with the goal of providing a modern, SSA-based compilation strategy capable of supporting both static and dynamic compi-lation of arbitrary programming languages. Nowadays, the LLVM project has grown and holds a huge collection of compiler-related tools. Depending on the context, the name “LLVM” might refer to any of the following:
• The LLVM project. This is an umbrella for several projects that together form a complete compiler: frontends, backends, optimizers, assemblers, linkers, and so on.
• An LLVM-based compiler. This is a compiler built partially or completely with the LLVM infrastructure. For example, a compiler might use LLVM for the frontend and backend but use GCC and GNU system libraries to perform the final link.
• LLVM libraries. This is the reusable code portion of the LLVM infrastructure. • The LLVM IR.This is the LLVM compiler intermediate representation. [52]
In this thesis, the term “LLVM” mostly refer to the LLVM libraries, and the LLVM IR. The meaning should be clear in a given context. Since our approach is built on top of LLVM, it is necessary to introduce its primary components, or subprojects, that are used in this thesis:
• LLVM core. The libraries that provide a modern source- and target-independent optimizer, along with code generation support for many popular CPUs.
• Clang. Clang is an “LLVM native” C/C++/Objective-C compiler, which aims to deliver amazingly fast compiles as well as extremely useful error and warning messages and to provide a platform for building source level tools.
• Compiler-rt. The compiler-rt project provides highly tuned implementations of the low-level code generator support routines such as “__fixunsdfdi” and other calls generated when a target does not have a short sequence of native instructions to implement a core IR operation. [52] It also provides implementations of runtime libraries for dynamic analysis tools.
The work presented in this thesis are highly related to the LLVM Intermediate Representation and the LLVM Pass Framework. In the following sections, we introduces them in detail.
1.4.1 The LLVM Intermediate Representation
The LLVM Intermediate Representation (IR) is the backbone that connects frontends and back-ends, allowing LLVM to parse multiple source languages and generate code for multiple targets. Frontends produce the IR, while backends consume it. The IR is also the point where the majority of LLVM target-independent optimizations take place. [52]
The LLVM project started with an IR that operated at a lower level than Java bytecode, thus, the initial acronym was Low Level Virtual Machine. The idea was to explore low-level optimization opportunities and employ link-time optimizations. The link-time optimizations were made possible by writing the IR to disk, just like bytecode. Nowadays, LLVM is neither a Java competitor nor a virtual machine, and it has other intermediate representations to achieve efficiency. In LLVM terms, LLVM IR has two forms: assembly and bitcode. LLVM assembly means the human-readable code, and LLVM bitcode means the binary format. They are equivalent in terms of functionality.
In general, LLVM IR has the following properties:
• Static Single Assignment (SSA) form. In the SSA form, names correspond uniquely to specific definition points in the code and each name is defined by one operation, hence the name static single assignment. To reconcile this single-assignment naming discipline with the effects of control flow, the SSA form inserts special operations calledφ-functions at points where control-flow paths meet. [6]
• Three-address code. In the three-address code, most operations have the form i ← j
op k, whereopis the operator,jandkare the operands, andiis the result.
• Infinite number of registers. Note that local values in the LLVM IR can be any name that starts with the %symbol, and there is no restriction on the maximum number of distinct values.
The content of an entire LLVM file, either assembly or bitcode, is said to define an LLVM
module. The module is the LLVM IR top-level data structure. Each module contains a sequence
of functions, which contain a sequence of basic blocks, which contain a sequence of instructions. The module also contains peripheral entities to support this model, such as global variables, the target data layout, and external function prototypes as well as data structure declarations.
Figure 1.2 shows an LLVM IR assembly file, or, a module. The target datalayout con-struct contains information about endianness and type sizes for the target described intarget
triple. In the example shown in Figure 1.2, the target is an x86_64processor PC with an a
Linux operating system. It is a little-endian target, which is denoted by the first letter in the layout (a lowercase e). Big-endian targets need to use an uppercase E.
The definition of functionfooin this example is : define i32 @_Z3foov() #2 {...}