Comparison of MBA and HPLC Post-column Oxidation Methods
for the Quantification of Paralytic Shellfish Poisoning Toxins
Hongsik Yu
1, Keun Sik Lim
1, Ki Cheol Song
2, Ka Jeong Lee
1, Mi Ae Lee
1and Ji Hoe Kim
1* 1Food Safety Division, National Fisheries Research and Development Institute, Busan 619-705, Korea2West Sea Fisheries Institute, National Fisheries Research and Development Institute, Incheon 400-420, Korea
Abstract
The mouse bioassay and high performance liquid chromatography (HPLC) post-column oxidation method are different methods of quantifying paralytic shellfish poisoning toxins. In this study, we compared their ability to accurately quantify the toxicity levels in two types of field sample (oysters and mussels) with different toxin profiles for routine regulatory monitoring. A total of 72 samples were analyzed by both methods, 44 of which gave negative results, with readings under the limit of detection of the mouse bioassay (40 μg/100 g saxitoxin [STX] eq). In 14 oysters, the major toxin components were gonyautoxin (GTX) 1, -2, -3, -4, -5, decarbamoylgonyautoxin-2 (dcGTX2), and decarbamoylsaxitoxin (dcSTX), while 14 mussels tested positive for dcSTX, GTX2, -3, -4, -5, dcGTX2, neosaxitoxin (NEO), STX, and dcSTX. When the results obtained by both methods were compared in two matrices, a better correlation (r2 = 0.9478) was obtained for mussels than for oysters (r2 = 0.8244). Additional studies are therefore needed in oysters to investigate the differences in the results obtained by both methods. Importantly, some samples with toxin levels around the legal limit gave inconsistent results using HPLC-based techniques, which could have a strong economic impact due to enforced harvest area closure. It should therefore be determined if all paralytic shellfish poisoning toxins can be quantified accurately by HPLC, and if the uncertainties of the method lead to doubts regarding regulatory limits.
Key words:
Mouse bioassay, Post-column oxidation method, PSP toxins, Regulatory limitsIntroduction
Paralytic shellfish poisoning (PSP) is caused by the con-sumption of shellfish containing neurotoxins produced by nat-urally occurring phytoplankton groups such as Alexandrium
spp. and Gymnodinium spp. Importantly, these toxins cannot be destroyed by common processing steps, including cook-ing (Diener et al., 2006). One example of such a neurotoxin is saxitoxin (STX), 57 analogues of which were reported re-cently (Wiese et al., 2010). The health standards of most coun-tries dictate that live bivalve mollusks for human consump-tion must not contain total PSP toxin levels exceeding 80 μg/ 100 g STX eq.
PSP toxins block excitation currents in nerve and muscle
cells, ultimately resulting in paralysis and death (Luckas et al., 2004). Testing shellfish for the presence of PSP family tox-ins is therefore critical for both consumers and the shellfish industry. The mouse bioassay (MBA) has been the preferred testing method worldwide for over 50 years, and is the of-ficial method of AOAC International (Association of Ofof-ficial Analytical Chemists, 2005). The time from exposure to death in the MBA is used to estimate the amount of toxin present in shellfish, and the assay has a detection limit of 40 μg/100 g STX eq. MBA has the additional advantages of reporting the total toxicity of samples in a short period of time, and it does not require specific instruments. Although the MBA is a
reli-Received 12 August 2013; Revised 22 August 2013
Accepted 23 August 2013
*Corresponding Author
E-mail: [email protected] http://dx.doi.org/10.5657/FAS.2013.0159
Open Access
This is an Open Access article distributed under the terms of the Creative Commons Attribution Non-Commercial License (http://creativecommons. org/licenses/by-nc/3.0/) which permits unrestricted non-commercial use, distribution, and reproduction in any medium, provided the original work is properly cited. pISSN: 2234-1749 eISSN: 2234-1757
acetonitrile. 3) Post-column oxidant—a 100 mM phosphoric acid, 5 mM periodic acid solution adjusted to pH 7.8 with 5 M sodium hydroxide. 4) Post-column acid—0.75 M nitric acid.
Standards
Certified reference materials were purchased from the In-stitute for Marine Biosciences, National Research Council (NRC) of Canada. The following standards were used: C1 (N-sulfocarbamoylgonyautoxin-C1), C2 (N-sulfocarbamo-ylgonyautoxin-C2), dcGTX2 (decarbamoylgonyautoxin-2), dcGTX3 (decarbamoylgonyautoxin-3), dcSTX (decarbamoyl saxitoxin), GTX1 (gonyautoxin-1), GTX2 (gonyautoxin-2), GTX3 (gonyautoxin-3), GTX4 (gonyautoxin-4), GTX5 (go-nyautoxin-5), NEO (neosaxitoxin), and STX (saxitoxin). All individual stock solutions were prepared following the NRC instructions. Two working solutions were then prepared, the first containing dcGTX2, dcGTX3, dcSTX, GTX1, GTX2, GTX3, GTX4, GTX5, NEO, and STX, and the second con-taining C1 and C2.
Sample preparation
Farmed oysters Crassostrea gigas and mussels Mytilus galloprovincialis that were harvested from coastal regions of Tongyeong City and Geoje City during the spring of 2010, as part of the marine biotoxin control program of the National Fisheries Research and Development Institute, were analyzed in this study. On receipt, the outside of the shellfish were cleaned with fresh water, and they were then shucked into a No. 10 sieve, and drained for 5 min. PSP toxins were extracted from 100-g samples of homogenized shellfish tissue following the AOAC MBA method 959.08 (Association of Official Ana-lytical Chemists, 2005) using 0.1 M HCl. To deproteinate the samples for high performance liquid chromatography (HPLC) analysis, 25 μL 30% (w/v) trichloroacetic acid (TCA) were added to 500 μL shellfish extract in a microcentrifuge tube, which was then mixed in a vortex mixer and centrifuged at 16,000 g for 5 min. Twenty microliters of 1.0 M NaOH were added to neutralize the solution, which was mixed and then centrifuged at 16,000 g for 5 min. Finally, the solution was filtered through a 0.2 μm syringe filter into an autosampler vial in preparation for LC analysis.
HPLC post-column oxidation analysis
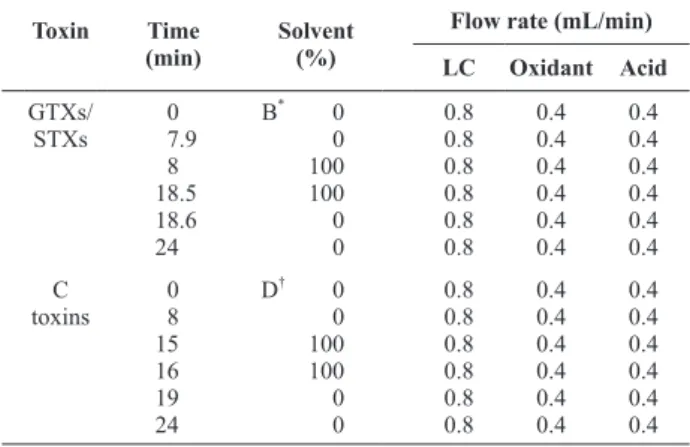
For the analysis of GTXs and STXs, the LC system was equilibrated for a minimum of 20 min at a column oven tem-perature of 40°C with a 100% solvent A flow at 0.8 mL/min. For the analysis of C toxins, the LC system was equilibrated for a minimum of 20 min at a column oven temperature of 15°C, with 100% solvent C flowing at 0.8 mL/min. Aliquots of working solutions or sample extracts (10 μL for GTXs and STXs, and 5 μL for C toxins) were injected into the HPLC sys-able method, there is ethical pressure to eliminate testing with
animals (Balls et al., 1995; Hess et al., 2006). In addition, the MBA provides no toxin profiles, and is subject to considerable variability (Park et al., 1986).
Alternative methods to reduce the use of MBA testing for PSP toxins in a regulatory environment are therefore becom-ing desirable. The LC-FLD method was successful in an inter-laboratory study (Association of Official Analytical Chemists, 2006), and was accepted by the Association of Official Ana-lytical Chemists (AOAC) as the first anaAna-lytical alternative to the MBA. However, this method was overly time-consuming for the routine regulatory monitoring of shellfish for PSP tox-ins, and cannot distinguish between isomeric toxins that may exhibit significantly different toxicities. Recently, a new high performance liquid chromatography post-column oxidation method (HPLC PCOX) was published; this involves in shorter run times, and demonstrated potential as an alternative to the MBA in our previous study (Song et al., 2013). The aim of this study was to compare the MBA and HPLC PCOX meth-ods, and evaluate their ability to accurately assess the toxicity levels of two types of field sample with different toxin profiles for routine regulatory monitoring.
Materials and Methods
HPLC equipment
A Finnigan Surveyor Plus HPLC system, equipped with a Finnigan Surveyor FL Plus Detector (Thermo Electron, San Jose, CA, USA), was operated at an excitation wavelength of 330 nm and an emission wavelength of 390 nm. The Post-column Derivatization (Pickering Laboratories, Moun -tain View, USA) was capable of main-taining temperature at 85°C. The chromatographic columns used were Zorbax Bo -nus RP 4.6 × 150 mm, 3.5 μm (Agilent, Santa Clara, CA, USA) for the analysis of GTXs & STXs, and Phenosphere-NEXT 4.6 × 250 mm, 5 μm (Phemomenex, Torrance, USA) for the analysis of C toxins.
Reagents
All solvents and reagents were of HPLC grade, and all mo-bile phase and post-column reagents were filtered through a 0.45-μm membrane before use. The mobile phases used were as follows: 1) HPLC mobile phases for GTXs and STXs—sol-vent A, 11 mM heptane sulfonate and 5.5 mM phosphoric acid solution adjusted to pH 7.1 with ammonium hydroxide; sol-vent B, 11 mM heptane sulfonate, 16.5 mM phosphoric acid, 11.5% acetonitrile solution adjusted to pH 7.1 with ammonium hydroxide. 2) HPLC mobile phases for C toxins—solvent C, 2 mM tetrabutyl ammonium phosphate solution adjusted to pH 5.8 with 1% ammonium hydroxide; solvent D, 2 mM tetrabu-tyl ammonium phosphate solution adjusted to pH 5.8 with 4%
Mouse bioassay
One milliliter of HCl extract was intraperitoneally inject-ed into 17-23 g mice following the AOAC Official Method 959.08 (Association of Official Analytical Chemists, 2005), and the death times were recorded. The concentrations of PSP toxins were then calculated, and presented as μg/100 g STX eq sample using Sommer’s Table.
Results and Discussion
Comparison of the HPLC PCOX and MBA methods
The HPLC PCOX method used an extraction procedure similar to that of the MBA. Toxins were separated using ion-pair chromatography on a reverse-phase column, oxidized with periodate/phosphate buffer, and detected using fluores-cence (Rourke et al, 2008). This method showed high sample throughput and was rapid, suggesting it to be a viable alterna-tive to the MBA for routine monitoring, consistent with our previous single laboratory validation study (Song et al., 2013).
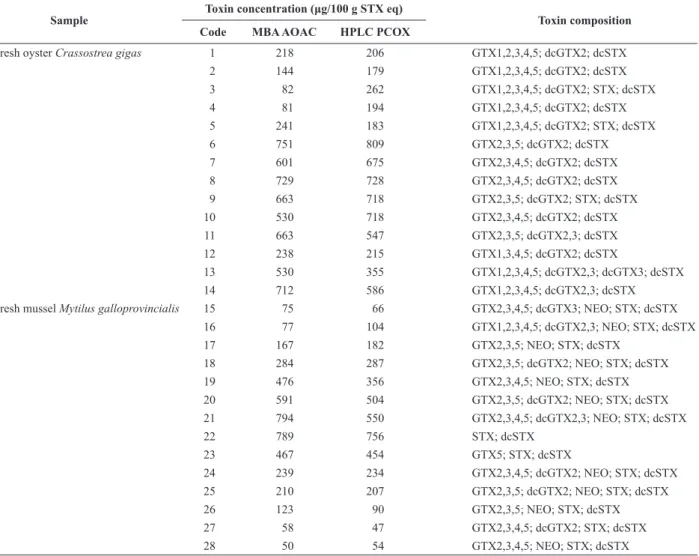
To compare the HPLC PCOX with MBA, we tested field samples using different matrices. A total of 72 samples of mussels and oysters were analyzed by both methods. Forty-four samples gave a negative result, which was under the limit of detection (LOD) of the MBA (40 μg/100 g STX eq). Table 3 lists the 28 samples that gave results above the MBA LOD, including the description of the shellfish species, the scientific name, results obtained by both methods, and the toxin compo-sition. The major toxins in the oysters were GTX1, -2, -3, -4, -5, dcGTX2, and dcSTX, whereas GTX2, -3, -4, -5, dcGTX2, NEO, STX, and dcSTX were detected in mussels. C toxins were not detected in any of the samples.
In 8 of 14 oysters (sample codes 2, 3, 4, 5, 6, 10, 11, and 13), a large positive or negative bias (relative standard devia-tions greater than 15%) was obtained using the MBA or HPLC PCOX (Fig. 1). A comparison of the results of both methods for oysters indicated a linear correlation of r2 = 0.8244 (Fig. 2). However a negative bias of the HPLC PCOX method was obtained in two mussels (sample codes 20 and 21) (Fig. 3). A comparison of the results of both methods for mussels indi-cated a better linear correlation of r2 = 0.9478 (Fig. 4). When the results obtained by both methods were compared in two matrices, a good correlation for mussels was obtained, but a relatively poor correlation for oysters. Turner et al. (2010) pre-viously analyzed some oyster samples using HPLC PCOX, an electrophysiological assay, and a hydrophilic interaction liq-uid chromatography with tandem mass spectrometric detec-tion. The results obtained using the other methods showed a good correlation, suggesting that the difference may be due to either an under- or overestimation by MBA and/or the HPLC method. Turner et al. (2012) reported that the presence of some metals (particularly zinc, which is present in oyster ma-tem, and separated using the gradient conditions shown in
Ta-ble 1. Separated toxins were derivatized using a post-column reaction module (with an oxidant flow rate of 0.4 mL/min, an acid flow rate of 0.4 mL/min, a reaction oven temperature of 85°C, and a reaction coil of 5 m × 0.50 mm id). The deriva-tives were then detected by florescence.
The amount (μmoles of STXeq) of each toxin in the sample extracts was calculated using the linear regression of the cali-bration graph, and the specific relative toxicity of each indi-vidual PSP toxin was determined (Table 2). To compare the data with MBA results, the total toxicity of the samples was calculated by totaling the μg/100 g STXeq for each toxin us-ing followus-ing equation (Song et al., 2013):
μg/100 g STX eq = ∑ [μM × 0.3722 × (Fvol/Ext.vol) × (10/Wt) × ReTx].
Where μM = concentration in the extract; 0.3722 = mg STX/μmole; Fvol = final volume of the deproteinated extract (560 μL); Ext.vol = volume of crude extract (500 μL); Wt = sample weight; and ReTx = relative toxicity to STX.
Table 1.
Step gradient conditions for toxins analysis and post-column oxidationToxin Time
(min) Solvent (%)
Flow rate (mL/min) LC Oxidant Acid GTXs/ STXs 7.90 8 18.5 18.6 24 B* 0 0 100 100 0 0 0.8 0.8 0.8 0.8 0.8 0.8 0.4 0.4 0.4 0.4 0.4 0.4 0.4 0.4 0.4 0.4 0.4 0.4 C toxins 0 8 15 16 19 24 D† 0 0 100 100 0 0 0.8 0.8 0.8 0.8 0.8 0.8 0.4 0.4 0.4 0.4 0.4 0.4 0.4 0.4 0.4 0.4 0.4 0.4 GTX, gonyautoxin; STX, saxitoxin.
*,†Solvents for elution of each toxin group by step gradient.
Table 2.
Relative toxicity of paralytic shellfish toxinsToxin ReTx* Toxin ReTx
Saxitoxin 1.0000 GTX5 0.0644 NEO 0.9243 dcSTX 0.5131 GTX1 0.9940 dcGTX2 0.1538 GTX2 0.3592 dcGTX3 0.3766 GTX3 0.6379 C1 0.0060 GTX4 0.7261 C2 0.0963
ReTX, relative toxicity to saxitoxin; GTX, gonyautoxin; NEO, neosaxitoxin; dcSTX, decarbamoylsaxitoxin; dcGTX, decarbamoylgonyautoxin; C1, N-sulfocarbamoylgonyautoxin-C1; C2, N-sulfocarbamoylgonyautoxin-C2.
Table 3.
Sample information and toxin profileSample Toxin concentration (μg/100 g STX eq) Toxin composition Code MBA AOAC HPLC PCOX
Fresh oyster Crassostrea gigas 1 218 206 GTX1,2,3,4,5; dcGTX2; dcSTX
2 144 179 GTX1,2,3,4,5; dcGTX2; dcSTX 3 82 262 GTX1,2,3,4,5; dcGTX2; STX; dcSTX 4 81 194 GTX1,2,3,4,5; dcGTX2; dcSTX 5 241 183 GTX1,2,3,4,5; dcGTX2; STX; dcSTX 6 751 809 GTX2,3,5; dcGTX2; dcSTX 7 601 675 GTX2,3,4,5; dcGTX2; dcSTX 8 729 728 GTX2,3,4,5; dcGTX2; dcSTX 9 663 718 GTX2,3,5; dcGTX2; STX; dcSTX 10 530 718 GTX2,3,4,5; dcGTX2; dcSTX 11 663 547 GTX2,3,5; dcGTX2,3; dcSTX 12 238 215 GTX1,3,4,5; dcGTX2; dcSTX 13 530 355 GTX1,2,3,4,5; dcGTX2,3; dcGTX3; dcSTX 14 712 586 GTX1,2,3,4,5; dcGTX2,3; dcSTX
Fresh mussel Mytilus galloprovincialis 15 75 66 GTX2,3,4,5; dcGTX3; NEO; STX; dcSTX
16 77 104 GTX1,2,3,4,5; dcGTX2,3; NEO; STX; dcSTX 17 167 182 GTX2,3,5; NEO; STX; dcSTX 18 284 287 GTX2,3,5; dcGTX2; NEO; STX; dcSTX 19 476 356 GTX2,3,4,5; NEO; STX; dcSTX 20 591 504 GTX2,3,5; dcGTX2; NEO; STX; dcSTX 21 794 550 GTX2,3,4,5; dcGTX2,3; NEO; STX; dcSTX 22 789 756 STX; dcSTX 23 467 454 GTX5; STX; dcSTX 24 239 234 GTX2,3,4,5; dcGTX2; NEO; STX; dcSTX 25 210 207 GTX2,3,5; dcGTX2; NEO; STX; dcSTX 26 123 90 GTX2,3,5; NEO; STX; dcSTX 27 58 47 GTX2,3,4,5; dcGTX2; STX; dcSTX 28 50 54 GTX2,3,4,5; NEO; STX; dcSTX
STX, saxitoxin; MBA AOAC, mouse bioassay Association of Official Analytical Chemists; HPLC PCOX, high performance liquid chromatography post-column oxidation method; GTX, gonyautoxin; dcGTX, decarbamoylgonyautoxin; dcSTX, decarbamoylsaxitoxin; NEO, neosaxitoxin.
HPLC PCOX (µg/100 g STX eq) 0 100 200 300 400 500 600 700 800 MBA (µ g /100 g STX eq ) 0 200 400 600 800 y = 0.8694x + 71.90 r2 = 0.8244
Fig. 2.
Correlation between mouse bioassay and high performance liquid chromatography post-column oxidation (HPLC PCOX) method foranalysis of paralytic shellfish toxins in oyster (n = 14). STX, saxitoxin; MBA,
mouse bioassay. Sample code µg/100 g STX eq 0 1 2 3 4 5 6 7 8 9 10 11 12 13 14 100 200 300 400 500 600 700 800 900 1,000 HPLC PCOX MBA
Fig. 1.
Paralytic shellfish poisoning toxin concentrations in oyster ob-tained by mouse bioassay and high performance liquid chromatography post-column oxidation (HPLC PCOX) methods. STX, saxitoxin; MBA, mouse bioassay.Performance of both methods in measuring
samples with toxicity around the regulatory limit
Fig. 5 shows the detection of PSP toxins at low levels us-ing both methods. The regulatory limit in Korea (80 μg/100 g STX eq) (Korea Food and Drug Administration, 2013) is also shown in the Figure. Arrows indicate samples that gave in-consistent results concerning the regulatory limit, for example those that were above or below the official limit, depending on the analysis method. Importantly, the measurement of some samples using HPLC PCOX would have an economic impact because they would lead to a ban on harvesting. In cases, such as these, that are close to the regulatory limit, the uncertainty of both methods should therefore be considered before deci-sions allowing or banning the harvesting of shellfish are made. In addition, whether all relevant PSP toxins can be detected by the HPLC PCOX method, and whether the uncertainty of both methods would lead to doubts over the regulatory limits, should be assessed. Investigations of the occurrence of phy-toplankton and long-term and short-term monitoring of each specific area would also be required, and precautionary steps should be taken if necessary. However, this is not possible us-ing samples from an unknown harvestus-ing area (origin). When this occurs, methods that assess the toxicity of the samples rather than the presence of toxins may be more appropriate (Ben-Gigirey et al., 2012).
Adoption of a new method
When considering adoption of a new method into routine monitoring programs, it is important to note that HPLC meth-ods are currently in use, and the number of laboratories using trices) could cause MBA to underestimate toxin levels, while
the presence of metals had no effect on the performance of the HPLC method. Additional toxins (for example neurotoxins, including carbamate and organophosphate insecticides) also elicited a positive response in the MBA (Rourke et al., 2008). Furthermore, MBA performance can be variable when high toxin concentrations are present, which can lead to unexpected results (Botana et al., 1996). Additional studies using oysters are needed to investigate the differences in the data obtained by the different methods.
0 200 400 600 800 1000 0 100 200 300 400 500 600 700 800 HPLC PCOX (µg/100 g STX eq) MBA (µg /100 g STX eq ) y = 0.8054x + 25.01 r2 = 0.9478
Fig. 4.
Correlation between mouse bioassay and high performance liquid chromatography post-column oxidation (HPLC PCOX) method foranalysis of paralytic shellfish toxins in mussel (n = 14). STX, saxitoxin; MBA,
mouse bioassay. Sample code µg/100 g STX eq HPLC PCOX MBA 15 16 17 18 19 20 21 22 23 24 25 26 27 28 100 200 300 400 500 600 700 800 900
Fig. 3.
Paralytic shellfish toxins concentrations in mussel obtained by mouse bioassay and high performance liquid chromatography post-column oxidation (HPLC PCOX) methods. STX, saxitoxin; MBA, mouse bioassay. µg/100 g STX eq 15 16 17 26 27 28 HPLC PCOX MBA Sample code 0 20 40 60 80 100 120 140 160 180 Regulatory limitFig. 5.
Paralytic shellfish toxins toxin concentrations in mussel obtained by mouse bioassay and high performance liquid chromatography post-column oxidation (HPLC PCOX) methods (samples with results <200 μg/100 g saxitoxin [STX] eq by both method). Line presents regulatory limit in Korea. MBA, mouse bioassay.cel Dekker Inc., New York, US, pp. 1147-1169.
DeGrasse SL, van de Riet J, Hatfield R and Turner A. 2011. Pre- versus post-column oxidation liquid chromatography fluorescence de
-tection of paralytic shellfish toxins. Toxicon 57, 619-624. http:// dx.doi.org/10.1016/j.toxicon.2010.12.017.
Diener M, Erler K, Hiller S, Christian B and Luckas B. 2006. Deter
-mination of paralytic shellfish poisoning (PSP) toxins in dietary supplements by application of a new HPLC/FD method. Eur Food Res Technol 224, 147-151. http://dx.doi.org/10.1007/s00217-006-0302-4.
Hess P, Grune B, Anderson DB, Aune T, Botana LM, Caricato P, van Egmond HP, Halder M, Hall S, Lawrence JF, Moffat C, Poletti R, Richmond J, Rossini GP, Seamer C and Vilageliu JS. 2006. Three Rs approaches in marine biotoxin testing: the report and recom
-mendations of a Joint ECVAM/DG SANCO Workshop (ECVAM Workshop 54). Altem Lab Aanim 34, 193-224.
Korea Food and Drug Administration. 2013. Korean Food Standard. Chapter 2. Korea Food and Drug Administration, Cheongwon, KR, pp. 2-26.
Luckas B, Hummert C and Oshima Y. 2004. Analytical methods for paralytic shellfish poisons. In: Manual on Harmful Marine Mi
-croalgae. Hallegraeff GM, Anderson DM and Cembella AD, eds. UNESCO Publishing, Paris, FR, pp. 191-209.
Park DL, Adams WN, Graham SL and Jackson RC. 1986. Variability of mouse bioassay for determination of paralytic shellfish poisoning toxins. J Assoc Off Anal Chem 69, 547-550.
Rourke WA, Murphy CJ, Pitcher G, van de Riet JM, Burns G, Thomas KM and Quilliam MA. 2008. Rapid postcolumn methodology for determination of paralytic shellfish toxins in shellfish tissue. J AOAC Int 91, 589-597.
Song KC, Lee KJ, Yu HS, Mok JS, Kim JH, Lim KS, Lee MA and Kim MH. 2013. Intra-laboratory validation of an HPLC post-column
oxidation method for the analysis of PSP toxins in oysters and
mussels. Korean J Food Sci Technol 45, 241-247. http://dx.doi. org/10.9721/KJFST.2013.45.2.241.
Turner AD, Hatfield RG, Rapkova-Dhanji M, Norton DM, Algoet M and Lees DN. 2010. Single-laboratory validation of a refined AOAC HPLC method 2005.06 for oysters, cockles and clams in U.K. shellfish. J AOAC Int 93, 1482-1493.
Turner AD, Dhanji-Rapkova M, Algoet M, Suarez-Isla BA, Cordova M, Caceres C, Murphy CJ, Casey M and Lees DN. 2012. Inves -tigations into matrix components affecting the performance of the
official bioassay reference method for quantitation of paralytic shellfish poisoning toxins in oysters. Toxicon 59, 215-230. http:// dx.doi.org/10.1016/j.toxicon.2011.11.013.
US Food and Drug Administration. 2009. Guide for the Control of Mol
-luscan Shellfish, 2007 revision. Food and Drug Administration, Center for Food Safety and Applied Nutrition, Washington DC, US.
Wiese M, D’Agostino PM, Mihali TK, Moffitt MC and Neilan BA. 2010. Neurotoxic alkaloids: saxitoxin and its analogs. Mar Drugs 8, 2185-2211. http://dx.doi.org/10.3390/md8072185.
these methods is increasing slowly. The HPLC PCOX tech-nique has been used in a Norwegian monitoring program since 2003 (DeGrasse et al., 2011). In addition, the method was ad-opted by the Canadian monitoring program as a screening tool in 2009, with samples then confirmed by MBA (DeGrasse et al., 2011). The decision regarding which method should be implemented in different regulatory environments may be more of a practical issue than one of scientific merit. In many cases, the availability of equipment and the prevalence of spe-cific toxin components will be the determining factors for any given official control laboratory. Finally, the level of valida-tion or approval of each method may determine whether spe-cific regulatory laboratories implement one method over the other. For example, US National Shellfish Sanitation Program approval determined the method implemented as a regulatory tool in the United States (US Food and Drug Administration, 2009).
Acknowledgements
We thank two reviewers for their valuable comments, which greatly improved the article. This work was funded by a grant from the National Fisheries Research and Development Institute of Korea (RP-2013-FS-034).
References
Association of Official Analytical Chemists. 2005. AOAC Official Method 959.08. Paralytic shellfish poison. Biological method. In: AOAC Official Methods of Analysis. 18th ed. Truckses MW, ed. AOAC International, Gaithersburg, MD, US, pp. 79-80.
Association of Official Analytical Chemists. 2006. Paralytic shellfish poisoning toxins in shellfish. Prechromatographic oxidation and liquid chromatography with fluorescence detection. First action 2005, official method 2005.06. In: Official Methods of Analysis of AOAC International. Horwitz W and Latimer GW, eds. AOAC International, Gaithersburg, MD, US, p. 83.
Balls MB, Goldburg AM, Fentem JH, Broadhead CL, Burch RL, Fest
-ing MFW, Frazier JM, Hendricksen CFM, Jenn-ings M, van der Kamp MDO, Morton DB, Rowan AX, Russell C, Russell WMS, Spielmann H, Stephens ML, Stokes WS, Straughan DW, Yager JD, Zurlo JD and van Zutphen BFM. 1995. The three Rs: the way forward: the report and recommendation of ECVAM Workshop 11. Altem Lab Anim 23, 883-866.
Ben-Gigirey B, Rodriguez-Velasco ML and Gago-Martinez A. 2012. Interlaboratory study for the extension of the validation of 2005.06 AOAC Official Method for dc-GTX-2,3. J AOAC 95, 1-13. Botana LM, Rodriguez-Vieytes M, Alfonso A and Louzao MC. 1996.
Phycotoxins: paralytic shellfish poisoning and diarrhetic shellfish poisoning. In: Handbook of Food Analysis. Nollet LML, ed. Mar