Matthias Meier / Thomas Möhlmann-Mahlau
Underpricing and Performance of
Private Equity-Backed IPOs in Germany –
an Empirical Study
Arbeitsberichte aus der KMU-Forschung der
Fakultät für Wirtschaftswissenschaften der Hochschule Bremen
Herausgeber / Editors: Hans H. Bass und Dietwart Runte
Bremen University of Applied Sciences (Germany)
SME Working Papers No. 3
Underpricing and Performance of Private
Equity-Backed IPOs in Germany - an Empirical Study
Arbeitsberichte aus der KMU-Forschung der
Fakultät für Wirtschaftswissenschaften der Hochschule Bremen
Herausgeber: Hans H. Bass und Dietwart Runte
Veröffentlichungen in der Working Paper Series
unterliegen einem peer-to-peer / double blind Reviewing.
SME Working Papers No. 3 Bremen, Juni 2010
ISSN: 1869-5000 Bestelladresse:
Fakultät für Wirtschaftswissenschaften der Hochschule Bremen Werderstraße 73
28199 Bremen
dekanat@fk1.hs-bremen.de Schutzgebühr € 5,00
Matthias Meier, MBA, studied at Bremen University of Applied Science, Leeds Metropolitan University and the University of Westminster and works as an IFRS analyst for a German Bank.
Thomas Möhlmann-Mahlau is a Professor of Accounting at Bremen University of Applied Science, Germany, since 2002. From 1998 till 2001 he worked as a financial advisor for a world-wide operating consulting company, thereafter as CEO of a medium-sized enterprise. He holds a C.P.A. certificate and has published several books and papers about accounting and finance.
In Germany, private equity investments play a less important role than in other European countries. This study examined the underpricing and performance of private equity-backed IPOs in Germany between 2004 and 2007 by analysing a sample of 77 companies. The IPOs were split into two groups. The first group, consisting of 39 companies, was private equity-backed prior to the IPO. The remaining 38 companies, constituting the second or the control group, however, had no connection with private equity. Furthermore both groups were divided according to size. In total four groups were examined:
1. Large private equity-backed IPOs: 20 companies 2. Small private equity-backed IPOs: 19 companies 3. Large non-private equity-backed IPOs: 19 companies 4. Small non-private equity-backed IPOs: 19 companies
No evidence could be found that private equity-backed IPOs showed a stronger level of underpricing compared to non-private equity-backed IPOs. However, the size of the company played a significant role. The analysed data suggested that as the size of the company increases, the level of underpricing rises accordingly.
Regarding performance it was proven that the ’private equity’ sample achieved better results compared to the ‘non-private equity” sample. This held for different periods of time performance after the IPO had been measured. As the period of time increased, the ’private equity’ sample outperformed the ’non-private equity’ sample to a greater extent.
However, the size of the company proved to be the dominant factor. Large IPOs outperformed smaller IPOs regardless of any private equity involvement. After combining the results concerning performance, a clear hierarchy amongst the four groups was established:
1. Large private equity-backed IPOs generated the highest performance. 2. Large non-private equity-backed IPOs ranked second in the study. 3. Small private equity-backed IPOs attained lower returns.
4. Small non-private equity-backed IPOs generated the lowest performance.
Backed IPOs in Germany – an Empirical Study
1by Matthias Meier and Thomas Möhlmann-Mahlau, Bremen
Contents
1. Introduction... 5
2. Methodology ... 6
3. Underpricing ... 10
4. After Market Performance of IPOs ... 15
5. Conclusion... 23
Appendix ... 25
References ... 30
1. Introduction
According to a study conducted by Deutsche Bank Research (2008) economic growth in Germany would benefit from an increase of private equity investments. If venture capital investments as a percentage of gross domestic product (GDP) would grow by 0.1 per cent, economic growth would accelerate by 0.44 per cent. Early stage investments would even lead to a GDP increase of 1.02 per cent. The German GDP would grow by 0.25 per cent if venture capital investments in Germany reached European average (Deutsche Bank Research 2006). Shapiro and Pham (2008) found evidence that private equity operations have extremely positive effects on U.S. employment, which proves private equity to be an important pillar of the American economy. Furthermore, private equity ownership leads to real value added from sustainable improvements in performance and growths according to a study carried out by Ernst and Young (2007) in the USA and Western Europe. The global average annual EBITDA growth rate of private equity-backed companies was 15 per cent, and thus by 17 per cent higher than for equivalent public companies (Ernst & Young 2007).
However, the private equity sector in Germany suffers from a negative image, which was partly caused by the ’Heuschrecken-debate’ launched by politicians in 2005 and by failure stories of private equity investments in the past. For instance, the behaviour of BC Partners as a private equity investor of Grohe AG caused an outcry. The investor withdrew a huge amount of money and afterwards sold the company to Texas Pacific Group (TBC), another private
1
equity investor (Kamp and Krieger 2005). Although there have been many private equity success stories in the past as well, isolated facts about private equity activities such as high debt financing of acquisitions and lay-offs as part of restructuring processes are often in the spotlight.
Thus, the question whether private equity has a positive or a negative impact on companies in particular and the economy in general evokes controversy in Germany, while the private equity sector plays an indispensable and almost indisputable role in entrepreneurial cultures such as the USA.
If a private equity investment is beneficial in general can be discussed from various angles depending on which perspective is taken into consideration (e.g. the community, workforce, state, shareholders etc.). This study focuses on the shareholder perspective and tries to determine the impact of private equity on the share price trend after a fixed period of time following the IPO. Since the share price reflects the market value of a company and can have an impact on its future financing activities, the companies’ long term success also depends on this variable. Finally, the performance of private equity-backed IPOs is compared with the performance of non-private equity-backed IPOs. Further-more, first day returns of these two groups are analysed in order to verify the underpricing phenomenon, which is an area of particular interest in international finance literature.
2. Methodology
This study examines the IPO underpricing and share performance of companies that were publicly listed on a German stock exchange in the years 2004 until 2007. This period follows the hot issue market of the years 1999 and 2000 and does not include the ’Neuer Markt’ which was closed in 2003 due to severe performance and legal problems (Bessler and Thies 2007). Hence, this study concentrates on underpricing and performance of IPOs during more ’normal’ times. After the year 2003, during which no company floated its shares on a stock exchange, IPO activity started slowly with 5 IPOs in 2004, 18 in 2005, reaching its peak with 73 IPOs in 2006, followed by 44 IPOs in 2007. These overall 140 IPOs can be divided according to different transparency levels of the Deutsche Börse AG, which determine the disclosure requirements of listed companies ranging from Prime Standard with highest transparency and Entry Standard with the lowest transparency. Table 1 shows the number of IPOs from 2004 until 2007 and their transparency levels.
Table 1. IPOs in Germany from 2004 to 2007 Total 2004 2005 2006 2007 Prime Standard 68 4 13 30 21 General Standard 9 1 1 5 2 Entry Standard 56 - 3 33 20 None 7 - 1 5 1 Total 140 5 18 73 44
Source: Own research.
Since companies listed according to the requirements of the Entry Standard are almost small companies in terms of market capitalization with a small share turnover, this study only examines underpricing and performance of companies that belong to the Prime Standard (68 companies) and General Standard (9 companies) from their first day of trading.
After examining the average underpricing and performance of these 77 companies as a whole group, the companies are split into two groups. The first group, called ’PE group’, only contains companies where private equity inves-tors hold interests in the companies’ shareholdings prior to the IPO. Out of the group of 77 companies, 39 companies were private equity-backed prior to the IPO. The remaining 38 companies constitute the second group, called the ’non-PE group’, in which no private equity investors were involved. The top three sectors of the PE group are Industrial (41.0 per cent), Pharma & Healthcare (15.4 per cent), and Software (12.8 per cent) (see Figure 1).
Figure 1. PE Group by Sector
Source: Deutsche Börse AG (2008b).
PE Group by Sector
Industrial 41.0%
Pharma & Healthcare 15.4% Financial Services 10.3% Software 12.8% Retail 5.1% Chemicals 5.1% Media 2.6% Construction 2.6% Telecommunication
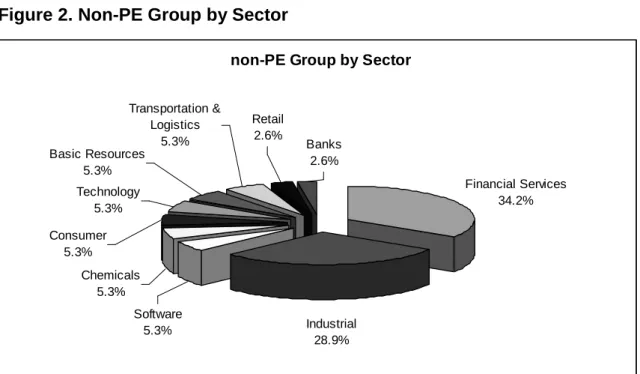
Figure 2 shows the sectors of the non-PE group, which is dominated by industrial companies (28.9 per cent) and companies operating in the financial services sector (34.2 per cent).
Figure 2. Non-PE Group by Sector
Source: Deutsche Börse AG (2008b).
Appendix A and B give an overview of the companies examined in this study and contains Tables with the two groups, the private equity investors involved, the IPO dates, the IPO volume and the market capitalization in million Euros at the first quote as well as the free float after the IPO. Appendix C and D contain the sectors and subsectors of the companies.
After examining these two groups, each group was subdivided into two subgroups according to the size of the companies, in order to get a more differentiated outcome of this study (Table 2). It has been examined whether the size of a company in terms of market capitalization affects the underpricing and the performance of the groups. The median value of the market capitalization at the first quote of the 77 companies separating large from small companies, was €222.3 million Euros. Table 2 shows the facts for four subgroups.
non-PE Group by Sector
Financial Services 34.2% Banks 2.6% Retail 2.6% Transportation & Logistics 5.3% Basic Resources 5.3% Technology 5.3% Consumer 5.3% Chemicals 5.3% Software 5.3% Industrial 28.9%
Table 2. Groups and Subgroups of the Study
Group Subgroup Market Capitalization at
First Quote
Number of Companies PE Group Large PE backed companies ≥ € 222.3 million 20 PE Group Small PE backed companies < € 222.3 million 19 non-PE Group Large PE backed companies ≥ € 222.3 million 19 non-PE Group Small PE backed companies < € 222.3 million 19
Total 77
Source: Own research.
To have a solid basis for further analysis, the performance was examined for six different periods beginning at the date of the IPO. In order to simplify the determination of the periods, the duration was based on trading days. Table 3 displays the periods of investigation.
Table 3. Periods examined in the Study
Periods (trading days) Calendar Period
1 Performance after 10 days following the IPO 2 weeks 2 Performance after 21 days following the IPO 1 month 3 Performance after 42 days following the IPO 2 months 4 Performance after 63 days following the IPO 3 months 5 Performance after 126 days following the IPO 6 months 6 Performance after 250 days following the IPO 12 months
Source: Own research.
To calculate the performance of the share, the difference between the adjusted closing share price of the last trading day of the period and the issue price was put into relation to the issue price. The performance of a benchmark for the same period was deducted in order to adjust the share performance by the market performance. As this study only compares the same periods for different groups (PE group and non-PE group) and their subgroups, and does not compare the performances of different periods, there was no need to use annualized performances, which would rather be misleading than helpful in case of periods shorter than one year. To evaluate the benchmark adjusted performance, the mean and median values are calculated for each period. Finally, the performances of the groups and subgroups are deducted from each other in order to come to a clear conclusion.
For shares of the Dax, MDax, SDax or TecDax the performance of these bench-marks was deducted from the share’s performance over this period. For shares that are not included in one of these indices, the Prime All Share Index of Deutsche Börse AG was considered as the relevant benchmark. It is important to note that the respective benchmark was also used for the full period when the company was admitted to the index during the period of examination.
The level of underpricing was calculated in the same way. The adjusted closing share price of the IPO date was put into relation to the issue price. Likewise the benchmark performance of the share’s first day of trading was deducted from the first day share performance.
The relevant data necessary to conduct this study was taken from Deutsche Börse AG (2008a), the German Private Equity and Venture Capital Association (BVK 2006, 2007) and an interview with one of its employees (BVK 2008). The historical share prices and index quotes were downloaded from Yahoo Finance.com (Yahoo Finanzen 2008).
3. Underpricing
The level of underpricing was calculated in the same way. The adjusted closing share price of the IPO date was put into relation to the issue price. Likewise the benchmark performance of the share’s first day of trading was deducted from the first day share performance.
The level of underpricing was calculated in the same way. The adjusted closing share price of the IPO date was put into relation to the issue price. Likewise the benchmark performance of the share’s first day of trading was deducted from the first day share performance.
First the concept of underpricing is introduced, thereafter an overview of corresponding literature and findings of other studies are given and the hypothesis H1 is developed. The results of this study of German IPOs between 2004 and 2007 are then presented.
3.1 Concept of Underpricing
Underpricing of IPOs is a well documented phenomenon in financial literature. It is defined by Loughran and Ritter (2002) as the number of shares sold times the difference between the first day closing price and the issue (offer) price. According to their study, an average US IPO is underpriced by $US 9.1m. This ’money left on the table’ constitutes a wealth loss for the issuer due to the fact that he sells shares at a discount during an IPO (Camp, Comer and How 2006).
One of the most common reasons for the underpricing phenomenon is that the issuers have to offer their share at a discount (underpricing) in order to attract investors. The theoretical concept of asymmetric distribution of information between the issuing company, the underwriter and the investors (new shareholders) is another explanation for underpricing. Basis of this consideration has been the work of Rock (1986), who explains underpricing as a rational equilibrium in the presence of winner’s curse.
The level of underpricing depends on which of these parties holds more information than the others. If the underwriter is the best informed party, underpricing can be used in order to obtain full subscription of the IPO. Furthermore, the underwriter can use underpricing as a means to oversubscribe an IPO. This enables him to allocate shares to his recurrent institutional investors who benefit from a positive initial return. This might increase the loyalty of the investors and facilitate the sale of subsequent IPOs and seasoned offerings. The underwriter, however, risks losing business from the issuer in the future. A private equity investor could have an incentive to under-price due to the fact that he might create a success story of the future performance of the share, thus raising his reputation, which in turn should facilitate future exits and stimulate new business and fund raising. If the issuing company possesses the best information about its true value, a high quality company could use underpricing as a means to distinguish itself from low quality companies. In contrast, low quality companies might tend to price fully (Bergström, Nilsson and Wahlberg 2006). Bergström, Nilsson and Wahlberg (2006), however, assume that private equity-backed companies are more thoroughly scrutinized by private equity investors and that more information will be disclosed as opposed to non private equity-backed IPOs. This contributes to greater information homogeneity amongst the new investors and reduces ex ante uncertainty. Hence, there is less need to underprice a private equity-backed IPO (Bergström, Nilsson and Wahlberg 2006).
3.2 Literature Review
Although it is likely that private equity has an influence on the degree of underpricing, the empirical evidence of whether private equity-backing leads to a greater or lesser extent of underpricing is mixed.
Various authors (e.g. Megginson and Weiss 1991) argue that a private equity investor certifies the quality of an IPO and mitigates information asymmetry. In line with the study by Barry et al. (1990), they examined the effects of private equity on IPO companies. Both studies found evidence that private equity-backed companies use less underpricing than non-private equity-equity-backed companies. Bergström, Nilsson and Wahlberg (2006) conducted research on IPOs in London and Paris between 1994 and 2004 and also observed a lower degree of underpricing for private equity-backed IPOs, although they found large variations across industries. According to the theoretical concept, the greater degree of underpricing of non private equity-backed IPOs should compensate for the greater information asymmetry between the insiders (company) and the outsiders (public).
Franzke (2003), however, found no evidence of the certification role of private equity investors when examining 160 non-private equity-backed, 79 private equity-backed and 61 bridge-financed companies on the ‘German Neuer Markt” between 1997 and 2002. Quite on the contrary, this study even found a higher degree of underpricing in association with private equity-backed IPOs (Franzke, 2003). This contradictory result could be explained by the fact that the figures of the study were based on the ’hot issue market’ which might have led to different results.
This study calculates underpricing on the basis of the first day’s closing price and focuses on a more ’normal’ period of trading. Thus, the first hypothesis H1 suggests that private equity-backed IPOs are less underpriced relative to non private equity-backed IPOs, because it is assumed that private equity investors certify the quality of an IPO, which consequently reduces ex ante uncertainty and should reduce underpricing.
3.3 Discussion of own results
Table 4 shows the level of underpricing for the whole sample of 77 companies that conducted an IPO in Germany between 2004 and 2007.
Table 4. Underpricing of 77 companies
Measure Benchmark adjusted first day return
Mean 4.08 %
Median 0.98 %
Minimum -17.10 %
Maximum 52.88 %
Source: Own calculations, n=77.
The average benchmark adjusted first day return (underpricing) of all 77 companies was 4.08 per cent. However, the median value, which is not influenced by positive and negative outliers, is only 0.96 per cent. The following Table 5 compares the underpricing of the PE group with that of the non-PE group.
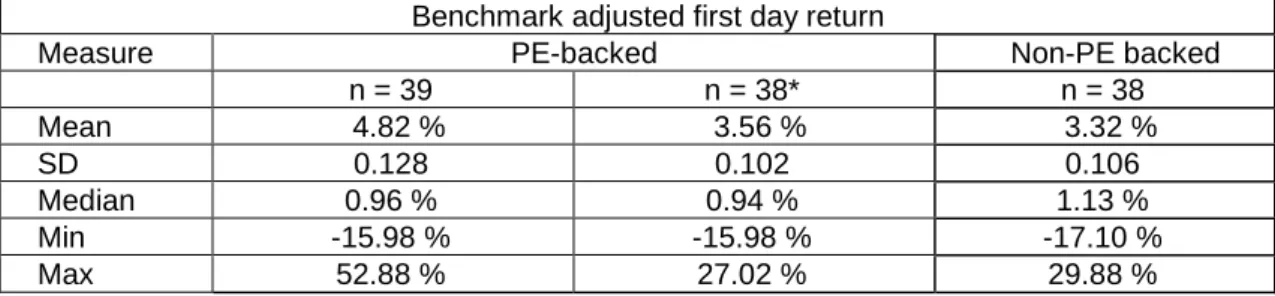
Table 5. Comparison of Underpricing of 77 PE-Group and non PE-Group
Benchmark adjusted first day return
Measure PE-backed Non-PE backed
n = 39 n = 38* n = 38 Mean 4.82 % 3.56 % 3.32 % SD 0.128 0.102 0.106 Median 0.96 % 0.94 % 1.13 % Min -15.98 % -15.98 % -17.10 % Max 52.88 % 27.02 % 29.88 %
Source: Own calculations, ntotal =77. * without the single extremely high priced IPO.
Whereas the median values are almost equal, the mean values differ significantly, showing that private equity-backed IPOs seem to be more underpriced than non-private equity-backed IPOs. However, this is due to one extreme outlier in the PE group with an underpricing of 52.88 per cent. Excluding this company, the mean (3.56 per cent), the standard deviation (0.102) and the range of values from -15.98 per cent to 27.02 per cent are almost similar to the values of the non PE group. Thus, this data fails to support the hypothesis H1 of this study, which assumed that private equity-backed IPOs are less underpriced than non-private equity-backed IPOs. No evidence could be found that there is a significant difference in the level of IPO underpricing.
A comparison of large (Table 6) and small companies (Table 7) of both groups supports the results. The average underpricing of large private equity-backed companies is 6.46 per cent and thus similar to the average underpricing of large non-private equity-backed companies (6.33 per cent). Only the median values differ, showing that half of the subgroup of large private equity-backed companies is more respectively less than 2.07 per cent underpriced compared to a median value of 4.38 per cent for large non-private equity-backed companies.
Table 6. Comparison of Underpricing: Large Companies
Benchmark adjusted first day return
Measure Large PE-backed n=20 Large Non-PE backed n = 19
Mean 6.46 % 6.33 %
SD 0.114 0.127
Median 2.07 % 4,38 %
Min -10.79 % -17.10 %
Max 27.02 % 29.88 %
Source: Own calculations.
When excluding the outlier with an underpricing of 52.88 per cent from the subgroup of small private equity-backed companies, the mean value as well as
the standard deviation is almost equal to small non-private equity-backed companies (Table 7).
Table 7. Comparison of Underpricing: Small Companies
Benchmark adjusted first day return
Measure Small PE-backed
companies Small Non-PE backed companies n = 19 n = 18 n = 19 Mean 3.10 % 0.33 % 0.30 % SD 0.138 0.075 0.066 Median -0.09 % -0.29 % 0.26 % Min -15.98 % -15.98 % -10.42 % Max 52.88 % 21.98 % 14.29 %
Source: Own calculations.
By comparing large companies with their smaller counterparts within each group, it can be observed that IPOs of large companies are underpriced on average by more than 6 per cent, whereas the issue price of smaller companies seems to represent almost the fair value of the company, as no significant evidence of underpricing can be found.
As a result, no evidence for the certification role of private equity investors can be found. In this aspect, therefore, the study is in line with Franzkes (2003) findings. In contrast to the findings of Franzke, however, the larger degree of underpricing of private equity-backed IPOs was only marginal.
This study observed a significant difference of underpricing between large and small companies. Three different reasons can be mentioned.
The first reason might be that larger companies are more able or willing to
offer their shares at a discount in order to attract investors and to signal quality. Hence, it would mean that the decision to underprice was voluntary and intentional.
Secondly however, if larger companies are forced by the market to sell
their shares at a discount, this might be due to the complexity of their business models compared to smaller niche companies. Conglomerates are supposed to be more diverse and not specialised in one area of their businesses which might lead to a larger degree of IPO underpricing.
And thirdly another reason might be that there is more transparency about
the true value of large companies, since it is more likely that (direct and similar) competitors of the IPO candidates are already publicly listed and are used as a benchmark for the IPO, which serves as a basis for a discount required by the new investors.
Companies used as a benchmark for IPO pricing are often companies operating within in the same sector as the IPO candidate or companies with a similar business model. Often a discount of 20 to 30 per cent is deducted from their market value in order to make the IPO appealing for new investors (Schnell, 2004; Cünnen, Maisch and Landgraf, 2004). For example, Premiere AG was initially offered at a discount of 20 per cent (Handelsblatt, 2005). Wincor Nixdorf AG was required by the investors to sell its shares at a discount of up to 25 per cent (Handelsblatt, 2004). Shares of Klöckner AG were sold at a discount of 30 to 45 per cent compared to similar companies which were already listed (Handelsblatt.com, 2006). MTU Aero Engines AG offered its shares at a discount of merely 10 per cent, as it has a very stable business model and long time market experience (Handelsblatt, 2005).
The assumption that the market possesses more information about large companies than about smaller ones does not provide evidence for the theory of information asymmetry as a reason to underprice. According to this theory, small IPOs would be more underpriced in order to compensate the new shareholders for the ex ante uncertainty that arises from the larger degree of information heterogeneity between the informed issuing (small) company and the rather uninformed shareholders.
4. After Market Performance of IPOs
After giving a literature review about the after market performance and introducing hypothesis H2a and H2b, results of this study are presented.
4.1 Literature Review
There is an extensive body of literature which examines the performance of IPOs. A study conducted by Ritter (1991) for US IPOs (n = 1,254) between 1975 and 1984 showed returns that were initially positive, but became negative after a longer period of time (e.g. -29.1 per cent CAGR after 36 months). The study of Aggarwal and Rivoli (1990) investigated 1,598 IPOs from 1977 to 1987 and revealed a performance of -13.7 per cent after 250 days of trading. Affleck-Graves et al. (1996) found a negative abnormal performance of -7.6 per cent for a period of 504 days (n = 2,096, period: 1975-1991). Studies conducted for German IPOs show the same picture al-though the time period is limited and the number of IPOs is relatively small. Schuster (1995) for instance examined 59 IPOs in Germany from 1988 to 1992 and found an abnormal return of -28 per cent (CAGR) after 60 months. Only the study of Chalk and Peavy (1987) found a positive cumulative abnormal return of +18 per cent for a period of 190 days for 649 IPOs between 1975 and 1982. Ritter (1991) and Loughran and
Ritter (1995) showed that US IPOs underperform compared to different benchmarks in the long run. Bessler and Thies (2007) conclude that investors are too optimistic about the future of the companies and that IPOs might be over-priced in general.
Bessler and Thies (2007) investigated the long-run performance of IPOs in Germany for the period from 1977 to 1995. Their empirical findings suggest that the financing activity after the IPO is the most important factor for the future performance and separates the out-performers from the under-performers. Hence, only successful companies are able to raise additional funds through a seasoned new issue in the equity market, whereas poor performers do not get a second opportunity to sell shares to the public (Bessler and Thies, 2007).
Another difference between under- and out-performers could be the existence of financing and consulting activities of private equity investors before and, to a lesser extent, after the IPO. Brau, Brown and Osteryoung (2004) tested two hypotheses predicting either superior or inferior performance on the one hand and either greater or less underpricing of private equity-backed relative to non private equity-backed IPOs on the other hand. By investigating underpricing and performance of small manufacturing companies, they found neither significant difference in terms of underpricing nor in terms of three year stock performance. However, they concluded that if the private equity-backed companies had never been able to conduct an IPO without private equity-backing, the IPO in itself might be an indicator of success (Brau, Brown and Osteryoung, 2004).
In contrast, according to a study conducted by Brav and Gompers (1997), private equity-backed IPOs outperform non private equity-backed IPOs on the US market over a period of five years. Bergström, Nilsson and Wahlberg (2006) analyzed 152 private equity-backed IPOs and 1,370 non private equity-backed IPOs on the London Exchange and Paris Stock Exchange over the period from 1994 to 2004. By calculating the performance for three time horizons (six months, three and five years), they found out that private equity-backed IPOs on average outperform non private equity-backed IPOs over all time horizons. Although private equity-backed IPOs perform better, they only reach the return level of the benchmark during the first six months. Afterwards, the benchmark performance is better (Bergström, Nilsson and Wahlberg, 2006). This is in line with the findings of the studies mentioned above, where the performance of IPOs is worse than the benchmarks. Table 8 shows the benchmark adjusted long run performance of private equity-backed and non-private equity-backed IPOs according to the findings of Bergström, Nilsson and Wahlberg (2006).
Table 8. Long-Run Benchmark Adjusted Performance over Six Months and Three and Five Years
Private Equity Backed
Period 6 months 3 years 5 years
Mean 0.16% -28.61% 49.82 %
Non-Private Equity Backed
Period 6 months 3 years 5 years
Mean -3.21 % -72.94 % -103.57 %
Source: Bergström, Nilsson and Wahlberg, 2006.
Based upon the findings mentioned above, the second hypothesis H2a of this study is that private equity-backed IPOs will on average (mean) outperform non private equity-backed IPOs within one year (250 trading days) after the IPO. Furthermore, the authors assume that the overall performance of the 77 companies after 250 trading days will on average (mean) be worse than the benchmark (H2b).
4.2 Discussion of own results
Table 9 shows the average benchmark adjusted performance of the whole sample of 77 private equity and non-private equity-backed companies that went public between 2004 and 2007. The mean, median, minimum and maximum values are displayed for each period.
Table 9. Benchmark Adjusted Performance of 77 Companies
Period
10 days 21 days 42 days 63 days 126 days 250 days
Mean 2.16% 0.86% -1.46% -2.71% -2.71% -5.35%
Median -0.76% -0.85% -2.24% -1.81% -7.71% -21.38%
Max 53.5% 71.62% 76.14% 82.69% 112.05% 284.16%
Min -23.4% -31.20% -44.36% -45.46% -78.14% -105.23%
Source: Own calculations, n=77.
Except of the mean values for 10 and 21 days, all average performances were negative. As a result, hypothesis H2b is proved to be correct, as the companies performed on average worse than the benchmarks after a time horizon of 250 trading days.
Table 10 shows the average benchmark adjusted performances of the 39 private equity-backed companies.
Table 10. Benchmark Adjusted Performance of PE Group (39 Companies)
Period
10 days 21 days 42 days 63 days 126 days 250 days
Mean 2.05% 1.49% 1.08% 0.01% 1.71% 5.43%
Median -0.44% 1.60% 1.04% -0.33% -7.44% -16.05%
Max 53.5% 33.97% 65.23% 82.69% 112.05% 284.16%
Min -20.67% -31.20% -44.36% -45.46% -78.14% -97.85%
Source: Own calculations, n=39.
Except of the 21 and 42 days period, all median values are negative, which means that the majority of companies experienced a negative performance. However, due to some extreme above average performing companies, all mean values are positive.
Table 11 shows the average benchmark adjusted performance figures for non-private equity-backed companies likewise.
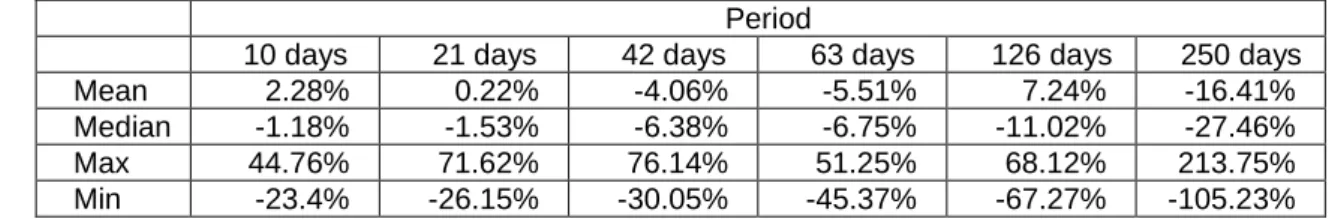
Table 11. Benchmark Adjusted Performance of Non-PE Group (38 Compa-nies)
Period
10 days 21 days 42 days 63 days 126 days 250 days
Mean 2.28% 0.22% -4.06% -5.51% 7.24% -16.41%
Median -1.18% -1.53% -6.38% -6.75% -11.02% -27.46%
Max 44.76% 71.62% 76.14% 51.25% 68.12% 213.75%
Min -23.4% -26.15% -30.05% -45.37% -67.27% -105.23%
Source: Own calculations, n=38.
Almost all mean and median values are negative. The following Table 12 shows the differences between private equity-backed companies displayed in Table 10 and non-private equity-backed companies in Table 11.
Table 12. Performance Differences – PE and non-PE-Group
Period
10 days 21 days 42 days 63 days 126 days 250 days
Mean -0.24% 1.27% 5.14% 5.53% 8.95% 21.84%
Median 0.74% 3.13% 7.42% 6.43% 3.58% 11.41%
Max 8.73% -37.65% -10.91% 31.43% 43.93% 70.41%
Min 2.73% -5.05% -14.31% -0.09% -10.87% 7.38%
Source: Own calculations, n=38.
It can be observed that the benchmark adjusted performance of companies belonging to the PE group was, except for the 10 days period, higher compared to non-private equity-backed companies. Whereas the share prices of private equity-backed companies outperformed the benchmarks on average by 5.43 per cent after 250 trading days (Table 10), non-private equity-backed
companies underperformed their benchmarks by 16.41 per cent (Table 11), which leads to a benchmark adjusted overperformance of the PE group of 21.84 per cent in Table 12. Hence, hypothesis H2a postulating that private equity-backed IPOs on average (mean) outperform non private equity-equity-backed IPOs within one year (250 trading days) after the IPO is proved to be correct.
Table 13a and 13b split the performance figures of the PE group into large and small companies according to their market capitalization on the first day of trading.
Table 13a. Large PE Backed Companies (20 Companies)
Period
10 days 21 days 42 days 63 days 126 days 250 days
Mean 5.25% 6.85% 9.00% 8.47% 12.41% 16.41%
Median 4.66% 8.84% 4.86% 2.44% 0.77% 1.73%
Max 29.84 33.97% 65.23% 82.69% 112.05% 212.16%
Min -15.67% -15.96% -28.55% -30.30% -68.01% -97.85%
Source: Own calculations, n=20.
Table 13b. Small PE Backed Companies (19 Companies)
Period
10 days 21 days 42 days 63 days 126 days 250 days
Mean -1.32% -4.15% -7.26% -8.89% -9.55% -6.13%
Median -3.49% -1.96% -1.60% -7.39% -11.84% -28.19%
Max 53.5% 25.14% 22.91% 22.68% 70.20% 284.16%
Min -20.67% -31.20% -44.36% -45.46% -78.14% -94.22%
Source: Own calculations, n=19.
On average, large companies outperformed small companies, although all the 39 companies were backed with private equity prior to the IPO. All average values of large companies are positive, whereas all average values of small companies are negative.
The average benchmark adjusted performance of small companies after 250 trading days of -6.13 per cent deducted from the benchmark adjusted performance of large companies of 16.41 per cent (Table 13) equals an overperformance of large companies of 22.54 per cent (Table 14).
Table 14. Differences of Large vs. Small PE Backed Companies
Period
10 days 21 days 42 days 63 days 126 days 250 days
∆ Mean 6.57% 11.00% 16.26% 17.36% 21.96% 22.54%
∆ Median 8.15% 10.80% 6.46% 9.83% 12.61% 29.93%
∆ Max -23.65% 8.84% 42.32% 60.00% 41.85% -72.00%
∆ Min 5.01% 15.24% 15.81% 15.16% 10.13% -3.63%
Source: Own calculations, n=39.
The mean, median, minimum and maximum values of large and small companies of the non-PE group for all periods are summarized in Table 15a and Table 15b.
Table 15a. Large Non-PE Backed Companies (19 Companies)
Period
10 days 21 days 42 days 63 days 126 days 250 days
Mean 7.05% 4.41% 1.64% -2.19% 1.44% -9.34%
Median 0.80% 0.53% -2.62% -0.25% 0.13% -10.43%
Max 44.76% 71.62% 76.14% 51.25% 68.12% 46.22%
Min -23.40% -26.15% -30.05% -45.37% -67.27% -105.23%
Source: Own calculations, n=19.
Table 15b. Small Non-PE Backed Companies (19 Companies)
Period
10 days 21 days 42 days 63 days 126 days 250 days
Mean -2.48% -3.98% -9.76% -8.83% -15.92% -23.49%
Median -2.55% -3.14% -8.40% -12.36% -23.70% -32.92%
Max 11.05% 13.89% 2.43% 16.17% 60.20% 213.75%
Min -18.28% -19.14% -26.03% -39.02% -48.76% -90.09%
Source: Own calculations, n=19.
According to these figures, large companies within the non-PE group outperform the smaller ones. Interestingly, the average performances of large companies also turn negative after 250 days following the IPO.
Table 16 shows the differences between large and small non-private equity-backed companies.
Table 16. Differences of Large vs. Small Non-PE Backed Companies
Period
10 days 21 days 42 days 63 days 126 days 250 days
∆ Mean 9.53% 8.39% 11.40% 6.64% 17.36% 14.15%
∆ Median 3.34% 3.67% 5.78% 12,10% 23.83% 22.49%
∆ Max 33.71% 57.74% 73.70% 35.08% 7.92% -167.52%
∆ Min 5.13% -7.01% -4.02% -6.35% -18.51% -15.14%
Source: Own calculations, n=38.
After 250 trading days, large companies of the non-PE group outperformed their smaller counterparts on average by 14.15 per cent after deducting the respective benchmark performances.
Previously, this chapter only examined the differences between the PE and non-PE group as a whole and the subgroups of large and small companies within these two groups. Whereas the PE group outperformed the non-PE group, large companies experienced a better performance than smaller companies. In the following, only differences between large companies (of both groups) on the one hand and small companies (of both groups) on the other will be examined. Further, large private backed and small non-private equity-backed companies as well as small private equity-equity-backed and large non-private equity-backed companies will be compared to evaluate the performance according to a matrix with the following dimensions:
size of companies, and
private equity involvement.
The performance of large non-private equity-backed companies was deducted from the performance of large private equity-backed companies (Table 17).
Table 17. Differences of Large PE- vs. Large Non-PE Backed Companies
Period
10 days 21 days 42 days 63 days 126 days 250 days
∆ Mean -1.80% 2.44% 7.36% 10.67% 10.97% 25.75%
∆ Median 3.86% 8.31% 7.48% 2.70% 0.63% 12.17%
∆ Max -14.92% -37.65% -10.91% 31.43% 43.93% 165.94%
∆ Min 7.74% 10.19% 1.51% 15.07% -0.75% 7.38%
Source: Own calculations, n=39.
On average, large private equity-backed companies outperformed their non-private equity counterparts except for the 10 day period. After 250 trading days, the benchmark adjusted performance of large private equity-backed companies was 25.75 per cent higher. The differences in the median values show the same picture.
Table 18 compares the small companies of both groups and displays the differences for all periods.
Table 18. Differences of Small PE- vs. Small Non-PE Backed Companies
Period
10 days 21 days 42 days 63 days 126 days 250 days
∆ Mean 1.16% -0.18% 2.50% -0.06% 6.37% 17.35%
∆ Median -0.95% 1.18% 6.80% 4.97% 11.85% 4.73%
∆ Max 42.44% 11.25% 20.48% 6.51% 10.00% 70.41%
∆ Min -2.40% -12.05% -18.33% -6.44% -29.38% -4.13%
Source: Own calculations, n=38.
When considering smaller companies, small private equity-backed companies outperformed small non-private equity-backed companies within the 10, 42, 126 and 250 days periods, even though the difference of the median values for the 10 days period is negative. However, the mean values for the 21 and 63 days periods are slightly negative. After 250 days the difference of the mean values is +17.36 per cent, showing a strong benchmark adjusted overperformance of small private equity-backed companies.
Not surprisingly, the biggest performance differences can be observed when large private equity-backed companies are compared with small non-private equity-backed companies (Table 19).
Table 19. Differences of Large PE- vs. Small Non-PE Backed Companies
Period
10 days 21 days 42 days 63 days 126 days 250 days
∆ Mean 7.73% 10.82% 18.76% 17.31% 28.33% 39.90%
∆ Median 7.20% 11.98% 13.25% 14.80% 24.46% 34.65%
∆ Max 18.79% 20.09% 62.79% 66.52% 51.85% -1.59%
∆ Min 2.61% 3.18% -2.52% 8.72% -19.26% -7.76%
Source: Own calculations, n=39.
Large companies of the PE group outperformed small companies of the non-PE group over all time horizons. Except for the 10 days period, all differences are double digit figures, which show that the result is consistent.
Finally, the differences between large non-private equity-backed and small private equity-backed companies remain to be examined (Table 20).
Table 20. Differences of Large Non-PE vs. Small PE Backed Companies
Period
10 days 21 days 42 days 63 days 126 days 250 days
∆ Mean 8.37% 8.56% 8.90% 6.70% 10.99% -3.21%
∆ Median 4.29% 2.48% -1.02% 7.13% 11.97% 17.76%
∆ Max -8.73% 46.49% 53.22% 28.57% -2.09% -237.93%
∆ Min -2.73% 5.05% 14.31% 0.09% 10.87% -11.01%
Source: Own calculations, n=38.
In general, large companies of the non-PE group performed better than small companies of the PE group, although the difference of the mean value after 250 days is negative with -3.21 per cent, which shows an overperformance of small PE-backed companies. However, as the difference of the median value is positive (17.76 per cent), the mean values seem to be strongly distorted by extreme outliers. In fact, the maximum value of the small PE group is very high (+284.16%) and, thus, has a strong influence on the mean value (Table 13). The findings can be summarized by creating the following matrix (figure 3).
Figure 3. Performance Matrix – Small vs. Large, PE vs. Non PE Companies
Small Companies Large Companies
Private Equity
–
+ +
No Private Equity
– –
+
Source: Own graph.
Private equity-backed companies outperformed companies with no private equity involvement. By comparing large and small companies, it could be observed that large companies with a huge market capitalization outperform smaller companies. Even if the underpricing effect is not considered, the performance of larger companies is better. The biggest differences were found by comparing large private equity-backed and small non-private equity-backed companies. However, the most important factor influencing the performance seems to be the market capitalization, since even large companies with no private equity perform better than small private equity-backed companies.
5. Conclusion
This study found no evidence that private equity-backed IPOs are significantly more or less underpriced than non-private equity-backed IPOs. Hence, the
certification role of private equity investors discovered in other studies could not be proved of being correct. Large companies were underpriced on average by more than 6 per cent whereas the shares of small companies were on average sold almost at their fair value, regardless of the existence of a private equity investor. Three possible reasons for the higher degree of underpricing in case of large companies were suggested within this study. Firstly, large companies may intentionally offer their shares at a discount to attract investors. Secondly, large companies have to cope with complex business models that lead to a lower value. And thirdly, large companies have to deliver much more financial information than smaller companies. This may result in a higher transparency about the true value of the company.
Keeping the previous considerations in mind, the following fields for further investigation may be interesting: Are the differences concerning the valuation between large and small companies regardless of the area of business or do specific segments exist, such as high technology, that require a higher discount of valuation? Does it play a role what kind of evolutionary stage the company respectively the market has achieved?
However, this study shows that private equity-backed companies on average perform better on the stock market than non-private equity-backed IPOs in terms of the share price trend. The reason might be that private equity investors add value to their portfolio companies through funding and consulting activities as well as providing access to their networks, etc.
Apart from private equity involvement, another dimension which seems to have an effect on the share price performance is the size of the company in terms of market capitalization. The performance differences between large and small companies were higher than between private equity and non-private equity-backed IPOs. Even large non-private equity-equity-backed companies performed better than small companies with a private equity investor. The best performance was observed for large private equity-backed IPOs, the worst performance for small non-private equity-backed IPOs. This could also be an indication for shareholders who consider of subscribing shares in connection with an IPO. However, shareholders should take into account that most of the shares performed worse than the benchmarks and experienced a negative performance at least within the first year after the IPO.
Appendix
A. Sample and IPOs of PE Group, n = 39
Company Private Equity Investor IPO Date IPO Volume in Mill. Euros Market Capitalisation at First Quote in Mill. Euros Free Float Wincor Nixdorf AG KKR 19.05.2004 362.153 678.242 53.40% Epigenomics AG DVC, MPM, 3i, Abingworth, KfW/tbg 19.07.2004 41.597 143.773 28.93% Paion AG 3i, S-UBG Aachen 11.02.2005 46.000 120.044 38.32% Premiere AG Permira 09.03.2005 1,178.520 2,501.000 51.33% Conergy AG Grazia Equity, Capital Stage 17.03.2005 243.000 710.000 45.00% MTU Aero Engines Holding AG KKR 06.06.2005 748.650 1,203.950 64.82% Interhyp AG Earlybird, 3i 29.09.2005 103.393 331.416 37.88% Ersol Solar Energy AG Ventizz, equitrust, nwk nordwest
Kapitalbeteiligungsgesellschaft
30.09.2005 153.684 637.000 37.34%
Q-Cells AG Apax Partners, IBG Sachsen-Anhalt, DKB Wagniskapital
05.10.2005 313.244 1,808.767 22.33% Tipp24 AG Earlybird 12.10.2005 85.834 177.446 47.19% Jerini AG TVM, HealthCap, 3i, PolyTechnos,
LifeScience Partners, KfW/tbg, IBB Beteiligungsgesellschaft, VC Fonds Berlin, bmp, NGN Biomed
01.11.2005 49.600 151.752 31.66%
SAF AG Ventizz Capital, AVIDA Group/Techinvest
06.04.2006 45.327 95.265 46.50% Magix AG 3i, KfW/tbg 06.04.2006 75.333 207.657 36.28% Dresdner Factoring AG SBG Sachsen-Anhalt, SBG
Hessen-Thüringen, MVC
26.04.2006 16.457 32.508 51.11% Schmack Biogas AG BayBG, S-Refit, SAM Private Equity 24.05.2006 71.300 163.005 46.56% 10Tacle Studios AG MVP, Fraunhofer Venture 22.06.2006 9.143 58.073 15.41% Demag Cranes AG KKR 23.06.2006 264.539 472.158 56.79% Klöckner & Co AG Lindsay Goldberg & Bessemer 28.06.2006 264.000 697.000 35.48% Bauer AG DBAG 04.07.2006 145.411 284.375 50.68% Aleo Solar AG Hannover Finanz 14.07.2006 86.241 175.910 49.03% ItN Nanovation AG TechnoStart, Nanostart, Heliad
Equity, Saar-ländische
Wagnisfinanzierungsgesellschaft, Creathor
28.07.2006 27.609 134.543 25.65%
Gagfah S.A. Fortress 19.10.2006 852.863 4,950.000 19.95% LHS Aktiengesellschaft General Atlantic Partner 25.10.2006 41.819 123.637 35.94% Delticom AG NORD Holding, DVC, BK Hannover 26.10.2006 40.774 146.020 28.70% Petrotec AG Warburg Pincus 06.11.2006 94.950 178.500 53.19% Wilex AG Earlybird, Apax Partners, TVM
Capital, Mer-lin, PharmaBio,
Business-Angel-Beteiligungsgesellschaft, Quest for Growth, KfW/tbg, BayernKapital
13.11.2006 55.200 165.086 33.44%
Francotyp-Postalia Holding AG Quadriga Capital, Stockwell Fund 30.11.2006 159.134 279.300 56.98% SKW Stahl-Metallurgie Holding AG Arques 01.12.2006 55.020 128.466 42.90%
Company Private Equity Investor IPO Date IPO Volume in Mill. Euros Market Capitalisation at First Quote in Mill. Euros Free Float
Xing AG Wellington Partners 07.12.2006 68.172 156.051 43.69% Symrise AG EQT 11.12.2006 1,397.774 2,038.489 68.57% VITA 34 International AG SHS, SachsenLB CFH 27.03.2007 9.000 38.110 22.67% Alstria office REIT-AG Captiva/Natixis 03.04.2007 412.453 912.800 46.03% SMT Scharf AG Aurelius 11.04.2007 17.100 39.900 42.86% Versatel AG Apax Partners 27.04.2007 720.650 1,276.000 56.48% Wacker Construction Equipment
AG
Lindsay Goldberg & Bessemer 15.05.2007 404.780 1,254.600 36.08% Gerresheimer AG Blackstone 11.06.2007 912.166 1,256.000 72.62% VTG Aktiengesellschaft WL Ross 28.06.2007 177.137 406.389 46.01% Tognum AG EQT 02.07.2007 2,012.202 3,153.000 63.82% Homag Group AG DBAG 13.07.2007 195.283 502.016 40.15%
Average 306.603 712.519 43.12%
B. Sample and IPOs of Non-PE Group, n = 38
Company IPO Date IPO Volume in
Mill. Euros Market Capitalisation at First Quote in Mill. Euros Free Float
MIFA Mitteldeutsche Fahrradwerke AG 17.05.2004 13.875 55.800 25.00% Deutsche Postbank AG 23.06.2004 1,553.250 4,756.000 33.23% InTiCom Systems Aktiengesellschaft 08.11.2004 10.710 23.920 45.77% HCI Capital AG 06.10.2005 278.087 492.000 56.52% Lloyd Fonds Aktiengesellschaft 28.10.2005 88.667 197.600 43.75% Thielert Aktiengesellschaft 17.11.2005 142.200 268.536 52.95% Praktiker Bau- und Heimwerkermärkte Holding AG 22.11.2005 500.250 864.200 59.48% FHR Finanzhaus AG 23.11.2005 17.050 93.000 18.33% Primion Technology AG 13.02.2006 40.600 81.863 50.45% Patrizia Immobilien AG 31.03.2006 402.745 1,019.100 45.93% Wacker Chemie AG 10.04.2006 1,199.510 4,693.734 28.75% C.A.T. oil AG 04.05.2006 293.250 825.600 40.73% Viscom AG 10.05.2006 49.500 184.008 29.66% Air Berlin PLC 11.05.2006 443.478 755.747 61.86% EmQtec AG 14.07.2006 - 24.400 100.00% Smarttrac N.V. 20.07.2006 59.500 229.500 25.93% OVB Holding AG 21.07.2006 63.641 304.978 21.26% BDI - BioDiesel International AG 25.09.2006 72.500 222.300 32.89% CropEnergies AG 29.09.2006 200.000 637.500 29.41% GWB Immobilien AG 04.10.2006 17.625 61.250 28.78% VERBIO Vereinigte BioEnergie AG 16.10.2006 263.900 945.000 28.89% hotel.de AG 20.10.2006 16.125 82.500 20.00% Hahn-Immobilien-Beteiligungs AG 30.10.2006 20.000 122.400 16.67% Alta Fides Aktiengesellschaft für Grundvermögen 08.12.2006 34.000 119.850 28.37% Ariston Real Estate AG 14.02.2007 24.300 77.532 35.10% Kromi Logistik AG 08.03.2007 30.000 82.500 40.00% HanseYachts Aktiengesellschaft 09.03.2007 75.900 230.400 35.94% Polis Immobilien AG 21.03.2007 89.778 164.660 56.03% Estavis AG 02.04.2007 82.533 218.601 38.16% DF Deutsche Forfait AG 24.05.2007 15.525 53.720 30.44% InVision Software AG 18.06.2007 34.464 72.638 48.19% ZhongDe Waste Technology AG 06.07.2007 108.817 390.000 32.19% EnviTec Biogas AG 12.07.2007 242.520 757.500 34.40% Centrotherm photovoltaics AG 12.10.2007 185.093 640.000 33.53% Hamburger Hafen und Logistik AG 02.11.2007 1,166.000 4,125.310 30.29% FranconoWest AG 13.11.2007 9.000 59.070 15.15% MeVis Medical Solutions AG 16.11.2007 37.365 100.100 37.33% Asian Bamboo AG 16.11.2007 82.586 230.775 38.10%
Average 209.588 638.516 37.62%
C: Sectors of PE-Group
Company Sector Subsector
Wincor Nixdorf AG Industrial Industrial Products & Services
Epigenomics AG Pharma & Healthcare Biotechnology
Paion AG Pharma & Healthcare Biotechnology
Premiere AG Media Broadcasting
Conergy AG Industrial Renewable Energies
MTU Aero Engines Holding AG Industrial Heavy Machinery
Interhyp AG Financial Services Diversified Financial
Ersol Solar Energy AG Industrial Renewable Energies
Q-Cells AG Industrial Renewable Energies
Tipp24 AG Retail Retail, Internet
Jerini AG Pharma & Healthcare Biotechnology
SAF AG Software Software
Magix AG Software Software
Dresdner Factoring AG Financial Services Diversified Financial
Schmack Biogas AG Industrial Renewable Energies
10acle Studios AG Software Software
Demag Cranes AG Industrial Industrial Machinery
Klöckner & Co AG Industrial Industrial Products & Services
Bauer AG Construction Construction & Engineering
Aleo solar AG Industrial Renewable Energies
ItN Nanovation AG Industrial Advanced Industrial Equipment
Gagfah S.A. Financial Services Real Estate
LHS Aktiengesellschaft Software Software
Delticom AG Retail Retail, Internet
Petrotec AG Industrial Renewable Energies
Wilex AG Pharma & Healthcare Biotechnology
Francotyp-Postalia Holding AG Industrial Industrial Machinery
SKW Stahl-Metallurgie Holding AG Chemicals Chemicals, Speciality
Xing AG Software Internet
Symrise AG Chemicals Chemicals, Speciality
VITA 34 International AG Pharma & Healthcare Biotechnology
Alstria office REIT-AG Financial Services Real Estate
SMT Scharf AG Industrial Heavy Machinery
Versatel AG Telecommunication Fixed-Line Telecommunication
Wacker Construction Equipment AG Industrial Industrial Machinery
Gerresheimer AG Pharma & Healthcare Health Care
VTG Aktiengesellschaft Transportation & Logistics Logistics
Tognum AG Industrial Industrial Machinery
Homag Group AG Industrial Industrial Machinery
D. Sectors of Non- PE Group
Company Sector Subsector
MIFA Mitteldeutsche Fahrradwerke AG Consumer Leisure
Deutsche Postbank AG Banks Credit Banks
InTiCom Systems Aktiengesellschaft Technology Communications Technology
HCI Capital AG Financial Services Diversified Financial
Lloyd Fonds Aktiengesellschaft Financial Services Diversified Financial
Thielert Aktiengesellschaft Industrial Industrial Machinery
Praktiker Bau- und Heimwerkermärkte Holding AG Retail Retail, Specialty
FHR Finanzhaus AG Financial Services Diversified Financial
Primion Technology AG Industrial Industrial Products & Services
Patrizia Immobilien AG Financial Services Real Estate
Wacker Chemie AG Chemicals Chemicals, Speciality
C.A.T. oil AG Basic Resources Oil & Gas
Viscom AG Industrial Advanced Industrial Equipment
Air Berlin PLC Transportation & Logistics Airlines
EmQtec AG Chemicals Chemicals, Commodity
Smartrac N.V. Technology Electronic Components & Hardware
OVB Holding AG Financial Services Diversified Financial
BDI - BioDiesel International AG Industrial Renewable Energies
CropEnergies AG Industrial Renewable Energies
GWB Immobilien AG Financial Services Real Estate
VERBIO Vereinigte BioEnergie AG Industrial Renewable Energies
Hotel.de AG Consumer Leisure
Hahn-Immobilien-Beteiligungs AG Financial Services Real Estate
Alta Fides AG Financial Services Real Estate
Ariston Real Estate AG Financial Services Real Estate
KromiLogistik AG Industrial Industrial Products & Services
HanseYachts Aktiengesellschaft Industrial Heavy Machinery
Polis Immobilien AG Financial Services Real Estate
Estavis AG Financial Services Real Estate
DF Deutsche Forfait AG Financial Services Diversified Financial
InVision Software AG Software Software
ZhongDe Waste Technology AG Industrial Industrial Products & Services
EnviTec Biogas AG Industrial Renewable Energies
Centrotherm photovoltaics AG Industrial Renewable Energies
Hamburger Hafen und Logistik AG Transportation & Logistics Transportation Services
FranconoWest AG Financial Services Real Estate
MeVis Medical Solutions AG Software Software
Asian Bamboo AG Basic Resources Forest & Paper Products
References
Affleck-Graves, J., Hegde, S. and Miller, R.E. (1996), Conditional Price Trends in the Aftermarket for Initial Public Offerings, in: Financial Management, Vol. 25, 25-40. Aggarwal, R. and Rivoli, P. (1990), Fads in the Initial Public Offering Market? in: Financial
Management, Vol. 19, 45-57.
Barry, C. B., Muscarella, C. J., Peavy, J. W., and Vetsuypens, M. R. (1990), The Role of Venture Capital in the Creation of Public Companies: Evidence from the Going-Public Process, in: Journal of Financial Economics, 27, 447-471.
Bergström, C., Nilsson, D. and Wahlberg, M. (2006), Underpricing and Long-Run Performance Patterns of European Private-Equity-Backed and Non-Private-Equity-Backed IPOs, in: Journal of Private Equity, Fall 2006, Vol. 9, Issue 4, 16-47.
Bessler, W. and Thies, S. (2007), The Long-Run Performance of Initial Public Offerings in Germany, in: Managerial Finance, Vol. 33 No. 6, 420-441.
Brau, J. C., Brown, R. A. and Osteryoungand, J. S. (2004), Do Venture Capitalists Add Value to Small Manufacturing Firms? An Empirical Analysis of Venture and Nonventure Capital-Backed Initial Public Offerings, in: Journal of Small Business Management, 42(1), 78-92.
Brav, A. and Gompers, P. (1997), Myth Or Reality? The Long-Run Underperformance of Initial Public Offerings: Evidence for Venture and Nonventure Capital-Backed Companies, in: The Journal of Finance, Vol. 52, No. 5 (Dec., 1997), 1791-1821.
BVK (2006), BVK Studie: IPO-Markt 2006 – Einschätzung der aktuellen Börsensituation aus Sicht der deutschen Beteiligungsgesellschaften, in: May 23rd, 2006, http://www.bvk-ev.de/media/file/61.IPO2006.pdf, accessed: May 19th, 2008.
BVK (2007), BVK Studie: IPO-Markt 2007 – Einschätzung der aktuellen Börsensituation aus Sicht der deutschen Beteiligungsgesellschaften, in: June 07th, 2007, http://www.bvk-ev.de/media/file/121.BVK_Studie_IPO-Markt_2007_070607.pdf, accessed: March 18th, 2008.
BVK (2008), Interview with Mr. Dahmann, Employee of BVK, April 17th, 2008.
Camp G., Comer, A. and How, J. C. Y. (2006), Incentives to Underprice, in: Accounting and Finance, 46, 537-551.
Chalk, A.J. and Peavy, J.W. (1987), Initial Public Offerings: Daily Returns, Offering Types and the Price Effect, in: Financial Analysts Journal, Vol. 43, 65-9.
Cünnen, A., Maisch, M. and Landgraf, R. (2004), Enttäuschte Hoffnungen, in: Handelsblatt, December 23rd, 2004.
Deutsche Bank Research (2006), Venture Capital in Europa: Mehr Pep für Europas Wirtschaft, in: Novermber 24th, 2006, http://www.dbresearch.de/PROD/DBR_ INTER-NET_DE-PROD/PROD0000000000204258.pdf;jsessionid= EF02BAD222B234DBC1E75738D B3310BB.srv12-dbr-de, accessed: May 23rd, 2008.
Deutsche Bank Research (2008), Venture Capital: Brücke zwischen Idee und Innovation?, in: February 25th, 2008, http://www.dbresearch.de/PROD/DBR_ INTERNET_DE-PROD/PROD0000000000221135.pdf, accessed: May 23rd, 2008.
Deutsche Börse AG (2008a), Börsengänge im Regulierten Markt, http://deutsche-boer-se.com/dbag/dispatch/de/ers/gdb_navigation/listing/50_Reports_and_Statistics/10_Pri mary_Market_Statistics/10_New_Issues/ers_query/M_Boersengaenge.kir?boersenga
ng=1&selJahr=2008&sort=IPODatum&selTransparenzstandard=-1&selTransaktion=0&selBranche=-1&x=14&y=3, accessed: February 2nd, 2008. Deutsche Börse AG (2008b), Gewichtung und Kennzahlen,
http://deutsche-boer-se.com/dbag/dispatch/de/kir/gdb_navigation/market_data_analytics/20_indices/40_sta tistics_analytics/10_weighting_and_related_values, accessed: February 9th, 2008. Ernst & Young (2007), How Do Private Equity Investors Create Value?: A Study of 2006 Exits in
the US and Western Europe, http://www.ey.com/global/content.nsf /US/TAS_-_How_Do_Private_Equity_Investors_Create_Value, accessed: May 25th, 2008. Franzke, S. A. (2003), Underpricing of Venture-Backed and Non Venture-Backed IPOs:
Germany’s Neuer Market, in: Working Paper, No. 3, RICAFE - Risk Capital and the Financing of European Innovative Firms, November 2003. http://ssrn.com/ abstract=482544m accessed: March 20th, 2008.
Handelsblatt (2004), Preiskampf um die Aktien von Wincor Nixdorf, in: Handelsblatt, May 05th, 2004.
Handelsblatt (2005), MTU Aktie soll 25 bis 30 Euro wert sein, in: Handelsblatt, May 23rd, 2005.
Handelsblatt.com (2006), Klöckner und Co bietet Aktien zu 15 bis 18 Euro an, in: Handels-blatt.com, June 21st, 2006.
Kamp, L. and Krieger, A. (2005), Die Aktivitäten von Finanzinvestoren in Deutschland: Hin-tergründe und Orientierungen, in: July 2005, http://www.boeckler.de /pdf/mbf_investgesellschaften_2005.pdf, accessed: April 26th, 2008.
Loughran, T. and Ritter, J. R. (1995), The New Issues Puzzle, in: The Journal of Finance. Vol. 50. No. 1, 23-51.
Loughran, T., and Ritter, J. R. (2002), Why Don’t Owners Get Upset about Leaving Money on the Table in IPOs?, in: Review of Financial Studies, 15, 413-443.
Megginson, W. L. and Weiss, K. A. (1991), Venture Capitalist Certification in Initial Public Offers, in: Journal of Finance, 46(3), 879-903.
Ritter, J. R. (1991), The Long-Run Performance of Initial Public Offerings, in: The Journal of Finance; Vol. 46, 3-27.
Rock, K. (1986), Why new issues are underpriced, in: Journal of Financial Economics; Vol. 15, 187-212.
Schnell, Ch. (2004), Die richtigen Schlüsse ziehen, in: Handelsblatt, April 14th, 2004.
Schuster, J.A. (1995), Underpricing and Crises: IPO Performance in Germany, in: Working Paper, London School of Economics.
Shapiro, R. J. and Pham N. D. (2008), American Jobs and the Impact of Private Equity Transactions, in: Private Equity Council, January 2008, http://www.privateequity council.org/ wordpress/wp-content/uploads/pec-jobs-study-01-17-08.pdf, accessed: May 25th, 2008.
Yahoo Finanzen (2008), Historische Kurse, http://de.finance.yahoo.com/m8, accessed: May 15th, 2008. February 14th, 2008 – June 13th 2008.
Kleine und mittelgroße Unternehmen im globalen Innovationswettbewerb. Technikgestaltung, Internationalisierungsstrategien,
Beschäftigungsschaffung
Herausgegeben von
Roland Abel, Hans H. Bass und Robert Ernst-Siebert
Können kleine und mittelgroße Unternehmen, die ‘Jobmaschinen’ der Volkswirtschaft, durch Innovationen Wettbewerbsvorteile auf internationalen Märkten erzielen? Welche Faktoren fördern, welche hemmen ihre Innovationskraft? Und was kann, was soll die Wirtschaftspolitik tun? Antworten auf diese Fragen geben Wirtschaftswissenschaftler und Soziologen in diesem
Band. Dabei finden vier Blickwinkel Berücksichtigung: betriebliche,
betriebsübergreifende, wirtschaftspolitische und weltwirtschaftliche Perspek-tiven. Kontroverse Positionen und unterschiedliche wissenschaftliche Ansätze werden deutlich gemacht. Dieser Band ist unverzichtbar für alle, die sich in der aktuellen Diskussion mit dem Mittelstand, mit der Globalisierung, mit Arbeitsmarktpolitik und Innovationstheorie beschäftigen.
Mit Beiträgen von Utz Dornberger, Gerhard M. Feldmeier, Jörg Freiling, Ernst Mönnich, Bettina Peters, Axel Sell, Astrid Ziegler und anderen.
ISBN 978-3-86618-076-5 400 Seiten, 29,80 Euro
KMU im globalen Innovationswettbewerb.
Eine Untersuchung des betriebsgrößenspezifischen
Innovationsverhaltens und innovationsinduzierter Beschäftigungseffekte
von Robert Ernst-Siebert
Innovationen sind die Triebfeder wirtschaftlicher Entwicklung und damit auch maßgeblich für die Beschäftigungsentwicklung. Kleine und mittelgroße Unternehmen (KMU) unterscheiden sich nicht nur hinsichtlich ihrer materiellen Voraussetzungen bei der Durchführung von Innovationsprojekten, sondern auch im Hinblick auf die Art und Weise, mit der Neuerungen generiert werden. Aus Sicht der Innovations- und Technologiepolitik interessieren vor allem die Fragen, inwieweit die Einbindung von KMU in das Nationale Innovationssystem gelungen ist, sowie die Frage, ob die derzeit angewendeten Förderinstrumente geeignet sind, um vorhandenes Innovationspotential zu aktivieren und nutzbar zu machen. Auf der Basis einer empirischen Primärerhebung sowie betrieblicher Fallstudien wird am Beispiel von drei Branchen das Innovationsverhalten von KMU, die Beschäftigungswirkung von Innovationen sowie die Relevanz innovations- und technologiepolitischer Förderinstrumente untersucht.
ISBN 978-3-86618-218-9 220 Seiten, 27,80 Euro www.Hampp-Verlag.de