University of North Florida University of North Florida
UNF Digital Commons
UNF Digital Commons
UNF Graduate Theses and Dissertations Student Scholarship
2019
Simulation Exploration of the Potential of Connected Vehicles in
Simulation Exploration of the Potential of Connected Vehicles in
Mitigating Secondary Crashes
Mitigating Secondary Crashes
Mike Alvin SolokaFollow this and additional works at: https://digitalcommons.unf.edu/etd
Part of the Civil Engineering Commons, and the Transportation Engineering Commons
Suggested Citation Suggested Citation
Soloka, Mike Alvin, "Simulation Exploration of the Potential of Connected Vehicles in Mitigating Secondary Crashes" (2019). UNF Graduate Theses and Dissertations. 928.
https://digitalcommons.unf.edu/etd/928
This Master's Thesis is brought to you for free and open access by the Student Scholarship at UNF Digital Commons. It has been accepted for inclusion in UNF Graduate Theses and Dissertations by an authorized administrator of UNF Digital Commons. For more
SIMULATION EXPLORATION OF THE POTENTIAL OF CONNECTED VEHICLES IN MITIGATING SECONDARY CRASHES
by
Mike Alvin Soloka
A thesis submitted to the School of Engineering
in partial fulfillment of the requirements for the degree of
Master of Science in Civil Engineering
UNIVERSITY OF NORTH FLORIDA
COLLEGE OF COMPUTING, ENGINEERING, AND CONSTRUCTION
December 2019
The thesis titled “Simulation Exploration of the Potential of Connected Vehicles in Mitigating Secondary Crashes on Freeways” submitted by Mike Alvin Soloka in partial fulfillment of the requirements for the degree of Master of Science in Civil Engineering has been:
Approved by the thesis committee: Date:
Dr. Thobias Sando,
Co-Advisor and Committee Chairperson
Dr. Priyanka Alluri,
Co-Advisor and Committee Member
Dr. Brian Kopp, Committee Member
Dedicated to
My Creator, The Almighty God.
My first educators, my Father and Mother, Paul and Rose.
ACKNOWLEDGEMENTS
I would like to express my heartfelt gratitude to everyone who helped or contributed to the
success of this work. I would especially like to thank Dr. Thobias Sando, my supervisor, for the
opportunity to further my education at the University of North Florida. His guidance, support and
exceptional intellect has been the much-needed catalyst for the completion of this research work.
I would also like to specially thank Dr. Brian Kopp and Dr. Priyanka Alluri for their intellectual
guidance and input in this work and for serving on my thesis committee.
Finally, I would like to thank all the Transportation Lab members at UNF and friends that have
worked with me in one way or another in the realization of this work and made the last year
TABLE OF CONTENTS
ACKNOWLEDGEMENTS ... ii
TABLE OF CONTENTS ... iii
LIST OF TABLES ... vi
LIST OF FIGURES ... vii
LIST OF ACRONYMS/ABBREVIATIONS ... viii
ABSTRACT ... xi
CHAPTER 1 Introduction ... 12
Background ... 12
Study Objective ... 13
Thesis Organization... 13
CHAPTER 2 Literature Synthesis ... 14
Literature Review ... 14
Secondary Crashes ... 14
Identification of SCs ... 16
Connected Vehicles (CVs) ... 18
Incident Detection ... 23
Incident Information Dissemination ... 27
Safety Surrogate Measures in Safety Evaluation ... 31
Conflicts Validity and Crash Prediction ... 32
Objective ... 34
CHAPTER 3 Methodology ... 35
Study Area ... 35
Simulation Test Bed and Data Inputs ... 38
VISSIM Model Calibration and Validation... 38
Data Collection ... 39
Base Model Development and Verification ... 40
Number of Simulation Runs ... 43
Error Checking ... 46
Model Calibration and Validation ... 48
Model Calibration Results ... 60
CV environment modeling ... 61
Incident modeling ... 63
Traffic Volumes ... 64
Safety Evaluation ... 66
Safety Surrogate Measures ... 66
CHAPTER 4 Results AND DISCUSSION ... 68
SSAM Conflict Results ... 68
AM Period Results... 68
PM Period Results ... 76
Speed Profiles ... 82
AM Period Speed Profiles ... 82
PM Period Speed Profiles ... 86
Statistical Comparison of Conflicts ... 90
CHAPTER 5 CONCLUSIONS AND RECOMMENDATIONS ... 93
Recommendations for Future Work ... 94
Conflict Map Diagrams from SSAM ... 96 REFERENCES ... 103
LIST OF TABLES
Table 2-1: Previous Studies on SC Identification ... 17
Table 2-2: Some incident detection algorithms and data needs ... 25
Table 3-1: Hourly Volume Conversion Factor ... 43
Table 3-2: Average Performance Measures from Preliminary Simulation Runs ... 45
Table 3-3: Model Verification (Error Checking) Process Checklist ... 46
Table 3-4: Model Calibration Targets ... 50
Table 3-5: VISSIM Model Calibration Parameters ... 55
Table 3-6: Freeway Volumes – AM Peak Hour ... 58
Table 3-7: Freeway Volumes – PM Peak Hour ... 58
Table 3-8: Ramp Volumes – AM Peak Hour ... 59
Table 3-9: Ramp Volumes – PM Peak Hour ... 59
Table 3-10: Model Freeway Calibration Parameters ... 60
Table 3-11: Arterial Calibration Parameters ... 61
Table 3-12: Mean duration of Freeway Incidents (HCM, 2016) ... 63
Table 3-13: Traffic Volumes used in the simulation model ... 65
Table 3-14: Hourly volumes as a proportion of the peak hour volume ... 66
Table 4-1: Percent change in total traffic conflicts during the AM period ... 71
Table 4-2: Summary of conflicts with TTC = 0 and TTC > 0 ... 73
Table 4-3: Percent change in total traffic conflicts during the AM period (TTC > 0) ... 75
Table 4-4: Percent change in total traffic conflicts during the PM Period ... 79
Table 4-5: Percent change in conflicts with TTC > 0 during the PM period... 81
LIST OF FIGURES
Figure 2-1: Factors Contributing to Secondary Crashes ... 15
Figure 2-2: Incident Detection and Verification Approaches ... 28
Figure 3-1 (a) Study area along Florida’s Turnpike Mainline (SR-91); (b) VISSIM Model ... 36
Figure 3-2: Traffic Analysis Tools (FDOT Systems Planning Office, 2014) ... 38
Figure 3-3: FHWA Initial Modeling & Calibration Process (Dowling et al., 2004) ... 39
Figure 3-4: VISSIM Model Study Area... 42
Figure 3-5 Incident modeled in VISSIM using COM API ... 64
Figure 3-6: Operational concept of SSAM & SSAM conflict angle diagram ... 67
Figure 4-1: SSAM Total Conflicts during the AM Peak Period ... 70
Figure 4-2: SSAM Conflicts during the AM Peak Period (TTC > 0) ... 74
Figure 4-3: SSAM Total conflicts during the PM Peak Period ... 78
Figure 4-4: SSAM Conflicts during the PM Peak Period (TTC > 0) ... 80
Figure 4-5: Speed profiles during the incident (AM pre-peak hour) ... 83
Figure 4-6: Speed profiles during the incident (AM peak hour) ... 84
Figure 4-7: Speed profiles during the incident (AM post-peak hour) ... 85
Figure 4-8: Speed profiles during the incident (PM pre-peak hour) ... 87
Figure 4-9: Speed profiles during the incident (PM peak hour) ... 88
LIST OF ACRONYMS/ABBREVIATIONS
AID Automatic Incident Detection
ATDM Active Transportation and Demand Management
ATIS Advanced Traveler Information Systems
AVI Automatic Vehicle Identification
API Application Programming Interface
CCTV Closed-circuit Television
CME Certificate Management Entities
CMS Changeable Message Sign
COM Component Object Model
CV Connected Vehicles
DOT Department of Transportation
DMS Dynamic Message Signs
DR Detection Rate
DSRC Dedicated Short Range Communication
FAR False Alarm Rate
FDOT Florida Department of Transportation
FHWA Federal Highway Administration
GPS Global Positioning System
HCM Highway Capacity Manual
ICT Information and Communication Technology
LOS Level of Service
LTE Long-Term Evolution
MOE Measure of Effectiveness
MTTD Mean Time to Detect
NHTSA National Highway Traffic Safety Administration
OBU On-Board Unit
PET Post Encroachment Time
PKI Public Key Infrastructure
PM Performance Measure
RMSNE Root Mean Square Normalized Error
RSU Roadside Unit
SC Secondary Crash
SCDOT South Carolina Department of Transportation
SCMS Security Credential Management Systems
SSAM Surrogate Safety Assessment Model
THEA Tampa-Hillsborough Expressway Authority
TIM Traffic Incident Management
TMC Traffic Management Center
TRANSYT-7F Traffic Network Study Tool, Version 7F
TTC Time-to-Collision
VANET Vehicle Ad-hoc Network
VB Visual Basic
VISSIM Verkehr In Städten Simulationsmodell
VMS Variable Message Sign
VSL Variable Speed Limit
V2I Vehicle-to-Infrastructure
V2V Vehicle-to-Vehicle
V2X Vehicles to Everything
ABSTRACT
Secondary crashes (SCs) on freeways are a major concern for traffic incident management
systems. Studies have shown that their occurrence is significant and can lead to deterioration of
traffic flow conditions on freeways in addition to injury and fatalities, albeit their magnitudes are
relatively low when compared to primary crashes. Due to the limited nature of crash data in
analyzing freeway SCs, surrogate measures provide an alternative for safety analysis for freeway
analysis using conflict analysis.
Connected Vehicles (CVs) have seen compelling technological advancements since the concept
was introduced in the 1990s. In recent years, CVs have emerged as a feasible application with
many safety benefits especially in the urban areas, that can be deployed in masses imminently.
This study used a freeway model of a road segment in Florida’s Turnpike system in VISSIM
microscopic simulation software to generate trajectory files for conflict analysis in SSAM
software, to analyze potential benefits of CVs in mitigating SCs.
The results showed how SCs could potentially be reduced with traffic conflicts being decreased
by up to 90% at full 100% composition of CVs in the traffic stream. The results also portrayed
how at only 25% CV composition, there was a significant reduction of conflicts up to 70% in low
traffic volumes and up to 50% in higher traffic volumes. The statistical analysis showed that the
difference in average time-to-collision surrogate measure used in deriving conflicts was significant
at all levels of CV composition.
CHAPTER 1 INTRODUCTION Background
Freeway crashes that occur as a result of prior incidents (or primary incidents), also termed as
secondary crashes (SCs), are a major concern for traffic incident management systems.
Researchers and professionals have therefore been trying to study SCs for more than two decades,
while relentlessly looking for new ways of predicting and preventing their occurrences with limited
success. In addition to injury, fatalities, and loss of property, SCs can also result in additional
traffic congestion and delay by speed reduction, queue formation, driver distraction and blocking
of lanes. About three decades ago, incident delay was attributed to 61% of all urban freeway delay
and was projected to be approximately 70% by 2005 (Lindley, 1987). Reports have stated that
SCs range from 14 to 30% of all crashes while an estimated 18% of fatalities on freeways are
caused by SCs (Owens et al., 2010).
Connected Vehicle (CV) technology has significantly advanced since the concept was introduced
in the 1990s through the Automated Highway Systems (AHS) research and later developed under
the Vehicle Infrastructure Initiative (VII) in 2003 (Harding et al., 2014). Currently, CV
deployments are being tested and carried out in some areas in the nation and is showing promising
results in helping mitigate not only SCs but all crashes in general.
Until recently, limited studies have explored the benefits that come with the implementation of the
CV technology in mitigating SCs on freeways through microscopic simulation studies. Existing
studies on SCs mainly focus on identification, analysis of characteristics and risk modeling (Yang,
the SC risk through indirect safety analysis by using microscopic simulation software and conflict
analysis software packages.
Study Objective
The objective of this study is to evaluate the potential benefits associated with the presence of CVs
in the traffic stream in the reduction of SCs. In particular, the reduction of safety surrogate
measures in the CV environment with both vehicle-to-vehicle (V2V) and vehicle-to-infrastructure
(V2I) communications. Thus, this study presents an evaluation of traffic flow conditions in the
event of an incident that causes partial blockage of the travel lanes on a freeway segment in a CV
environment. Traffic simulation was done in VISSIM microscopic simulation software and the
safety evaluation was conducted using the SSAM software.
Thesis Organization
This thesis contains 5 chapters. Chapter 1 provides a general background of the study and an
overview of the research problem, as well as the objective of the study. Chapter 2 provides a review
of literature relevant to the study including a description of SCs and a background of CVs and their
applications. Chapter 3 discusses the approach and methodology used in the study including the
study site and the simulation test bed adopted for the study. It also gives a description of the tools
used in the study. Chapter 4 goes on to describe the preliminary results obtained from the study
and gives a discussion of the results. Finally, Chapter 5 gives a conclusion based on the results and
CHAPTER 2 LITERATURE SYNTHESIS Literature Review
Secondary Crashes
The safety of a freeway facility is defined by the Highway Safety Manual (AASHTO, 2010) as the
number of crashes, by severity, expected to occur on the entity per unit of time. Also in line with
Gettman and Head (Gettman & Head, 2003), highway safety is quantified by using the expected
number of crashes by type, that are expected to occur on an entity in a certain time interval, per
time unit. A secondary crash (SC) is described as an incident that occurs within two hours from
the onset of a primary incident and also within two miles downstream of the primary incident
location (Chang & Rochon, 2011; Hirunyanitiwattana & Mattingly P, 2006; Jalayer,
Baratian-Ghorghi, & Zhou, 2015; Kopitch & Saphores, 2011; Moore, Giuliano, & Cho, 2004; Tian, 2015).
Since secondary crashes (SCs) account for nearly 20% of all crashes and about 18% of fatalities
occurring on freeways (Owens et al., 2010), they have significant occurrences especially on
freeways across the nation. In mitigating the risk of SCs, therefore, a key element of traffic incident
management is achieved. However, only a few studies have focused on utilizing specific measures
to mitigate SCs (Karlaftis, Latoski, Richards, & Sinha, 1999; Kopitch & Saphores, 2011; Hyoshin
Park & Haghani, 2016; Hyoshin Park, Haghani, Samuel, & Knodler, 2018; Yang et al., 2017).
Prior to establishing methods to mitigate SCs, it is essential to identify the various factors that
contribute to their occurrence.
From previous studies, the various attributes that have been found to significantly influence the
risk of SCs include primary incident characteristics, real-time traffic characteristics and weather
Figure 2-1: Factors Contributing to Secondary Crashes
Studies have further stated that severity and clearance durations of a primary incident are the major
contributors to the occurrence of SCs (Sando et al., 2018; Yang, Wang, Xie, Ozbay, & Imprialou,
2018). In one study, the likelihood of SCs was observed to increase by 2.8% for each additional
minute required to clear the initial crash (Owens et al., 2010). An increase of 2 to 3 minutes of
incident duration was also shown to potentially lead to a 1 percentage point increase in the
likelihood of a secondary crash by a different study (Goodall, 2017). A study in Maryland that
assumed a linear correlation between secondary crashes and incident duration, the reduction of
secondary incidents was estimated to stand at 41.35 percent with a count of 495 potentially reduced
incidents (Chang & Rochon, 2011).
To prevent the risk of SC occurrence, the impact of the primary incident must be mitigated in a
timely manner (Kitali et al., 2018). Previous studies have largely focused on exploring the potential
SCs (Yang et al., 2018). Incident responding agencies, such as highway patrol, emergency medical
services, towing agencies, etc., could be better prepared to respond to potential SCs when
conditions associated with a high likelihood of occurrence exist. Nonetheless, the implementation
of this countermeasure is challenging due to the limited resources available, e.g., patrol vehicles,
personnel, traffic surveillance systems, etc. Moreover, each primary incident may occur during
different conditions, resulting in different impacts. For example, an incident responder may be
hindered by a long queue, thus delaying the process of incident clearance (Yang et al., 2018).
In addition to the optimal allocation of emergency response units, another approach explored by
previous studies is the use of advance warning messages. The warning messages may include
speed advisory, lane change advisory, and possible detour messages, among others, which could
help drivers recognize traffic conditions in advance and thus act accordingly to improve both safety
conditions and traffic flow.
Identification of SCs
The two commonly used methods of identification of SCs are the static method and the dynamic
method. The static method uses fixed spatiotemporal thresholds whereas the dynamic method uses
spatial and/or temporal thresholds that change depending on queue lengths, roadway types and
other relevant factors.
Many studies have used the static methods which are determined using either a fixed duration or
clearance time plus selected additional recovery time as the temporal background (Asad Khattak,
Wang, & Zhang, 2009; Kopitch & Saphores, 2011; Pigman, Green, & Walton, 2011; Tian, 2015;
Zhan, Gan, & Hadi, 2009). Some of these studies have spatiotemporal thresholds that extend in
opposite direction of traffic. Many studies have also used dynamic methods to classify crashes as
SCs, using mostly queue lengths and incident duration (A. Khattak, Wang, Hongbing, & Mecit,
2011; Kitali et al., 2018; Yang, Bartin, & Ozbay, 2013; Zhan et al., 2009; Zheng, Chitturi, Bill, &
Noyce, 2014).
Although it is usually difficult to accurately classify an incident as a secondary crash, and link an
initial incident to the secondary incident (Moore et al., 2004), most of the previous studies use
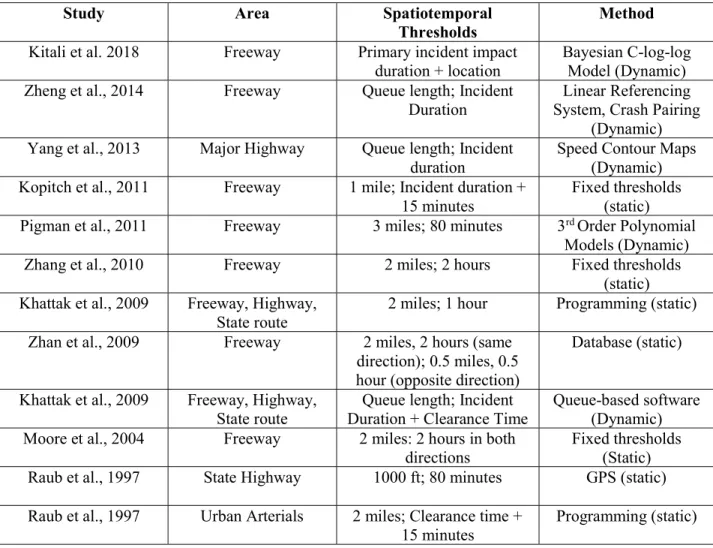
reasonable methods which provide a near accurate identification of the SCs. Table 1-1 shows a
summary of previous studies on identification of SCs using the static and/or dynamic methods.
Table 2-1: Previous Studies on SC Identification
Study Area Spatiotemporal
Thresholds
Method
Kitali et al. 2018 Freeway Primary incident impact duration + location
Bayesian C-log-log Model (Dynamic) Zheng et al., 2014 Freeway Queue length; Incident
Duration System, Crash Pairing Linear Referencing (Dynamic) Yang et al., 2013 Major Highway Queue length; Incident
duration
Speed Contour Maps (Dynamic) Kopitch et al., 2011 Freeway 1 mile; Incident duration +
15 minutes
Fixed thresholds (static) Pigman et al., 2011 Freeway 3 miles; 80 minutes 3rd Order Polynomial
Models (Dynamic)
Zhang et al., 2010 Freeway 2 miles; 2 hours Fixed thresholds
(static) Khattak et al., 2009 Freeway, Highway,
State route
2 miles; 1 hour Programming (static)
Zhan et al., 2009 Freeway 2 miles, 2 hours (same
direction); 0.5 miles, 0.5 hour (opposite direction)
Database (static) Khattak et al., 2009 Freeway, Highway,
State route
Queue length; Incident Duration + Clearance Time
Queue-based software (Dynamic) Moore et al., 2004 Freeway 2 miles: 2 hours in both
directions
Fixed thresholds (Static)
Raub et al., 1997 State Highway 1000 ft; 80 minutes GPS (static)
Raub et al., 1997 Urban Arterials 2 miles; Clearance time +
Since this study is focused on evaluation of CVs in mitigation of secondary crashes, it was
important to examine how the different static and dynamic methods from different studies have
been used to identify and classify crashes for the sake of creating a threshold for measuring
conflicts that can be associated with a likely secondary crash. In this sense, a spatial threshold of
2 miles and a temporal threshold of 30 minutes plus the incident duration were chosen for the
analysis. This selection was done through visual inspection of the maximum queue length due to
the modeled incident as well as the queue dissipation time observed in the microscopic simulation
process.
Connected Vehicles (CVs)
CVs are vehicles equipped with technologies that facilitate communication with their environment.
This connected environment helps the CVs to send messages to other vehicles in what is termed
as Vehicle (V2V) communication, as well as to the infrastructure in
Vehicle-to-Infrastructure (V2I) communication. These communications use onboard devices to convey
information about a vehicle’s status such as speed, heading, brake status, and other information to
other vehicles and receive similar information from other CVs. The messages exchanged between
vehicles have range and line-of-sight capabilities that exceed current stand-alone vehicle sensing
technologies (Harding et al., 2014).
CVs have the potential of improving transportation incident management (Iqbal, Khazraeian, &
Hadi, 2018), given their capability to communicate important information between themselves and
the surrounding infrastructure. This potential coupled with some roadside equipment can
subsequently provide the ability to alert drivers of downstream incidents, which can lead to
of SCs. Not only can CVs be used to detect incidents, but the messages sent, such as speed
advisory, lane change advisory and detour messages can be highly effective in reducing the risk of
SCs.
Intervehicle Communication (IVC)
The FCC reported in 1999, its decision to use the 5.850-5.925 GHz band for a variety of Dedicated
Short-Range Communications (DSRC) uses, including traffic light control, traffic monitoring,
travelers’ alerts, automatic toll collection, traffic congestion detection, emergency vehicle signal
preemption of traffic lights and electronic inspection of moving trucks through data transmissions
with roadside inspection facilities (Federal Communications Commission, 1999). The addition of
the spectrum was provided to further national goals including those of the Department of
Transportation, ITS industry and Congress in the improvement of efficiency of the U.S.
transportation system while also facilitating the growth of ITS.
The fostering of global research, technological innovations, industry standards-setting activities
which could lead to the production of less expensive DSRC equipment are among key expectations
that were speculated to arise with the allocation of the 75 megahertz for DSRC. Further,
interoperability and perpetual development of the DSRC technology at a nationwide or even global
level was expected to be encouraged with a significant allocation of DSRC.
In 2013, the FCC proposed the possibility and began the proceeding for the potential use of
portions of the dedicated spectrum 5.9GHz band for unlicensed use on a share basis with DSRC,
owing to the high demand of wireless broadband services and the future growth expectation, and
In November 2018, the FCC released a notice of proposed rulemaking to repurpose the lower 45
megahertz of the band for unlicensed operations to support faster broadband applications. This
would leave only 30 megahertz dedicated for the use of DSRC applications. Further, the revision
of the current ITS rules for the 5.9 GHz band was proposed to allow C-V2X (Cellular Vehicle to
Everything) operations in the upper 20 megahertz of the band (5.905-5.925 GHz). The proposed
rulemaking would also seek comment on whether to retain the remaining 10 megahertz for DSRC
or dedicate it to C-V2X.
The DSRC system has been designed to provide a short-range wireless link for information transfer
between vehicles and the infrastructure. The links are essential to ITS services that can improve
travelers’ safety, improve traffic mobility and operations, and minimize pollution through
emissions reduction. The FCC stated in its report that the spectral environment and propagation of
characteristic of the 5.9 GHz band are appropriate for DSRC applications, supporting enough
signal coverage and considerable frequency reuse.
The main functional characteristics of DSRC include: a low latency which reduces the delay in
opening and closing of connections in the order of 0.02 seconds; limited interference owing to the
protection by the FCC for transportation applications and a shorth range of about 3000 ft inhibits
interference from further communication signals. DSRC also has a high performance in all weather
conditions which makes it more relevant for transportation applications.
The DSRC service is composed of On-Board Units (OBUs) and Roadside Units (RSUs). An OBU
is a device that is normally mounted in a vehicle to act as a transceiver, and sometimes it may even
be a portable unit. Part 95 of the Rules as given by the FCC, describes the license under which
transceiver that is mounted on infrastructure, along a road or pedestrian passageway. An RSU may
also be mounted on a vehicle or hand carried but is required to operate only when the vehicle or
hand-carried unit is stationary. An RSU broadcasts data to OBUs or exchanges data with OBUs in
its communications zone. The operation of RSUs is governed by Part 90 of the Rules.
CVs also use the Vehicle Ad-hoc Network (VANET) to convey and process signals to and from
roadside units (RSUs) as well as other vehicles in the stream (Ghori, Zamli, Quosthoni, Hisyam,
& Montaser, 2018).
Alternative Communication Technologies
In 2015, a reported stated how congress showed the desire to learn how CV implementations would
not preference the use of any particular communications technology for use in CV operations
(Bettisworth et al., 2015). Through the years, regular comparative analyses led by USDOT have
been done to ensure that multiple choices in the communication technology are considered for use
in CV applications. Through the analyses conducted by USDOT, it has been continually agreed
that DSRC is still, to date, the best viable option for safety-critical applications due to its low
latency properties. Through the same research, however, opportunities for use of other
commercially available technologies such as cellular, satellite, radio, fiber and Wi-Fi, have been
reported. In support of applications that do not necessarily require extremely low signal latency,
as provided by DSRC, such technologies can be used. These applications include but are not
limited to mobility and logistics, traveler and road weather information, security credential
management, field equipment-to-center (backhaul) communications and agency communications
Although the USDOT still considers the 5.9 GHz spectrum in DSRC to be a foundational
requirement for safety-critical CV applications, in recent times, the FCC has not shown full support
for the continued dedication of the spectrum for sole transportation uses. In November 2018, the
FCC proposed a rulemaking that will possibly replace DSRC with Cellular to Everything (C-V2X).
This development has spurred the transportation industry leading to divided attitudes towards the
use of DSRC or other technologies, from both automakers and transportation agencies.
The new Cellular Vehicle to Everything (C-V2X) technology, uses the cellular Long-Term
Evolution (LTE) protocol and its variates to provide wireless communication between vehicles
and other devices. A recent development in the LTE standard known as LTE Sidelink, defined by
3GPP is a promising technology that allows for a more efficient conveyance of communication
signals in comparison to the conventional cellular communications that transmits through cellular
towers or infrastructure (Molina-Masegosa, Gozalvez, & Sepulcre, 2018). The 3rd Generation
Partnership Project (3GPP) is a union of seven telecommunications standard development
organizations that provides an environment for production of reports and specifications that define
the 3GPP technologies.
In Release 14 of the C-V2X standard (also known as LTE-V or LTE-V2X), the 3GPP includes
two modes of operation namely Mode 3 and Mode 4. In both modes, vehicles communicate to
each other directly between them however, in Mode 3, communications still rely on cellular
infrastructure to manage the communications and select sub-channels (Molina-Masegosa et al.,
2018). Mode 4, however, is considered the baseline mode which represents an alternative to
DSRC, eliminating the need for a cellular network through infrastructure. In this mode, vehicles
radio selection scheme for vehicles to communicate as well as the support for distributed
congestion control (Molina-Masegosa & Gozalvez, 2017).
Since safety applications cannot rely on the availability of a cellular network, the development of
the LTE standards by Sidelink may come as the most viable alternative to DSRC and other
technologies for CV applications in the near future. For more in depth review, the reader is
recommended to view an article by (Molina-Masegosa & Gozalvez, 2017), which has provided a
comprehensive overview of the LTE standard for Sidelink 5G V2X vehicle communications.
Incident Detection
Automatic Incident Detection (AID)
Since incident management systems deal with detection and removing of incidents in road
networks, incident detection can be termed as the most important part of an incident management
system (Deniz, Celikoglu, & Gurcanli, 2012). An efficient incident detection method is thus crucial
in any successful incident management system due to the reduction of congestion, possibility of
secondary crashes, and fuel consumption and emissions, stemming from quicker response
(Cambridge Systematics Inc., 2005). Incident detection may be accomplished by driver-based
methods in the form of a report from an observer through a cellular device to an authority or
Automatic Incident Detection (AID) using either probe data or roadway-based sensors. With the
advancement and proliferation of sophisticated mobile devices or “smartphones”, incident
detection can now also be achieved through mobile applications in the driver-based method.
Although incident detection by road users reporting via cellular phones has become common, there
C. Xie & Parkany, 2002). Given these limitations, AID is arguably a more preferred method in the
connected vehicle environment.
With advancement in sensor technologies, AID has developed as a promising incident detection
method over the years. Many algorithms have also been developed to facilitate AID, all of which
have advantages and disadvantages. Some freeway incident detection algorithms include
time-series algorithms, comparative algorithms, the McMaster algorithm, artificial intelligence
algorithms, macroscopic algorithms, and wavelet algorithms (Teng & Qi, 2003). Each of these
algorithm groups further contains multiple algorithms developed by studies over the years. Some
of the algorithms, e.g. the wavelet algorithm, have shown excellent results in incident detection
rates using data denoising and clustering methods (Adeli & Karim, 2000).
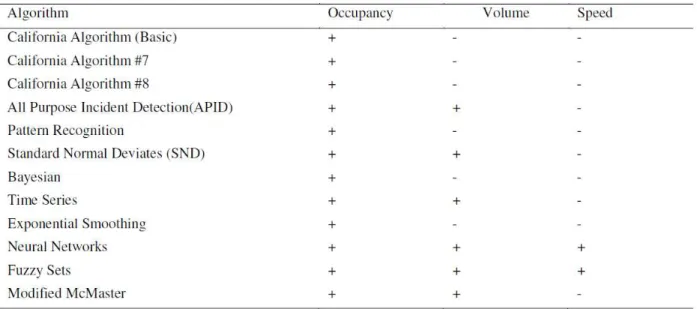
Some measures of effectiveness that have been used to compare and evaluate algorithms include
the false alarm rate (FAR), detection rate (DR) and mean time to detect (MTTD). It has generally
been shown that the performance of the algorithms is related to the incident location and traffic
volume conditions, where higher false alarm rates occur in higher traffic volumes and a lower
MTTD occurs when the incident occurs closer to the upstream detector (Deniz et al., 2012).
Table 2-2 provides a summary of some real-time incident detection algorithms that have been
Table 2-2: Some incident detection algorithms and data needs (Deniz et al., 2012)
According to the FHWA (Owens et al., 2010), some of the commonly used methods used in the
detecting incidents include:
Wireless telephone calls from motorists
CCTV cameras viewed by operators
Automatic vehicle identification (AVI) combined with detection software
Electronic traffic measuring devices (e.g. video imaging, loop or radar detectors) and algorithms detecting traffic abnormalities
Motorist aid telephones or call boxes
Police patrols
Aerial surveillance
Department of transportation or public works crews via two-way radio
Fleet vehicles (transit and trucking)
Roaming service patrols
Among the mentioned methods, CCTV cameras, automatic vehicle identification (AVI) and
Electronic traffic measuring devices (e.g. video imaging, loop or radar detectors), could be adopted
for automated incident detection.
Automatic vehicle identification (AVI), such as that used by tolling systems has also been tested
and shown to have similar results in detecting incidents when compared to vehicle sensors such as
loop detectors (Pearce & Subramaniam, 1998). Inductive loop sensors also have limitations when
distinguishing high-speed vehicles, low headways, and tall vehicles. Video surveillance methods
have the best success so far in remote incident detection and verification. However, their limited
distribution hinders complete coverage of the roadway networks (Klein, Mills, & Gibson, 2006).
With further advancements in technology, incident detection has become possible using
non-intrusive methods such as probe-based data and cellular data. For instance, it has been reported
that only a 5% population of probe vehicles in traffic can provide adequate information given that
they are well distributed in the traffic (Pearce & Subramaniam, 1998).
CVs in Incident Detection
Through on-board dedicated short-range communications (DSRC) devices, Vehicle Ad-hoc
Network (VANET), or Cellular communications, connected vehicles (CVs) are capable of V2V as
real-time in a connected environment helps by sending and receiving messages to other vehicles and
road-side units (RSUs) (Ghori et al., 2018; Harding et al., 2014).
Since CVs continuously broadcast information that describes their own speed, direction, GPS
position, and acceleration or braking status, as well as that of other capable vehicles surrounding
them, stopped vehicles are expected to be identified with ease from their speed data and verified
to capture incidents. Although data from non-connected vehicles may not be captured directly,
data from CVs at an incident location may be used to detect incidents that have occurred, by
checking traffic measures such as slow-downs, high deceleration rates or hard-braking or stopped
vehicles due to lane blockages.
Incident Information Dissemination
Existing Approaches in Communicating Incidents Advanced Traveler Information Systems
Advanced traveler information systems (ATIS) is regarded as an important part of traffic
management operations. It aids travelers in making decisions regarding their travels either pre-trip
or en-route using information and communication technology (ICT) (Ackaah, Bogenberger,
Bertini, & Huber, 2016). Although ATIS has been reportedly tested for use as early as in the 1960s
in some regions including the USA, Europe and Japan, its advancement was not realized until the
mid to late 1990s after the introduction of the Internet (Skabardonis, n.d.) when the focus shifted
to real-time travel information delivery.
Data sources for traveler information systems include: fixed sensors along the road (either intrusive
or non-intrusive), incident management teams or highway police patrol, closed-circuit television
data can also be obtained as a source from toll tags and cellular phones as well as Bluetooth
sensors. With the increase of market penetration of smartphone users, global positioning system
(GPS) has also become important in the accuracy of data from mobile devices. Private vendors
have also taken advantage of these sources and are continuously working on obtaining data using
mobile device probes (Skabardonis, n.d.). Incident information has been among key road
characteristics that is communicated in ATIS since its establishment.
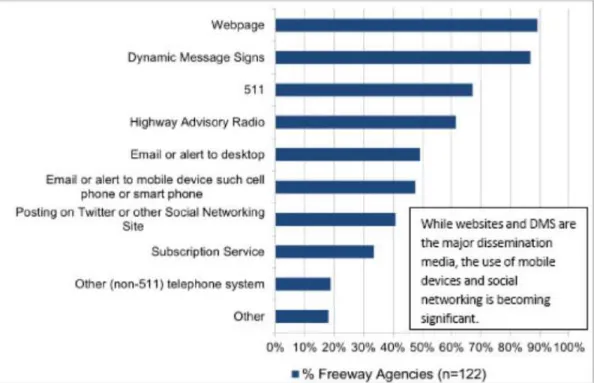
Various methods have been used in ATIS over the years that vary from older ones such as
telephone systems and highway advisory radio to DMS, web-based services such as 511 and
smartphones. Figure 2 shows the distribution of information dissemination among different
platforms based on the USDOT 2011 ITS deployment survey.
The Use of CVs in Information Dissemination
The use of DSRC, VANET and other intervehicle communications enable CVs to communicate
with other vehicles and roadside infrastructure by sending messages continuously between devices
in a connected environment. This connected environment allows the CVs to share messages at low
latencies with other vehicles in vehicle-to-vehicle (V2V) communication, and the infrastructure,
through vehicle-to-infrastructure (V2I) communication (Harding et al., 2014).
V2V and V2I communications allows for vehicle status information including, speed,
direction/heading, acceleration/deceleration, and other relevant information, to be shared between
equipped vehicles and roadside units (RSUs) (Ghori et al., 2018). These messages enable drivers
to be aware of traffic conditions within 1000 feet of other CVs and even miles ahead with
assistance from roadside units and higher compositions of CVs in the traffic stream.
Authentication of CV messages
Like other wireless communication devices, vehicular communication in the CV environment is
also susceptible to attacks and privacy issues. Ghori et al. (2018) conducted a review of VANET
technology and identified and discussed multiple types of system attacks. Attack types mentioned
in the study include GPS and tunneling attack, replay attack, Sybil attack, masquerading attack,
identity disclosure attack, and wormhole attack (Ghori et al., 2018). Many of these types of attacks
can affect both the authenticity and privacy of signals coming from the vehicles, while some, such
as the Sybil attack can compromise the integrity of the signal, resulting in false alarms or
information, such as traffic jams or accidents.
To control the issue of authentication of connected vehicle signals, multiple studies have initiated
privacy of the messages. For example, a two-factor lightweight authentication scheme, developed
by Wang et al. (2016), prevents the tracing of vehicles in the connected environment, even in the
scenario when all RSUs have been compromised. This authentication method has also shown
almost no network delay or packet loss ratio, which can be especially useful in safety applications.
Another proposed method of securing communications uses dual authentication and key
management techniques to securely transmit data in VANETs (Vijayakumar et al., 2016). This
method provides a high level of security in the CVs by preventing unauthorized vehicles from
entering the network. Other methods have also been developed by various researchers (Jiang et al.,
2016; Malik & Panday, 2016; Xie et al., 2016). However, most of these methods have been
disputed as showing some sort of limitation in the authentication process (Ghori et al., 2018).
The use of a Public Key Infrastructure (PKI) security system has been suggested as a solution to
security issues regarding CV messages (Hamilton, 2015). This system allows for digital
certificates to be attached to messages coming to and from vehicles in the connected environment,
thus preventing malicious behavior in the communications. Certificate management entities
(CMEs) perform the functions behind administering a PKI security system, such as registering
users and issuing or revoking certificates, and are what form the system referred to as a Security
Credential Management System (SCMS). Research has proven that this system provides a
framework that enables secure communications in the CV environment (Hamilton, 2015).
CVs and Speed Advisory
Variable speed advisory messages can be used to achieve the desired speed reduction to minimize
hard-braking and high deceleration conditions that can lead to SCs. Driver compliance, as well as
lowered, compared to higher reductions, from posted speeds (Riggins, Bertini, Ackaah, &
Margreiter, 2016). The upstream communication approach often involves an incident warning in
addition to the speed advisory, which may increase the likelihood of driver compliance and
minimize SCs.
CVs and Lane Advisory
Lane-change advisory messages inform drivers of lane blockages resulting from traffic incidents
downstream. The distance between the downstream incident and the upstream lane change
message varies, depending on the method of dissemination. Due to the fixed nature of most DMS
signs, advisory messages may be displayed well upstream of an incident. CV messages, however,
can be delivered to vehicles at variable distances within the range of a vehicle’s signal. The
algorithm should, therefore, vary the advisory information to be disseminated based on incident
characteristics and traffic flow parameters, such as queue formation, traffic flow, and density.
Safety Surrogate Measures in Safety Evaluation
Safety surrogate measures serve as an alternative method of evaluating the crash risk in a highway
facility where crash data are lacking or are insufficient for the task. Several surrogate measures
have been proposed and used in traffic safety engineering. It is also pointed out by one study that
it has been widely accepted that three major conditions should be met to qualify as a good surrogate
measure (Tarko, 2018). Firstly, a surrogate measure properly captures the effect of road and traffic
changes. Second, the surrogate method correlates with the crashes affected by these changes. And
finally, a surrogate measure is practical.
Alternative methods of analyzing safety without relying solely on crash data are found in a study
Surrogate measures have therefore been in use for the past 5 decades to supplement or even
sometimes used a substitute for crash data in transportation safety evaluation. The Federal
Highway Administration has described several safety surrogate measures used in modeling safety
including Time-to-Collision (TTC), Post-Encroachment Time (PET), Deceleration Rate (DR),
Gap Time (GT), and Proportion of Stopping Distance (PSD) (Gettman & Head, 2003).
Surrogate measures have seen limited use in freeway segments while studies have mainly been
using deterministic and experimental queue theories along with incident durations and secondary
crash data to perform safety analysis with some success (Chimba & Kutela, 2014; C. Wang &
Stamatiadis, 2014). However, crash data are only representative of past events and changes in
traffic flows and volumes can affect the expected number of crashes in unpredictable ways
(Dijkstra et al., 2010). Safety surrogate measures provide a means for possibly a much more
effective way of analyzing the safety of a traffic measure.
Conflicts Validity and Crash Prediction
The relationship between traffic conflicts from simulation models and real-world traffic conflicts
and crashes has been addressed by a few researchers without a clear understanding. With crashes
being impossible to simulate, given the programmed nature of vehicles in a microscopic simulation
model, coupled with the lack of a real behavioral component in simulation (Dijkstra et al., 2010),
the relationship becomes even more difficult. Some research has been done to investigate the
relationship between conflicts generated from simulation models and real-world traffic conflicts
(Dijkstra et al., 2010; Huang, Liu, & Li, 2011; Huang, Liu, Yu, & Wang, 2013) and even
provides a foundation for prediction and quantification of conflicts into crashes, for more accurate
safety evaluation.
In a study in Nanjing, China, the researchers compared simulated conflicts generated from SSAM
using VISSIM trajectory files to field-measured conflicts at ten signalized intersections (Huang et
al., 2013). Statistically significant relationships between simulated conflicts and the
field-measured conflicts were observed. Overall, the results suggested a significant relationship exists
between rear-end and crossing conflicts from the simulated models and the field measurements,
with a less pronounced relationship for lane-change conflicts. Also, simulated conflicts were not
found to be indicative of traffic conflicts from unexpected driving maneuvers like illegal
lane-changes in the real world (Huang et al., 2013).
In a similar study also from Nanjing, China, at 6 yield-controlled freeway terminals, results showed
a strong positive linear relationship between simulated and real-world conflicts. The results also
suggested a close relationship exists between severe conflicts when compared to normal traffic
conflicts. Further, it was shown that conflict types were not statistically different between
simulated and field-measured conflicts (Huang et al., 2011).
In the Safety Surrogate Assessment Model (SSAM) validation report (Gettman et al., 2008),
conflicts generated from traffic simulation models were compared among different software and
actual crashes selected from 83 intersections from British Columbia, Canada. Four microscopic
simulation software packages were used and results from each analyzed. Of most interest to this
study among the validation tests carried out in the report, was one that compared conflicts
generated from simulation models to actual crashes through a developed conflicts-based
developed in the report, the goodness-of-fit had a range similar to that found in traditional crash
prediction models in previous studies with similar conditions (Bauer & Harwood, 2000). The
difference in results, however, might have also been attributed to the difference in volumes used
between the two models.
Objective
The objective of this study is to evaluate the potential benefits associated with the presence of CVs
in the traffic stream in the reduction of SCs. In particular, the reduction of safety surrogate
measures in the CV environment with both vehicle-to-vehicle (V2V) and vehicle-to-infrastructure
(V2I) communications. Thus, this study presents an evaluation of traffic flow conditions in the
event of an incident on a freeway segment in a CV environment. Traffic simulation was done in
VISSIM microscopic simulation software and the safety evaluation conducted in the SSAM
CHAPTER 3 METHODOLOGY Study Area
The study was conducted on Florida’s system of toll roads, also known as Florida’s Turnpike. The
system consists of the Mainline from Miami to Central Florida, the Homestead Extension (HEFT),
Sawgrass Expressway, Seminole Expressway, Beachline Expressway, Southern Connector
Extension, Veteran’s Expressway, Suncoast Parkway, Polk Parkway, Western Beltway and the
I-4 Connector. The study area is located on the Turnpike Mainline, which serves traffic from the
central part of the state in Orlando all the way to the southern part in Miami, partially running
almost parallel to the I-95 Interstate Route.
The study model is a 7.8-mile road segment on Florida’s Turnpike Mainline also known as SR-91.
The freeway segment is in Broward County and currently has 3 lanes in one direction and intersects
4 roads namely, Sawgrass Expressway, Sample Road, Copans Road, and Atlantic Boulevard at
intervals ranging from 1 to 2 miles, with interchanges at each of the crossings except at the Copans
Road crossing. The site was chosen due to its relatively high number of crashes in the past year,
2018, compared to other segments along Florida’s Turnpike, based on Signal Four Analytics data.
Figure 2-2 shows the map of the study location and the simulation model for the study, with the
(a) (b)
Figure 3-1 (a) Study area along Florida’s Turnpike Mainline (SR-91); (b) VISSIM Model
VISSIM Microscopic Simulation
Simulations conducted for traffic analysis are either macroscopic or microscopic in nature. In
macroscopic models, traffic processes are described with aggregate quantities like flow and
density, whereas microscopic models analyze the behavior of individual entities as they react to
surrounding traffic and environment in general. Microscopic analysis entails the use of computer Incident
models to reproduce stochastically real traffic flow from transportation facilities (FDOT Systems
Planning Office, 2014). Microscopic models use input information such as traffic volume, facility
type, and vehicle-driver characteristics, to move vehicles in a split-second or time-step basis
through simple gap acceptance, acceleration, and lane change rules. The models cannot optimize
traffic signals as macroscopic models but rather focus on analyzing the complex congested traffic
conditions, especially in urban areas, giving outputs per individual vehicle performances.
VISSIM microscopic simulation tool is a powerful multi-modal modeling software with
capabilities in each of the traffic modes including cars, transit, heavy vehicles, and even
pedestrians. It can also be used to model toll lanes, freeway merge/diverge and weaving segments
as well as exclusive lanes. VISSIM was selected in this study due to its strong capabilities in
modeling incidents or blocked lanes which enables the creation of a secondary crash environment.
It is also possible to model complex traffic conditions in VISSIM such as a CV environment, using
external modules such as the component object model (COM). Further, VISSIM satisfies all
requirements for CV communications as specified in SAEJ2735 (Hyungjun Park et al., 2011). A
model of the freeway segment was created in VISSIM using roadway characteristics and calibrated
to represent real-world freeway operations.
The Calibration process was achieved by following guidelines presented in the Traffic Analysis
Handbook (FDOT Systems Planning Office, 2014) provided by the Florida Department of
Transportation Systems Planning Office, which is described in the model calibration segment of
this thesis. The handbook also supports the selection of VISSIM as an analysis tool for operations
on freeways or limited access highway facilities with higher detail and accuracy with contrast other
Figure 3-2: Traffic Analysis Tools (FDOT Systems Planning Office, 2014)
Simulation Test Bed and Data Inputs VISSIM Model Calibration and Validation
This segment documents the model development and calibration efforts of the VISSIM
microsimulation model used in this study. The VISSIM model was obtained from Florida’s
Turnpike authority as part of the report for model development and calibration process for the
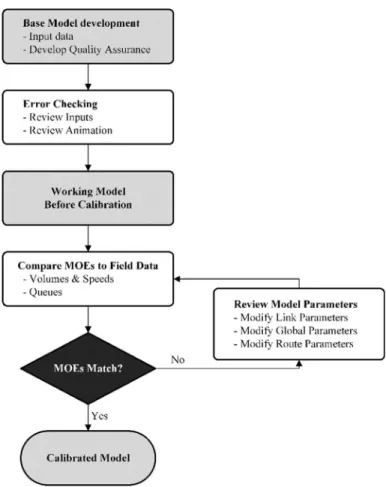
existing 2016 AM and PM peak conditions for the SW 10th Street project in Broward County. The
process covered the general steps as depicted in Figure 3-3, which was extracted from the guide
Figure 3-3: FHWA Initial Modeling & Calibration Process (Dowling et al., 2004)
The calibration process also followed the guidelines provided in the Florida Department of
Transportation (FDOT) Traffic Analysis Handbook: A Reference for Planning and Operations.
The calibration was generally achieved by changing model parameters to replicate results obtained
in the report provided by FDOT.
Data Collection
The data collection process can be described as one of the most time and resource-consuming
components of an analytical study. As such, it is important to identify the essential data that will
requirements in data collection for an effective microscopic analytical study as proposed by the
FHWA (Dowling et al., 2004):
Use of data that are measurable in the field.
Quality and quantity of data influence analysis.
Required analytical accuracy drives the quantity collected.
Use data that are relatively recent.
Use data that are time-variant.
Use contemporaneous data.
For this study, the data used were taken from the report by the FDOT during the model
development and calibration report for the existing 2016 AM and PM peak conditions for the SW
10th Street project. All data collected in the report were gathered in accordance with the FHWA’s
Traffic Analysis Toolbox Volume III: Guidelines for Applying Traffic Microsimulation Modeling
Software.
Base Model Development and Verification
The existing VISSIM network that was used to develop the model in this study was developed by
The Florida Department of Transportation, from previously developed models for Interstate 95
(I-95) and the Sawgrass Expressway. The SW 10th Street of the segment was then added to the model
using 2016 aerial imagery. Roadway features and corresponding dimensions were also extracted
from the aerial imagery and verified on site. The modeled limits of the arterials extended 0.5 miles
network. Figure 3-4 shows the overall project model as well as the study segment selected for this
study.
VISUM software was used in the original model development to transfer and refine
origin-destination information into VISSIM. Bluetooth data was then used to validate the AM and PM
peak conditions estimated for the existing conditions. The original model is as shown in Figure
3-4 with an outline showing the area that was selected for this study.
The morning and evening peak hour periods that were analyzed in the study were from 6:30-9:30
AM and 4:00-7:00 PM. The morning peak hour was from 7:30-8:30 AM while the evening peak
hour was from 5:00-6:00 PM. To develop the buildup and dissipation of congestion during the
peak period, an hour of simulation time was added prior to the peak hour and after the peak hour
respectively. In addition to the buildup and dissipation times, additional 30 minutes were added as
seeding time which loaded the network to equilibrium between entering and exiting vehicles. The
total simulation time was, therefore, 6:00-9:30 AM and 3:30-7:00 PM for the morning and evening
peak hour periods respectively. Table 3-1 shows the splits in total simulation time as well as the
Table 3-1: Hourly Volume Conversion Factor
Simulation Time (Seconds)
AM Condition PM Condition
15 minutes Hourly 15 minutes Hourly
Seed Time 0 - 900 9.38% 22.07% 22.08% 45.34% 900 - 1800 12.69% 23.26% Pre-Peak Hour 1800 - 2700 16.57% 81.55% 22.37% 92.31% 2700 - 3600 19.38% 22.92% 3600 - 4500 21.29% 23.20% 4500 - 5400 24.31% 23.82% Peak Hour 5400 - 6300 25.50% 100.00% 24.25% 100.00% 6300 - 7200 25.32% 25.20% 7200 - 8100 24.74% 25.39% 8100 - 9000 24.44% 25.17% Post-Peak Hour 9000 - 9900 23.60% 87.19% 24.44% 92.82% 9900 - 10800 22.38% 24.07% 10800 - 11700 20.74% 22.83% 11700 - 12600 20.47% 21.48%
Number of Simulation Runs
VISSIM uses random seed numbers in performing simulation runs, to reflect the stochastic nature
of traffic flow. The random seed value initiates a random number generator that assigns a unique
seed number to a simulation run. The random seeds helps vary properties assigned to individual
vehicles entering the network such as: the decision on the vehicle type entering the network, the
time a vehicle enters a network, the lane assigned to a vehicle entering the network, the
aggressiveness of the driving behavior, and the type of interaction once the vehicle is in the
patterns that are observed in the real-world traffic flow in the VISSIM simulation model. This
results in the variation of results from simulation results in which VISSIM calculates additional
meaningful values for result attributes in evaluations such as minimum and maximum values and
means.
Although 10 simulation runs are considered adequate by the FDOT Traffic Analysis Handbook
(FDOT Systems Planning Office, 2014), it is almost impossible to determine the number of
simulation runs to be performed for meaningful statistical analysis and conclusions of the results
without some kind of test. The following formula, recommended by the Traffic Analysis
Handbook, was thus used to determine the number of simulation runs to be carried out for the microscopic study.
𝑛 =
∗ ∝/∗
(Eq. 1)
Where:
n - the required number of simulation runs,
s - the standard deviation of the system performance measure (based on previously
conducted simulation runs),
tα/2 - the critical value of a two-sided Student’s t-statistic, at the level of confidence α and
n-1 degrees of freedom,
µ - the mean of the system performance measure, and
To estimate the sample standard deviation for use in determining the required number of
simulation runs, preliminary simulation runs were carried out. The selected performance measure
for the estimation of the standard deviation was the speed of vehicles in the network. Preliminary
simulation runs were thus carried out for 10 repetitions and the speeds, as well as the standard
deviation, were determined. In the estimation of the standard deviation, the 95% confidence level
was used as recommended in the study by Russo (Russo, 2008).
A different seed number was used for performing a total of 10 simulation runs with 10 total
corresponding seed numbers and the average speeds on the Turnpike mainline freeway and arterial
routes were evaluated as shown in Table 3-2.
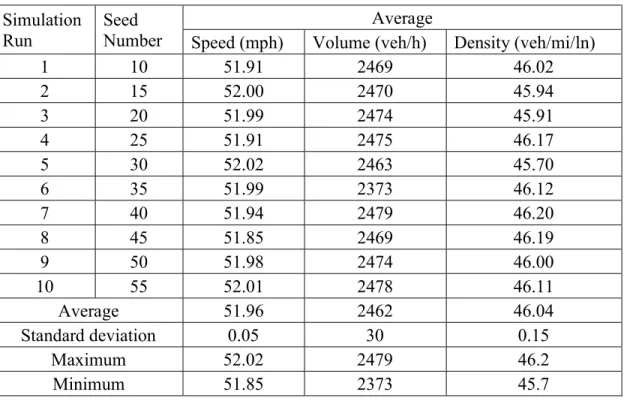
Table 3-2: Average Performance Measures from Preliminary Simulation Runs Simulation
Run
Seed Number
Average
Speed (mph) Volume (veh/h) Density (veh/mi/ln)
1 10 51.91 2469 46.02 2 15 52.00 2470 45.94 3 20 51.99 2474 45.91 4 25 51.91 2475 46.17 5 30 52.02 2463 45.70 6 35 51.99 2373 46.12 7 40 51.94 2479 46.20 8 45 51.85 2469 46.19 9 50 51.98 2474 46.00 10 55 52.01 2478 46.11 Average 51.96 2462 46.04 Standard deviation 0.05 30 0.15 Maximum 52.02 2479 46.2 Minimum 51.85 2373 45.7
A confidence level was determined at the 95% confidence level (α = 0.05). With 9 degrees of
from the statistic table tα/2 was obtained as 2.26. Using the value of 10% as the error tolerance, as
recommended by the Traffic Analysis Handbook, the number of simulation runs computed using
Equation 1 was found to be less than 5. Since the computed number of required simulation runs
were quite low, the value used was chosen to correspond with that recommended in the Traffic
Analysis Handbook by the Florida Department of Transportation (FDOT).
Error Checking
This step of the microsimulation analysis process is important in developing a working model to
ensure that the calibration process that will follow does not result into distorted model parameters
that compensate for the unaccounted-for coding errors. The calibration heavily relies on the
elimination of all errors in model network coding and demand coding.
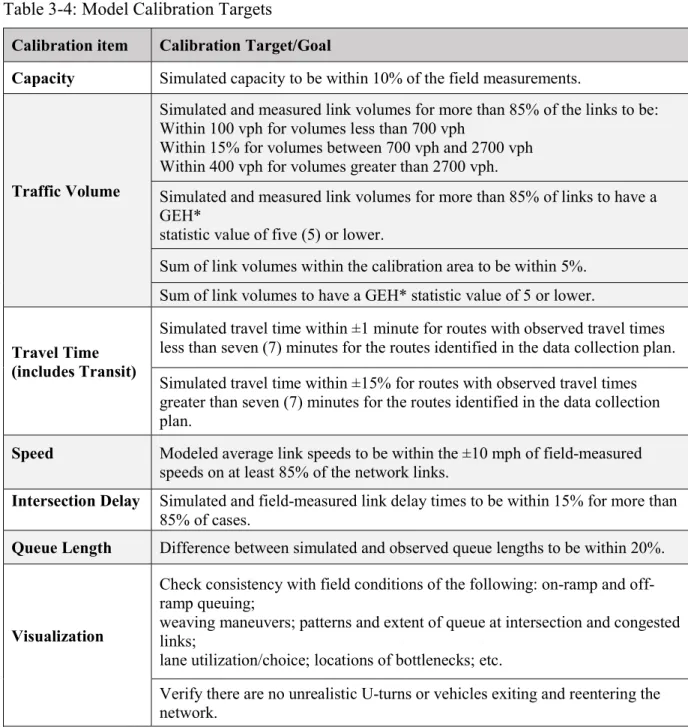
According to the FHWA (Dowling et al., 2004), the error checking process follows the checklist
in Table 3-3, involving various reviews of the coded network, demand, and default parameters, in
the following three stages:
1. Review of software errors
2. Review input coding errors
3. View animation to spot less obvious errors
It is also recommended that residual errors be checked when the simulation model still does not
perform to the analyst’s satisfaction with respect to the field conditions. The residual errors may
sometimes be a result of analyst’s expectations surpassing the capabilities of the software or an
Table 3-3: Model Verification (Error Checking) Process Checklist
Error Type Description Check
Software Verify no runtime or syntax error occurs in the Protocol Window Review the error file (.err) for any errors or runtime warnings that affect simulation results
Review RBC errors or warnings
Model run
parameters Review the temporal boundary limit to confirm it matches the approved methodology Verify initialization period is at least equal to twice the time to travel the entire network
Network Verify the spatial boundary limit against the approved methodology Check basic network connectivity.
Verify the background image has been properly scaled Verify link geometry matches lane schematics Check link types for appropriate behavior parameters
Check for prohibited turns, lane closures and lane restrictions at intersections and on links
Check and verify traffic characteristics on special use lanes against general use lanes
Demand and routing Verify coded volume and vehicle mix/traffic composition
Check HOV vehicle type and occupancy distribution as appropriate Check routing decision including connector look back distances Verify O-D matrices and their placement in the network
Control Check and verify the intersection control type and data are properly coded. Verify vehicles are reacting properly to the controls
Check ramp meter control type and data Check conflict area settings
Traffic operations and management data
Verify bus operations—routes, dwell time Check parking operations
Verify pedestrian operations and delays
Driver and Vehicle
characteristics Check if driver behavior adjustments are necessary in saturated conditions Verify no lane changes occur in unrealistic locations and vehicles make
necessary lane changes upstream in the appropriate location Verify average travel speed reasonably match field conditions
Animation Review network animation with the model run at low demand levels—check for unrealistic operational characteristics such as congestion and erratic vehicle behaviors
Review reasonableness of the model against data coding, route assignment, and lane utilization
Compare model animation to field characteristics
Verify all turn bays are fully utilized and they are not blocked by through vehicles
The software errors may be identified with careful review of the software documentation. An
alternative software can be used in place of the current erroneous software or with advanced
skills, the analyst may develop their own application programming interface to produce the
desired software performance.
After successful error checking the analyst can then proceed to the model calibration after what
is termed as a key decision point, where all input data and parameter values are checked for
correctness and the animation performing as expected based on the analyst’s judgement.
The following were the results that were yield after carrying out the recommended three stages of error checking:
Software errors
Th latest software was used for the analysis and no software errors were found after review of
the VISSIM software documentation and other material from the user groups. No known errors
or bugs were reported related to the study network and the scenarios in the analysis.
Review of Input Data and Parameters
First, basic network objects were checked for consistency with the original model used for the
base model development, as well as the current site from google earth pro. All coded geometry
and turning movements were checked and errors corrected. The major errors corrected were
misalignment of turning movement links and sharp transitions between a few links.
Static network displays were reviewed including lane numbers, lane behavior type displays and
lane drop locations. The consistency of link attributes including freeway and arterial behaviors
Traffic demand was thereafter checked to ensure the input demand volumes at each link entrance
was as defined in the field values provided in the traffic volume tables given in the original model
validation report. Traffic Signals were also reviewed carefully including the signal timing and
phases used. These were found to be correct and all signal timing files (.vissig) were correctly
referenced to the correct signal controllers. Further, all vehicle parameters were reviewed
including vehicle types, classes and inputs with some 3d model of vehicles found to be obsolete
or missing and hence the standard 3d models were adopted for these.
Review Animation
The simulation animation was first run with reduced vehicle inputs to ensure vehicles traveled
smoothly over the network and to check for any unrealistic or unexpected movements of vehicles.
Minor alignment errors were detected in this step, which were adjusted accordingly.
The traffic demands were then increased to 50% of the volume inputs as the animation was being
reviewed to check for any errors. In reviewing the animation in this stage some coding errors in
the cash toll lanes were uncovered, where vehicles were unrealistic lane changes were being made
by vehicles from the Sunpass™ only lanes (electronic tolling) to the cash only lanes at undesirable
locations and thus causing bottlenecks. This was corrected by increasing the lane change distance
for the desired route as well as the emergency stop distance for the said segments and another
animation review did not result in this error.
Key Decision Point
The revised model was finally run with actual vehicle input data and default model parameters and
the output and animations reviewed. Review results were compared to reported outputs and a