Author: Steve Essinger Revision: 1.0
Date: 9/29/08
NOVOdisplay
E-Sign Platform Overview
Table of Contents
1.0 E-Sign Platform Overview ...1
1.1 Scope ...1
1.2 Introduction ...1
2.0 Network Structures ...2
2.1 RFID Network ...2
2.2 Zigbee Network ...3
3.0 Zigbee Network Components ...8
3.1 E-Sign (End Device) ...8
3.2 Coordinator ...13
3.3 Router ...19
3.4 Gateway ...25
List of Figures
Generic Network Diagram ...2
RFID and Zigbee Network Implementations ...3
RFID Network Diagram ...3
Zigbee Network Diagram ...4
Zigbee Parent/Child Structure ...5
Zigbee Stack Block Diagram ...6
Zigbee Packet Structures ...7
E-Sign Block Diagram ...9
E-Sign Stack Structure ...10
E-Sign State Diagram ...11
E-Sign Firmware Flowchart ...12
E-Sign Software Flowchart ...13
Coordinator Wall Plug Diagram ...14
Coordinator Wall Plug Block Diagram ...15
Coordinator Block Diagram ...16
Coordinator State Diagram ...17
Coordinator Firmware Flowchart ...18
Coordinator Software Flowchart ...19
Router Wall Plug Diagram ...20
Router Wall Plug Block Diagram ...21
Router Block Diagram ...22
Router State Diagram ...23
Router Firmware Flowchart ...24
Router Software Flowchart ...25
Gateway Block Diagram ...26
Gateway State Diagram ...27
Gateway Firmware Flowchart ...28
Gateway Software Flowchart ...29
Format of Example GUI ...30
Format of Example Database ...32
Format of Example Network Map ...33
Mesh Network Map ...33
Scan Command Format to Gateway ...34
Read Command Format to Gateway ...35
Write Command Format to Gateway ...36
Update Command Format to Gateway ...37
Gateway Flowchart ...38
1.0E-Sign Platform Overview
1.1 Scope
The intent of this document is to provide an outline and description of the current state of the NOVOdisplay e-sign platform as it is available today. You will find the discussion to be heavily weighted towards the structure of the supporting network for the e-sign and all of the
components necessary to implement the network. This includes the e-sign itself. Documents may follow that discuss alternative implementations of the network and future versions of the network including improvements and additional features. Ultimately this document should serve as a primer for future discussions of the NOVOdisplay platform. Discussions specifically about electronic paper have been omitted from this document as it is felt to be separate subject matter deserving a separate document altogether.
1.2 Introduction
The NOVOdisplay e-sign platform was designed to allow for a complete solution for managing a population of electronic signage in the retail, industrial or manufacturing space. One of the main goals was to develop a platform that has minimal variation in architecture for each different product implementation. Implementations may include customized pricing signs, assembly instruction displays for the manufacturing environment or general information displays such as a dinner menu posted outside of a restaurant. While the display content of the signs may change, the e-sign components and the supporting network should remain the same. For multiple reasons the supporting network has been chosen to be a low power, low data rate wireless network. There are no cords/wires/prongs attached to the e-sign. It can be mounted on the wall, leaned up against something or passed around the room. Thus a battery is typically mounted to the back of the device to provide power and an antenna is populated for data communication.
There are currently two choices for wireless data communication, RFID or Zigbee. The
following sections detail their performance and describe the pros and cons of each. Regardless of the wireless technology chosen the platform is designed to mask its operation from the end-user to reduce apparent complexity. The network interface is a library of standard Microsoft Windows DLL files for integration into the host system by the end-user or systems integrator. This allows for a flexible development environment so that an end-user can have a fully customized solution without becoming involved with the details of the network. The software development kit provided contains a reference GUI employing a simple database to manage a population of e-signs. The GUI allows access to the network to locate and update e-e-signs. In some low-volume installations the GUI may be sufficient enough to manage the network itself.
2.0Network Structures
The NOVOdisplay platform relies on a wireless communication structure for managing the population of e-signs in a given installation. This network is not only limited to electronic signage, however. In addition, the network may support checkout systems, supply chain systems and employee support devices such as PDAs with wireless connectivity. One can think of this network as a mesh of interconnected devices that can access any other device on the network; that is with proper access permission. Figure 1 illustrates the concept.
Figure 1 – Generic Network Diagram
In the retail environment a host controller serves as the backbone for the retail back-end system. This device coordinates the flow of information from the retail store’s local database and the wireless network. The database typically contains information about each product including the product’s UPC, description, price and quantity in stock. Events occurring on the wireless network may be tracked by the host controller and reflected in the database as needed. This process works in the reverse as well. An external connection such as the internet to the back-end system enables off-site remote access to both the database and the wireless network. For
example, a chain of shoe stores can be managed from a central location containing a global database of all the products and prices. This information can be sent over the internet to each individual store’s back-end system. The local host controller may then transfer this information
to the wireless network. Once destined for the wireless network, individual pricing signs can be addressed and updated to reflect the price associated in the global database.
Wireless visibility needs to be ensured for each device on the network for the network to maintain its value. In addition to wall-to-wall wireless coverage of the retail space redundancy should be implemented. In the inevitable event that an access point goes down, devices in that region of the space should automatically be rerouted to another access point so that continuous operation can be maintained.
Metrologic has identified two wireless communication structures that potentially address the concepts described in figure 1, UHF RFID and Zigbee. Each will be described in detail in the following sections. Figure 2 below pictorially shows a typical connection scheme for both RFID and Zigbee networks supporting the NOVOdisplay E-sign.
Figure 2 – RFID (left) and Zigbee (right) network implementations
The RFID network (figure 2, left) begins with a host computer. Multiple RFID readers may be connected to this computer through interfaces such as Ethernet. Each reader generally has two antennas connected via coaxial cable, one for transmit and one for receive. The RFID network requires that each e-sign have an RFID IC containing a unique identifier mounted on its motherboard. To update the price on a display the host activates the nearby RFID reader. This reader interrogates ICs in its field of view for the corresponding unique identifier. When the reader finds the correct identifier it writes the new price to the IC’s internal memory. The motherboard takes over from here and updates the display. See section 2.1 for more detail. The Zigbee network (figure 2, right) begins with a network coordinator. The function of this device is to establish a network. From here a mesh is set up of interconnected routers engulfing the e-signs with wireless connectivity. To update the signs a host computer accesses the Zigbee network via a gateway device. The host addresses an individual e-sign by its MAC address and sends a data packet containing the information to be updated on the e-sign. Once sent to the gateway the Zigbee network takes over to send the message to the desired e-sign transparent to the user. Detailed information of this solution is provided starting in section 2.2 and continuing throughout the document.
2.1 RFID Network
Figure 3 – RFID Network Diagram
The most basic NOVOdisplay RFID E-Sign implementation begins with two antennas connected to a RFID reader via coaxial cable; the reader is connected to a PC via RJ-45 or RS-232. Each E-sign is outfitted with a RFID IC and a dipole antenna for communication with the reader. We have selected the EPC Gen2 Class3 protocol for communication. This is a UHF RFID
technology therefore operating in the US ISM 902-928 MHz band (968 MHz band in EU). It should be noted that EPC Gen2 Class3 is not a ratified protocol therefore proprietary. The company Intelleflex provides the solution including the ICs, readers, antennas, protocol and SDK. We have selected to work with Intelleflex because their Class3 solution has a read range of approximately 60m as opposed to 3m for Class1. This is possible due to the external battery employed by Class3 thereby increasing signal-to-noise ratio in the Tx/Rx circuitry of the IC. It should be noted that currently each RFID reader costs upwards of $3000.
Multiple readers may be networked via Ethernet and connected to a host PC for management of the population of e-signs. The network can be enhanced with Wi-Fi connections so that
managers and employees of the store can gain access to the host PC remotely from PDA-like devices for manipulation of the signs. Figure 3 depicts the basic network configuration.
2.2 Zigbee Network
Figure 4 below describes a basic implementation of the NOVOdisplay Zigbee platform. To establish a Zigbee network three devices are necessary: the coordinator, gateway, and end-device (E-sign). Additionally, a fourth component known as a router can be implemented to extend the range of the network. Our Zigbee network employs all four devices as shown below.
Figure 4 – Zigbee Network Diagram
The E-signs are updated via the Zigbee network with commands originating from the host PC. This PC can be connected via a LAN to a database server or remotely managed over the internet. Besides electronic signage, virtually any electronic device can be affixed with a router or an end-device to gain access to the Zigbee network. Based on the varying degree of functionality these devices can then access the host PC. Typical examples include a clerk at a cash register
requesting authorization for a return. The manager receives the request from the cash register over the Zigbee network on his/her PDA. The manager can then choose to verify the request and send the acknowledgement over the Zigbee network back to the cash register. In addition, a GPS satellite system or other location tracking engine can be implemented to track the movement and position of items on the network.
The coordinator is responsible for establishing the PAN (personal area network). This is a 16 bit value allowing for 65535 different PANs operating in the same space. There is only one
coordinator in the network and all devices joining the network must communicate on the same PAN. The coordinator also selects the channel for communication. Once the PAN has been established gateways, routers and end-devices can join the network. The gateway serves as the point for the host PC to gain access to the Zigbee network. Routers are employed to extend the range of the network. In our Zigbee network all E-signs are end devices. Figure 5 below shows the network hierarchy known as the parent/child structure.
Figure 5 – Zigbee Parent/Child Structure
The coordinator is always the most senior parent node and has the address ‘0’. All devices then become children of the coordinator. For example Router 1 is the child of the coordinator and it is the parent of two E-Signs. These two E-signs are grandchildren of the coordinator. Every device in the network is assigned a parent. Each device requests and receives data from its parent. Each device is also responsible for responding to its children.
We have implemented a mesh network topology. In this structure the coordinator, gateways and routers are networked together in such a way that if one of them goes down (other than the coordinator) then the network will automatically find another path of communication. This happens completely transparent to the user. For instance, in a typical star network, if an
employee was to accidentally knock Router 1 off-line both of its children E-signs would be disconnected from the network. In our mesh network, however, these two E-signs would automatically be assigned to Router 2 so that communication was uninterrupted. This is illustrated by the dotted line in figure 5. In order to be on the mesh network devices must be powered on constantly to monitor the network. Therefore end-devices have not been put on our mesh network since they have several sleep modes to conserve battery life.
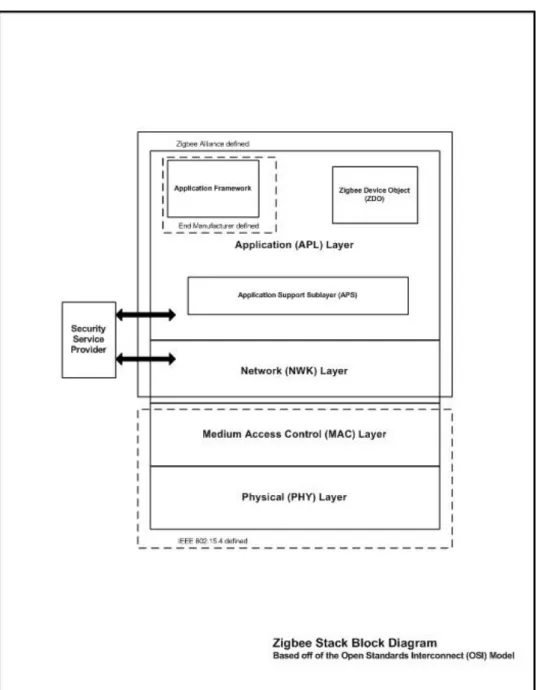
Figure 6 below shows the Zigbee stack, based off of the OSI (Open Systems Interconnect Basic Reference Model) model. Zigbee depends on the IEEE 802.15.4 standard which forms the bottom two layers of the stack. The PHY layer describes the hardware required for
communication at the IC and systems level. The MAC layer describes the addressing scheme.
The IEEE 802.15.4 standard operates in the 2.45 GHz ISM band along with Bluetooth and Wi-Fi. It is a low power (0 dBm typical), low data rate (250 kb/s) wireless mesh networking technology utilizing direct-sequence spread spectrum coding. There are sixteen channels (11 to 26) ranging from 2.405 to 2.48 GHz, each spaced 5 MHz apart. Channels 15, 20, 25 and 26 are preferred because they mitigate the susceptibility of interference from Wi-Fi networks. The transmission range is somewhere between 10 and 75m, 30m typical.
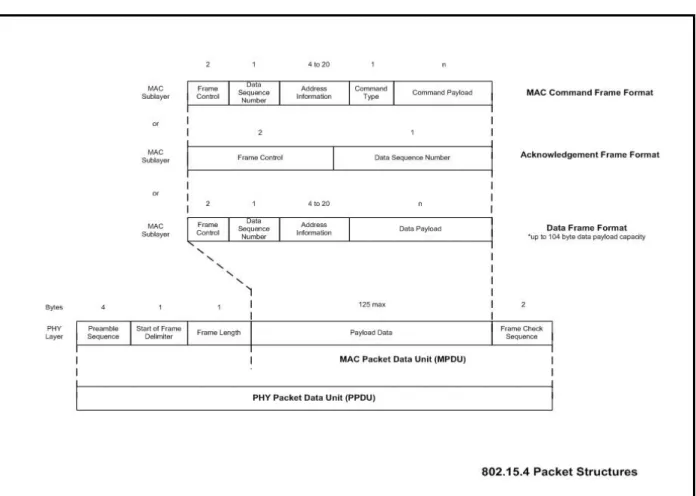
On top of the 802.15.4 PHY and MAC layers reside the NWK and APL layers as defined by the Zigbee Alliance. This alliance is a consortium of over 200 companies defining and pushing the standard. Major contributors include Freescale, Texas Instruments, Samsung and STMicro. The NWK layer contains the software necessary to implement mesh networking. The APL layer describes the devices function such as coordinator, router, etc. It is on this layer that an end user can build their own custom application. While we currently don’t implement security encryption a provision for a security layer has been implemented between the NWK and APL layers. Figure 7 below describes the packet structures used to communicate the Zigbee network devices. Each one of these is required for communication between devices on the network: MAC for addressing, data for data transmission and acknowledgment for confirmation.
3.0 Zigbee Network Components
3.1 E-Sign (End Device)
In the overall scheme of the network, the e-sign is configured as a Zigbee end device. This implies that it resides at the bottom of the parent/child network structure. The e-sign does not participate in the mesh networked portion of the Zigbee network thereby enabling the device to connect (disconnect) at will. This feature of our network structure enables the e-sign to enter into a sleep mode to conserve energy. The length and depth of sleep can readily be configured for each application via firmware.
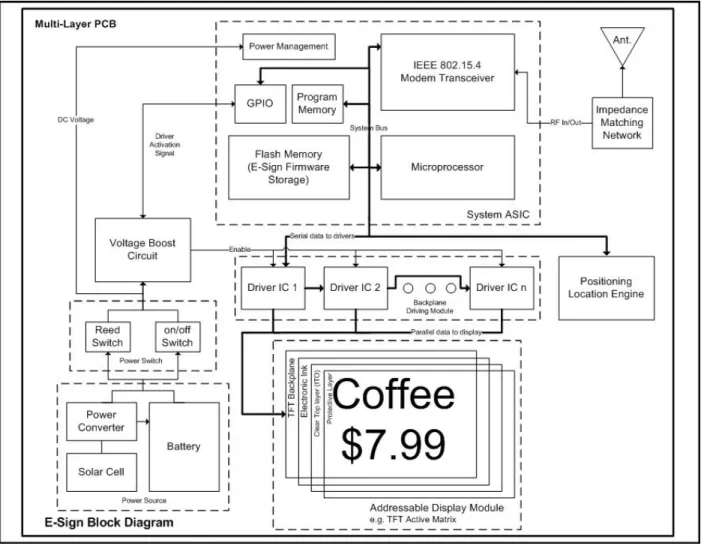
Figure 8 below is a block diagram of the e-sign outlining its components and their interconnection. The RFID e-sign follows a similar outline.
Figure 8 – E-Sign Block Diagram
We have chosen to work with Freescale’s implementation of Zigbee. The MC13213 SoC includes the 802.15.4 transceiver, an 8-bit HCS08 MCU, 60kB of flash and 4kB of RAM. Freescale provides the Zigbee stack source code which is configured by Metrologic and flashed to memory. Relatively few external components are needed for the SoC; of those a crystal, impedance matching network and antenna tuned to 2.4GHz are required.
The e-sign is currently powered by a 3V, 1200 mAh non-rechargeable, lithium battery. It is expected that future iterations of the sign will have provisions for using multiple remote power sources, e.g. solar cells. There is a mechanical on/off switch to remove the sign from the networking during storage. Additionally, a reed switch has been populated so that the sign powers off when removed from its holder.
There are four, 256 drive-line Dialog Semiconductor display driver ICs populated for updating the sign. They are enabled by the MCU on the SoC when there is new information to display. Otherwise they are in the off configuration by default. The display requires both a 0V and a +15V signal for updating the display. These drivers include an internal charge pump to scale the 3V battery supply voltage up to the required 15V. Other drive ICs may require an external charge pump and so is reflected by the voltage boost circuit block in figure 8.
There are a multitude of electronic paper display technologies available, however, for the present discussion we refer to electrophoretic technology which has been employed on our e-signs. Each display begins with a backplane layer. For an active matrix display this is a TFT matrix on glass. The homogenous sheet of electronic paper is applied over the TFT. We’ve selected E-Ink
Viziplex for our display. The electronic paper is coated with Indium-Tin-Oxide (ITO) which is a clear conductive layer very popular in LCD technology. Finally, a protective layer of plastic is added over the ITO to complete the display.
Figure 9 below shows the stack-up of each layer of the e-sign as described above. All of the electronic components are populated on one side of the motherboard, multi-layer PCB. The display is attached to the other side of the PCB, typically by connector or heat-seal-bonding.
Figure 9 – E-Sign Stack Structure
When the e-sign is powered on it immediately searches for a network to join. If there is a coordinator present that has established a PAN the e-sign will request pertinent network
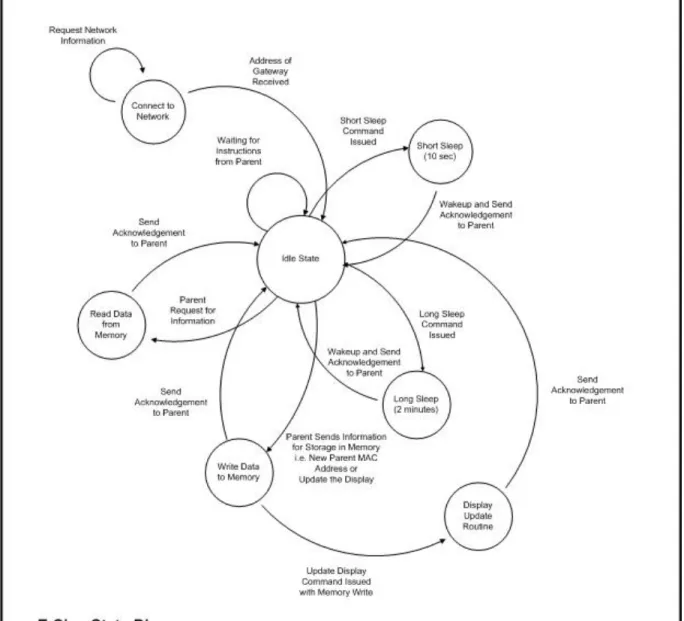
information including the MAC address of the e-sign’s parent and the MAC address of the host gateway. Once the e-sign has received this information it enters an idle state. In this state there are several modes to move to another state. This is described pictorially in figure 10 below.
Figure 10 – E-Sign State Diagram
Generally, the e-sign is in an idle state awaiting instruction from its parent. The parent can issue a command to put the e-sign in short sleep or long sleep mode. In these modes the e-sign shuts down and cannot respond until it wakes up. The length of sleep can be changed in firmware. Upon waking up the e-sign sends an acknowledgement to its parent as a request for information. Data sent to the sign while it was sleeping can now be retrieved by the sign from the parent node. When a command has been issued by the parent to update the display the e-sign writes the data to memory and then begins the display update routine. This routine includes parsing the data from memory, enabling the display driver ICs and writing data serially to the drivers.
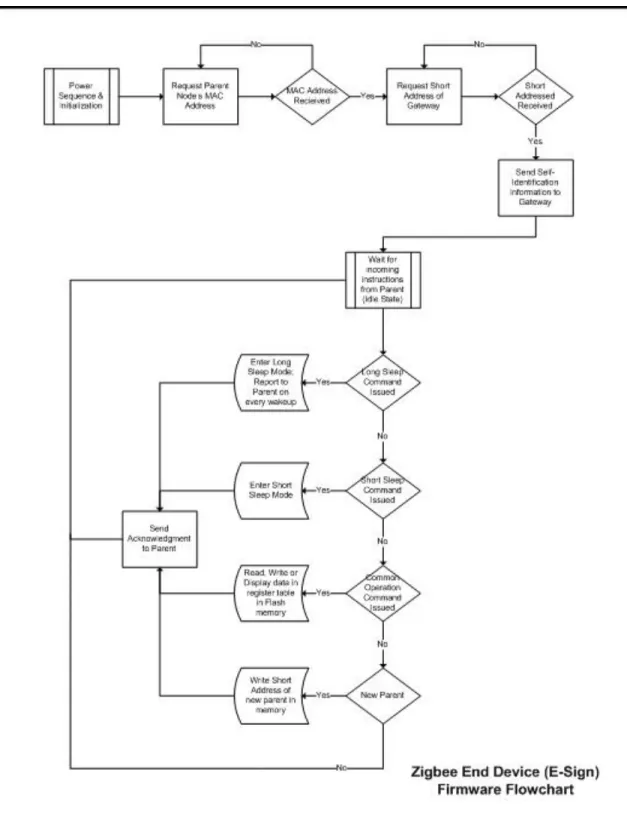
Figure 11 below is an alternative illustration of the e-sign state diagram. The firmware flowchart displays the logical sequence of events that the code has been designed to handle.
Figure 11 – E-Sign Firmware Flowchart
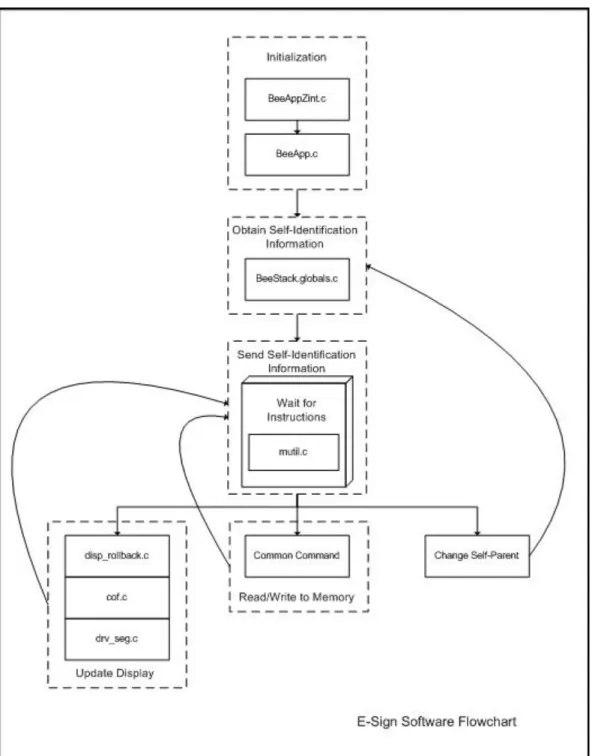
The set of firmware for the e-sign resides in seven C files as shown below in figure 12. The initialization files are provided by Freescale for configuring the Zigbee network. Once these programs have executed a third Freescale program executes that enables the e-sign to identify itself and obtain its parent’s MAC address. The sign is now in the idle state and our mutil.c program is initialized. From this main program the sign can execute other functions and code
depending on the input from its parent node. The bulk of the flash memory is utilized from storing the Freescale code. This approximate 50kB doesn’t leave much room for our own
development so we’re continuing to search for ways to reduce the size of the Freescale stack and improve the efficiency of our code.
3.2 Coordinator
Every Zigbee network must have a coordinator device. The coordinator is responsible for establishing the PAN which involves selecting a frequency of operation (channels 11 thru 26) and assigning a PAN ID number. All devices that join this network must communicate on this channel and acknowledge this PAN ID.
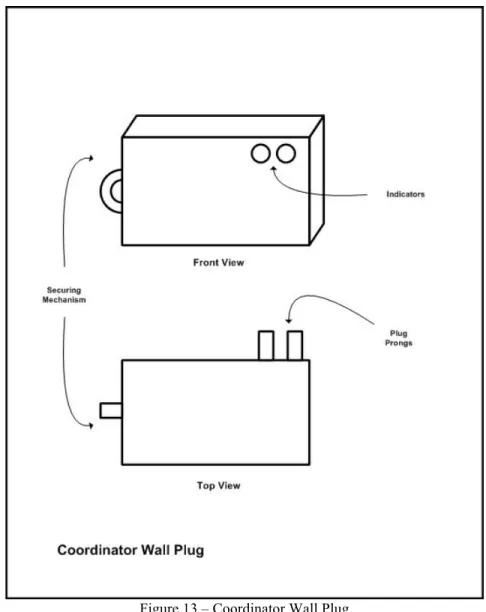
Figure 13 – Coordinator Wall Plug
Our coordinator has been integrated into a plastic enclosure as shown by figure 13. Since the coordinator must be available to maintain the network we have chosen to derive power from the wall. Future versions of our coordinator will include a battery backup source to maintain power in the event of short-term power outages and surges.
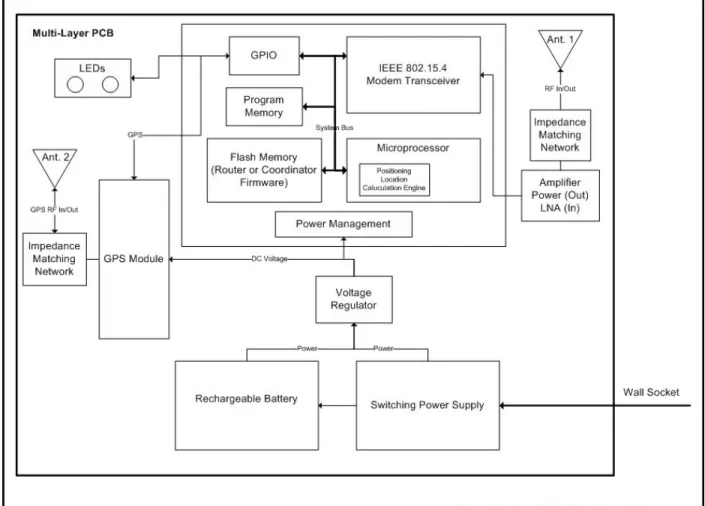
Figure 14 – Coordinator Wall-Plug Block Diagram
The block diagram of the coordinator wall-plug is an augmented version of what we currently have available today. In addition to the coordinator hardware and firmware we’ve incorporated a few additional features. A rechargeable battery has been added to supply continuous power to the device in the event of a short-term power failure. A variable gain power amplifier has been added to the transmit line to boost signal strength to increase range in noisy environments.
Furthermore we’ve introduced a low noise amplifier (LNA) to the receiver to increase the gain of incoming signals. We intend to have the gain of these amplifiers software controlled so that we may dynamically change the signal strength depending on the characteristics of the ambient environment.
We envision large scale deployments of our system; therefore location of a specific node becomes a critical issue. To aid in node location we intend to incorporate a real-time location system (RTLS). This may include a GPS module, position location algorithm scheme that works off of RSSI or some other similar technology.
Figure 15 – Coordinator Block Diagram
Figure 15 depicts are coordinator as it exists today with the exception of the power amplifiers. These amplifier circuits are currently under development. The microprocessor, Zigbee Tx/Rx, program memory and flash memory all reside on a monolithic system ASIC provided by Freescale. The F-antenna is built right into the PCB and has been referenced from a previous Freescale design to expedite the design process. In the future we may look for a chip antenna to decrease the required footprint at the expense of increased BOM cost.
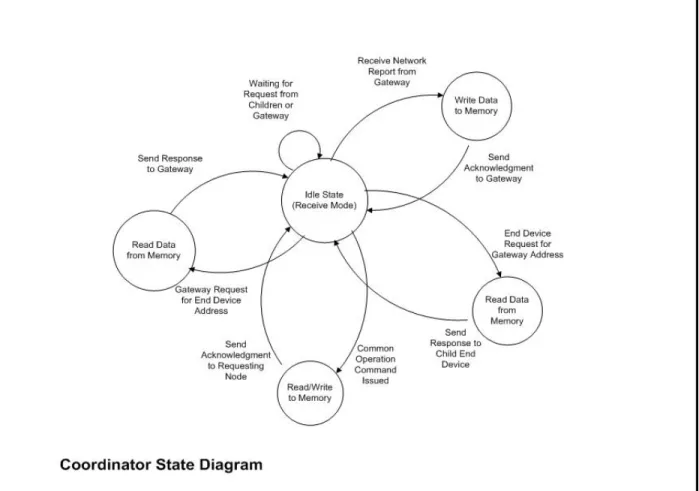
Figure 16 – Coordinator State Diagram
As it stands today all of the configuration setting for the coordinator have been hard coded into the source code. This source coded is flashed to the coordinator prior to installation. Once the coordinator is power it immediately establishes the network and enters an idle state. The various states of operation are initiated by different events as described by figure 16. Once the state is complete the coordinator always returns to the idle state waiting for the next event to occur. Figure 17 below is an alternative description by means of a flowchart of the state diagram shown in figure 16.
Figure 17 – Coordinator Firmware Flowchart
The set of firmware for the coordinator resides in five C files as shown below in figure 18. The initialization files are provided by Freescale for configuring the Zigbee network. Once these programs have executed a third Freescale program executes that enables the coordinator to identify itself and establish the network. The coordinator the moves to the idle state and our mutil.c program is initialized.
Figure 18 – Coordinator Software Flowchart
The bulk of the flash memory is utilized from storing the Freescale code. This approximate 50kB doesn’t leave much room for our own development so we’re continuing to search for ways to reduce the size of the Freescale stack and improve the efficiency of our code.
3.3 Router
The router utilizes the same plastic housing as the coordinator. In fact the router shares the same hardware as well. The only difference between a router and coordinator in our system is the firmware.
Figure 19 – Router Wall Plug
Future versions of our router may also include firmware for a coordinator. The intent is that a router may dynamically switch to a coordinator in the event that the coordinator is permanently disabled. Rather than have to wait for a user to find the coordinator and replace it one of the routers can configure itself to do the job on the fly.
Figure 20 – Router Wall-Plug Block Diagram
The block diagram of the router wall-plug is an augmented version of what we currently have available today. In addition to the router hardware and firmware we’ve incorporated a few additional features. A rechargeable battery has been added to supply continuous power to the device in the event of a short-term power failure. A variable gain power amplifier has been added to the transmit line to boost signal strength to increase range in noisy environments.
Furthermore we’ve introduced a low noise amplifier (LNA) to the receiver to increase the gain of incoming signals. We intend to have the gain of these amplifiers software controlled so that we may dynamically change the signal strength depending on the characteristics of the ambient environment.
We envision large scale deployments of our system; therefore location of a specific node becomes a critical issue. To aid in node location we intend to incorporate a real-time location system (RTLS). This may include a GPS module, position location algorithm scheme that works off of RSSI or some other similar technology.
Figure 21 – Router Block Diagram
Figure 21 depicts our router as it exists today with the exception of the power amplifiers. These amplifier circuits are currently under development. The microprocessor, Zigbee Tx/Rx, program memory and flash memory all reside on a monolithic system ASIC provided by Freescale. The F-antenna is built right into the PCB and has been referenced from a previous Freescale design to expedite the design process. In the future we may look for a chip antenna to decrease the
Figure 22 – Router State Diagram
Upon power up the router begins to search for available networks. If a coordinator in vicinity has established a network the router will join. A gateway in the system (to be described in the next section) will send its address to the router. The router will use this address to communicate with the host system when necessary.
The router now enters and idle state. From here different states can be activated depending on input from either the routers parent device or the router’s children. Figure 22 shows the various states for the router in our current network.
Each router may have up to 20 children in the current network configuration. This means that each router can support 14 end-devices (e-signs) and 6 additional routers. Each router child is considered to be one layer below the parent router. There is no limit to the number of layers in the system although there are tradeoffs to having too many layers. One of these tradeoffs is latency from the host system to the targeted end-device.
Figure 23 below is an alternative description by means of a flowchart of the state diagram shown in figure 22.
Figure 23 – Router Firmware Flowchart
The set of firmware for the router resides in five C files as shown below in figure 24. The initialization files are provided by Freescale for configuring the Zigbee network. Once these programs have executed a third Freescale program executes that enables the router to identify
itself and connect to the network. The router the moves to the idle state and our mutil.c program is initialized. From here the router can support both its children and parent devices.
Figure 24 – Router Software Flowchart
The bulk of the flash memory is utilized from storing the Freescale code. This approximate 50kB doesn’t leave much room for our own development so we’re continuing to search for ways to reduce the size of the Freescale stack and improve the efficiency of our code.
3.4 Gateway
The gateway in our system is the link between the host computer and Zigbee network. The gateway communicates to the coordinator to gain access to the various children in the network. Again, we’ve utilized the same hardware design for the gateway as we did for the both router and the coordinator. However, the gateway derives its power from the USB port on the host
computer. The gateway may connect/disconnect from the network at will without disruption to the network. When the gateway is down, however, the host system is incapable of manipulating the network or extracting data from it.
Figure 25 – Gateway Block Diagram
Figure 25 illustrates the block diagram of the gateway. The only difference between this
hardware design and the coordinator/router’s is that we’ve implemented a SiLabs USB-to-UART chip for communication between the host system and the Freescale Zigbee ASIC.
Figure 26 – Gateway State Diagram
Upon power up the gateway begins to search for a network. The gateway may join the network through a parent device. The parent can be either a router or the coordinator. Once the address of the parent has been received the gateway enters an idle state. The gateway may move to another state of operation by command by way of either UART or the wireless interface. Figure 26 above depicts the different states currently invoked in the gateway and how the gateway moves from one state to the next. After any sequence of states the gateway always returns back to the idle state and waits for the next input command.
Figure 27 below is an alternative description by means of a flowchart of the state diagram shown in figure 26.
Figure 27 – Gateway Firmware Flowchart
The set of firmware for the gateway resides in five C files as shown below in figure 28. The initialization files are provided by Freescale for configuring the Zigbee network. Once these programs have executed a third Freescale program executes that enables the gateway to identify itself and connect to the network. The gateway then moves to the idle state and our mutil.c
program is initialized. From here the gateway can support communication between both the UART and the wireless interface (Zigbee).
Figure 28 – Gateway Software Flowchart
The bulk of the flash memory is utilized from storing the Freescale code. This approximate 50kB doesn’t leave much room for our own development so we’re continuing to search for ways to reduce the size of the Freescale stack and improve the efficiency of our code.
4.0Graphical User Interface and Host System Function
We have developed a GUI that allows one easy access to the Zigbee network. Similar GUIs may be developed for custom applications using a library of API’s that we have packaged into a SDK. Furthermore, one may develop a piece of middleware that directly connects the Zigbee network to a back-end database system. The following section describes the functionality of our demo GUI as well as the flowcharts for communication between the host system and the gateway.
Figure 29 – Example GUI
The GUI is a shell wrapped around a set of API’s that provide access to the Zigbee network via the gateway. Communication between the host and the gateway is established by opening the corresponding COM port. A user may select any multiplicity of signs and write a value to the display by pressing the send button. Once the button has been activated the host calls the appropriate library functions to access the gateway. The gateway is instructed which signs to address along with the corresponding value to be written to the display. Each sign addressed returns an acknowledgment of receipt of the message. This status is confirmed on the GUI at completion of the sign update or after a timeout period. Future versions of the GUI will poll each sign for its current display value. The current display value will be written to memory on the host system and displayed on the GUI. At present, the current display value is obtained only from the host system memory. The sign doesn’t reply with its current display value.
Our GUI has a database feature which describes how one may use a database to manage a population of e-signs on the Zigbee network. Figure 30 below provides an illustrative example.
Figure 30 – GUI Example Database
The fields shown in figure 30 are typical fields one may wish to incorporate into their database. Information that is entered into the database is forwarded to the Zigbee network once it has been saved. For example, changing the value from $8.99 to $5.96 on the T-Shirts row will change the display value on the e-sign associated with T-shirts to $5.96. The device type and MAC address for each node of the network is read by the GUI and displayed on the database. A user may enter a description for each device on the network that is intuitive. Rather than looking for an e-sign with a MAC address of 33321BD7C465 one would just need to look for T-Shirts.
Another example GUI that we’ve developed displays the Zigbee network as a map. Each device is mapped onto a tree displaying the interconnection between devices on the network. Figure 31 below shows what a map may look like with four end-devices and two routers on the network. The Refresh Map button updates the map to reflect the current state of the network. Devices that have left or joined the network will be shown automatically in the map. Furthermore, they will automatically be placed in the correct position on the tree. We’ve made this process transparent to the user for ease of use.
Figure 31 – GUI Network Map
Moving the mouse pointer over each circle on the map opens a popup dialog box displaying network information specific to each node. In the example of figure 31 end-device two has been selected. The information provides quick feedback to the user about the particular state of the node. In future versions of the GUI a user will be able to manipulate information provided in the popup box and have that information reflected in the network. For example, the user could change the description or currently display value for device #5 (Coffee). Other implementations could incorporate authentication password access for secure installations.
Just as figure 1 depicted a simple generic network configuration; figure 32 below depicts a simple configuration specific to a Zigbee network. This figure may be referred to for the
following flowcharts describing the process of communication between the host system and the gateway module.
Host PC (USB Port)
Gateway C R ED Command Response
Figure 1, Zigbee Mesh Network Map
ED
Wireless
Zigbee Mesh Network
G --- Gateway C --- Coordinator R --- Router ED --- End Device
USB Cable
The following four flowcharts describe four of the APIs used in our Zigbee system. Each flowchart describes the process of how each API functions. For the specific syntax of an API please refer to the NOVOdisplay SDK.
Figure 2, “Scan’’ Command to Gateway
Send ‘Scan’ Command to GatewayReturn ‘Scan’ Result --- Success, Update Node Info Database Yes
Return ‘Scan’ Result ---Failure
Waiting ‘Scan’ Response, Time Out?
No
Waiting Node Info for 10 seconds
Figure 33 – “Scan” Command Format to Gateway
The scan command is generally issued once the GUI has been opened to scan the network for available nodes. It may also be issued at a later time to refresh the GUI; however, this is generally not needed since a node joining the network once the GUI has been opened is automatically detected. This newly detected node is added to the main page of the GUI, the database and the network map.
Figure 3, “Read’’ Command to Gateway
Send ‘Read’ Command to GatewayReturn ‘Read’ Result --- Success No
Yes
Return ‘Read’ Result --- Failure Waiting ‘Read’ Response,
Time Out?
Yes
Waiting ‘Read’ Data, Time Out?
No
Figure 34 – “Read” Command Format to Gateway
Figure 34 shows the flowchart for the ‘Read’ API. This function is instantiated anytime a user at the host system needs to retrieve something from memory stored on a device on the network.
Figure 4, “Write’’ Command to Gateway
Send ‘Write’ Command to Gateway
Return ‘Write’ Result --- Success No
Yes
Return ‘Write’ Result --- Failure Waiting ‘Write’ Response,
Time Out?
Yes
Waiting ‘Write’ Result, Time Out?
No
Figure 35 – “Write” Command Format to Gateway
Figure 35 shows the flowchart for the ‘Write’ API. In general, this function is used anytime information needs to be written from the host system to a particular device on the network.
Figure 5, “Update’’ Command to Gateway
Send ‘Update’ Command to Gateway
Return ‘Update’ Result --- Success No
Yes
Return ‘Update’ Result --- Failure Waiting ‘Update’ Response,
Time Out?
Yes
Waiting ‘Update’ Result, Time Out?
No
Figure 36 – “Update” Command Format to Gateway
Figure 36 shows the flowchart for the ‘Update’ API. This command is used whenever an e-sign display needs to be updated on the network. This algorithm utilizes a timeout function to monitor the success of the e-sign update. If the e-sign returns an acknowledgment that the message was received within the timeout period then the GUI displays the action was a success.
Main Thread
‘Update’
Yes
‘Scan’ ? No ‘Read’ ? No ‘Write’ ? No No
Broadcast ‘Scan’ ‘Scan’ Response to Host PC Send ‘Update’ to Destination Node ‘Update’ Response to Host PC Write Data to Destination Node ‘Write’ Response to Host PC Send ‘Read’ to Destination Node ‘Read’ Response to Host PC ‘Update’ Success? Yes
‘Node Info’ ? ‘Read’ data ? ‘Write’ Success?
No No No No
Transfer Node Info into Host PC
‘Update’ Response to Host PC ‘Write’ Response to
Host PC Transfer ‘Read’ Data
into Host PC
Figure 6, Gateway Flow Chart
Initialize All Resource and Join in Zigbee Network
Start Main Thread to Monitor and Process data between Host PC and Zigbee Mesh Network
(Wireless) Receive data in Zigbee Mesh
Network?
(UART) Commands from Host PC?
Yes Yes Yes Yes
No
Figure 37 – Gateway Flowchart
Figure 37 above describes how the gateway works between the host system and the Zigbee network. The software has been designed around this flowchart and is provided in the NOVOdisplay SDK.
Run GUI Application
Send ‘Scan’ Command to Gateway and Wait 10 seconds
Check Scanning Result, Node Number > 0?
Add all end devices into Device List
No
Figure 7, GUI Flow Chart
Select End Devices that you want to Update
Send ‘Write’ Command with Input Data into Destination Node
Send ‘Update’ Command to Destination Success? Success? Try again > 3 No Yes Try again > 3 No No No
Left End Devices > 0
Yes
Yes Yes
Display Update Result Try again
Yes
End
Show Zigbee Mesh Network Map
No
Input Data and Click ‘Update’ or Enter
Figure 38 – GUI Flowchart
Figure 38 above describes the process of running the GUI application. It incorporates the four APIs as described above and works in conjunction with the Gateway flowchart as described in figure 37. All of this can be viewed in the GUI software syntax provided in the SDK.