UC San Francisco Previously Published Works
Title
Disruption to control network function correlates with altered dynamic connectivity in the
wider autism spectrum.
Permalink
https://escholarship.org/uc/item/1rt878dm
Authors
de Lacy, N
Doherty, D
King, BH
et al.
Publication Date
2017
DOI
10.1016/j.nicl.2017.05.024
Peer reviewed
eScholarship.org
Powered by the California Digital Library
Contents lists available atScienceDirect
NeuroImage: Clinical
journal homepage:www.elsevier.com/locate/ynicl
Disruption to control network function correlates with altered dynamic
connectivity in the wider autism spectrum
N. de Lacy
a,b, D. Doherty
b,c, B.H. King
d, S. Rachakonda
e, V.D. Calhoun
e,f,⁎ aDepartment of Psychiatry and Behavioral Sciences, University of Washington, Seattle, WA 98195, USAbSeattle Children's Research Institute, Center for Integrative Brain Research, Seattle, WA 98105, USA
cDepartment of Pediatrics, Divisions of Developmental and Genetic Medicine, University of Washington, Seattle, WA 98195, USA dDepartment of Psychiatry, University of California San Francisco, San Francisco, CA 94143, USA
eThe Mind Research Network & LBERI, Albuquerque, NM 87106, USA
fDepartment of Electrical and Computer Engineering, University of New Mexico, Albuquerque, NM 87131, USA
A R T I C L E I N F O
Keywords: Autism Functional MRI Dynamic connectivity Control networks Task-positive Default-modeA B S T R A C T
Autism is a common developmental condition with a wide, variable range of co-occurring neuropsychiatric symptoms. Contrasting with most extant studies, we explored whole-brain functional organization at multiple levels simultaneously in a large subject group reflecting autism's clinical diversity, and present thefirst network-based analysis of transient brain states, ordynamic connectivity, in autism. Disruption to network and inter-system connectivity, rather than within individual networks, predominated. We identified coupling disruption in the anterior-posterior default mode axis, and among specific control networks specialized for task start cues and the maintenance of domain-independent task positive status, specifically between the right fronto-parietal and cingulo-opercular networks and default mode network subsystems. These appear to propagate downstream in autism, with significantly dampened subject oscillations between brain states, and dynamic connectivity
con-figuration differences. Our account proposes specific motifs that may provide candidates for neuroimaging biomarkers within heterogeneous clinical populations in this diverse condition.
1. Introduction
Autism spectrum disorder (ASD) is a lifelong neuropsychiatric condition affecting > 1% of the population with a lifetime cost of care of $1.4–2.4 million (Buescher et al., 2014). Diagnostic criteria specify social communication deficits and restricted/repetitive behavior pat-terns. However, symptoms extend to most neurocognitive systems (Silver and Rapin, 2012) including prominent visual, language and sensorimotor differences. Co-morbidfindings in individuals with autism include intellectual disability (40–50%), seizures (8–30%), neuromotor abnormalities (≤79%), sleep disruption (50–80%), and gastrointestinal symptoms (9–70%) (Silver and Rapin, 2012; Lai et al., 2014). Psy-chiatric comorbidities are strikingly common, most frequently anxiety and attention deficit hyperactivity disorder (ADHD), each present in ~ 50% (Lai et al., 2014).
ASD may be considered a developmental disorder of distributed neural systems, evidenced by alterations in microscale (Zoghbi and Bear, 2012), mesoscale (Hutsler and Casanova, 2015) and macroscale (Duerden et al., 2012) neural architecture. Current estimates of herit-ability are 80%, albeit with substantial genetic heterogeneity
(Geschwind and State, 2015) and environmental contributions (Herbert, 2010). While multiple neural elements appear implicated, no consistent or unifying structural or functional motif has been identified and validated. Consequently, ASD remains a taxonomic umbrella term rather than a disease (Silver and Rapin, 2012). Identifying a convergent mechanism capable of reconciling the characteristic infantile onset and core behavioral phenotype with observable neurocognitive diversity and biomolecular heterogeneity remains a fundamental unsolved pro-blem.
ASD research has benefitted from the increasing conceptualization of behavior and cognition as being emergent properties of brain net-works. In this model, a network consists of multiple regions or nodes (that may be spatially distant from each other) exhibiting stable, or-ganized patterns of persistent co-activation or coherence when brain function is measured. This patterned co-activation between nodes within a network has been termedfunctional connectivity, and multiple techniques may be used to search for and define networks, including independent component analysis (ICA), seed-based, graph and clus-tering techniques. There appear to be multiple, stable networks in the human brain present across individuals that have been associated with
http://dx.doi.org/10.1016/j.nicl.2017.05.024
Received 6 January 2017; Received in revised form 9 May 2017; Accepted 25 May 2017
⁎Corresponding author at: The Mind Research Network & LBERI, Albuquerque, NM 87106, USA.
E-mail address:[email protected](V.D. Calhoun).
Available online 27 May 2017
2213-1582/ © 2017 The Authors. Published by Elsevier Inc. This is an open access article under the CC BY-NC-ND license (http://creativecommons.org/licenses/BY-NC-ND/4.0/).
MARK
specific behavioral or cognitive functions such as vision (Laird et al., 2011). Interestingly, networks appear to be replicable across condi-tions, and many have been identified during task performance that correspond to those seen in the wakeful resting state (Smith et al., 2009), anesthesia and sleep (Zhang and Raichle, 2010), suggesting resting state neurocognitive templates are activated during tasks (Spreng et al., 2013). Taken together, these observations also suggest these large-scale networks may be inherent in human brain function, giving rise to the appellation ‘intrinsic network’(IN) (Seeley et al., 2007). Spatio-temporally patterned, correlated activity also exists be-tween networks, that may be termed functional network connectivity (FNC,Fig.1a). Here, individual networks may be initially defined using a variety of techniques such as ICA or seed-based methods, before de-fining connectivity characteristics between two or more networks. Commonly, FNC is analyzed by examining successive pairs of networks to eventually compute all the possible relationships among a set ofN networks, or [(NxN)-N]/2. Identification of the total set of brain net-works and the character of connections within and between them may therefore provide a map of the human functional‘connectome’, akin to a whole-brain wiring diagram.
When observed using functional MRI (fMRI) in the resting state, co-activation patterns characterizing functional connectivity and FNC are often averaged across the timecourse of scans, producing measures of steady-state connectivity. Analytic approaches capable of character-izing the time-varying properties of network configurations in fMRI, or dynamic connectivity, have recently garnered substantial interest (Calhoun et al., 2014). When their temporal organization is thereby additionally delineated, functional connectivity and FNC together form what we have called the human ‘chronnectome’: a multi-level archi-tecture housed in the same physical substrate but simultaneously al-lowing functional specialization and the dynamic integration required for complex cognition. Much work remains to be done to provide a detailed description of the role that different individual networks play in dynamic connectivity, and how this could relate to a model where distinct brain‘states’may specify shifts in neurocognitive function and behavior such as the redirection of attention. However, while networks are known to specialize, two broad types exist. Domain networks per-form specific data processing functions for tasks such as vision, while control networks effect top-down/executive management of process initiation, maintenance and transition via FNC configuration shifts. The functional characterization of control networks and their inter-relationships is therefore of interest in considering dynamic con-nectivity. Patterns of resting state inter-network FNC can differentiate affected from unaffected individuals in disorders of complex cognition such as depression (Manoliu et al., 2013), obsessive-compulsive dis-order (Anticevic et al., 2014), schizophrenia and bipolar disorder (Du et al., 2015). Similarly, ASD is increasingly considered a connectivity disorder (Zhang and Raichle, 2010). However, the specific connectivity deficits have greatly varied given methodological and subject selection differences. Early studies often focused on region-specific differences in activation during tasks, with more recent inquiry using resting state fMRI concentrated in seed-based techniques (Hull et al., 2016) and low-order models. Many studies have focused on smaller groups of more homogenous subjects (often males with higher cognitive function) without psychiatric co-morbidities. However, it is not clear if these more narrowly-defined groups may represent sub-populations within ASD, and the use of restricted numbers of networks may obscure un-derlying connectivity patterns. In contrast, we opted to perform an exploratory, hypothesis-free study in a large group of subjects of varied ages using resting state fMRI. We embraced–but controlled for - the neurocognitive and psychiatric diversity found in clinical populations with ASD. Using a high-order model to achievefine spatial and tem-poral scale, we applied ten advanced outcome measures to this large dataset to maximize power. We were particularly interested in juxta-posing measures at different hierarchical levels of functional brain or-ganization that characterize connectivity within networks, between
networks and at the aggregated network system level and comparing connectivity motifs across steady-state and dynamic FNC.
2. Materials and methods 2.1. Methods summary
After pre-processing with standard techniques in the DPARSF pi-peline, resting-state scans from 884 subjects were pre-whitened and a two-step principal components (PC) analysis was performed to reduce to 75 PCs. A high-order 75 component group ICA (gICA) using the Infomax algorithm was run 10 times with random initialization using ICASSO, and subject specific spatial maps estimated using back re-construction with the GICA algorithm. Measures of intra-network, inter-network and inter-system connectivity in the averaged (steady-state) fMRI timecourses were tested for group effects in autism vs controls, controlling for IQ, age, sex, site, eye status, medication use, co-morbid diagnosis and head motion. In voxelwise outcome measures, predictors were submitted to a MANCOVA with an F-test at each iteration to produce afinal reduced model for each outcome measure and network, before univariate testing of significant predictors was performed on the original model. For the dynamic analysis, successive correlation ma-trices for all networks were generated using a sliding window technique and brain states formed using k-means clustering on the windowed correlation matrices. Dynamic outcome measures including examina-tion of variance in the temporal patterns of subject transiexamina-tion among states were tested in autism vs controls after controlling for site and head motion. A sensitivity analysis was performed using 9 permutations of cluster number and window size. Directional test-retest analysis was performed. A detailed account of Methods follows.
2.2. Data selection and preprocessing
The base data for this study is the collection of MRI scans assembled by the Autism Brain Imaging Data Exchange (ABIDE) consortium from 16 different study sites (Di Martino et al., 2014). Resting state and MPRAGE structural data for 1112 subjects (539 with ASD and 573 neurotypical controls) are made available. This data is deidentified in compliance with U.S. Health Insurance Portability and Accountability Act (HIPAA) guidelines and in the public domain. The research was approved by local human subjects committees at all sites and partici-pants signed written informed consents and assents. The present study was given exempt status by the University of Washington Human Subjects Committee. We included in this study only scans that were rated as‘good’by two or more of three raters in the ABIDE QI process (seehttp://preprocessed-connectomes-project.github.io/abide/quality_ assessment.html). We then discarded scans with < 110 timepoints in the resting state scan since we wanted to preserve our ability to com-pute a high order model, and further eliminated 59 subjects for whom IQ data was not available. In total, 884 subjects ages 6.5 to 58 were included, 423 with ASD and 461 controls. Certain subjects were taking psychoactive medications at the time of the scan. Supplementary Table 4 shows characteristics of the subjects in this study.
We utilized resting state scans with minimal processing using the Data Processing Assistant for Resting State fMRI (DPARSF) without band-pass signaling and without global signal regression. Thefirst four volumes were dropped from each scan to remove T1 equilibration ef-fects. Scans then underwent slice time correction in order to correct for different signal acquisition times, shifting the signal measured in each slice relative to the acquisition of the slice, using the middle slice as the reference frame. Subsequently, realignment was performed using a six-parameter (rigid body) linear transformation with a two-pass proce-dure,first registering to thefirst image and then to the mean of the images. Structural images (T1-weighted MPRAGE) were segmented into gray and white matter (GM and WM) and cerebrospinalfluid (CSF), co-registered to the mean functional image and then transformed from
individual native to Montreal Neurologic Institute 152 space using the Diffeomorphic Anatomical Registration Through Exponentiated Lie al-gebra (DARTEL) tool. Minimal, standard regressions were performed on the resulting data to ensure the signal used in the analysis represented coactivation responses from GM. Specifically, head motion effects were regressed out using the Friston 24-parameter model and signal from WM and CSF regressed out to remove respiratory and cardiac effects. Finally, linear and quadratic trends were included to account for low frequency drift in the blood oxygen level dependent signal. Seehttp:// preprocessed-connectomes-project.github.io/abide/Pipelines.html and http://preprocessed-connectomes-project.github.io/abide/dparsf.html for additional details. We performed temporal filtering later in our processing pipeline.
2.3. Analytic pipeline
The approaches we adopted in our general analytic pipeline to ex-tract and identify INs and perform static and dynamic connectivity analysis have been developed in our group at the Mind Research Network and validated in large groups of control subjects. Further de-tails of the computational underpinnings may be examined in recent published studies (Allen et al., 2011; Allen et al., 2014). Accordingly, in this section we set forth specific methodologic choices we made in the current analysis to optimize our approach and results given the high dimensionality of the data, large number of subjects and computa-tionally resource-intensive nature of these techniques. Additional out-come measures were developed specific to the present study (Intra- and inter-system correlations, state change number and fraction of time spent in state) and these are described in detail. Software tools used in this analysis are made freely available at: http://mialab.mrn.org/ software.
2.4. Group independent component analysis
We identified large scale brain networks in the subject sample using a spatial ICA algorithm instantiated in the Group ICA of fMRI Toolbox (GIFT) developed in our group and widely used in ICA analysis of fMRI (Calhoun and Adali, 2012). In this approach, spatial maps representing temporally coherent individual networks are extracted or deconvolved from the linearly mixed whole brain resting state signal by estimating maximally independent spatial sources. The group ICA model assumes that the set of independent source locations have weights specifying the contribution of each source to each voxel, with these weights multiplied by each source's timecourse. The total number of sources are then added together, with each voxel containing a mixture of the sources, each of which fluctuates according to its weighted timecourse with every component making some contribution at each voxel. This may be appreciated in Supplementary Fig. 1 by noting that spatial overlap between networks is present even on visual inspection (for example INs 12/13, 18/19, 20/21, 2/8/9 or 24/26). In addition, we computed the normalized mutual information between each pair of components (Supplementary Fig. 2) to demonstrate the shared information between every component pair in the decomposition.
Each independent component (IC) therefore represents a network extracteden blocfrom the pooled sample of 884 individuals to max-imize component refinement and specificity (Smith et al., 2009; Allen et al., 2011). This is a hypothesis-free, data-driven approach to identi-fying brain networks that computes relationships between all voxels in the resting state data rather than estimating pairwise correlations, and may provide increased sensitivity to detect subtle intra-subject diff er-ences (Calhoun and Adali, 2012).
We performed a group independent component analysis (gICA) using a relatively high order model of 75 components (Zhang and Raichle, 2010; Allen et al., 2011). Before the gICA, we submitted the data to reduction and pre-whitening (the latter to remove effects at-tributable to serial autocorrelation) in a principal components (PC)
analysis. First, we performed a subject-specific data reduction PC ana-lysis using a standard economy-size decomposition retaining 90 PCs with the objective of stabilizing back reconstruction and retaining maximum variance at the individual level. We next performed group data reduction retaining 75 PCs in order to reduce dimensionality in the data to the number of components used in the ICA. For the second, group data reduction step, we used the expectation-maximization al-gorithm included in GIFT to maximize performance, removed the mean image per timepoint to improve conditioning of the covariance matrix, and masked data with an ABIDE-specific template derived from a single ABIDE MPRAGE scan selected at random. The data was fully stacked to compute the covariance matrix with double point precision. Then we performed the gICA analysis by repeating the Infomax ICA algorithm 10 times in ICASSO (Himberg et al., 2004). In the latter approach the ICA algorithm is run multiple times starting with different, randomly se-lected initial values to obtain clusters that are the most representative and therefore most reliable estimate for each component. There is currently no idealistic way to specify the number of ICs in an ICA de-composition, but rather choices available to the researcher based on study design preferences and the dimensionality of the data. Automated approaches typically converge on a lower number of components (Li et al., 2007) but over the past few years many studies have manually opted for a higher model order. We selected an intermediate-high (75) number of independent components because we wished to isolate in-dependent right and left fronto-parietal control networks. In this we followed Smith et al. (Smith et al., 2009) and Allen et al. (Allen et al., 2011) who demonstrated using ICA that a high model order is necessary to extract these specific networks. In terms of the number of PCs, we have previously demonstrated (Erhardt et al., 2011) that the perfor-mance of the ICA decomposition is insensitive to variations in this parameter, as long as the number of PCs is greater than the number of ICs.
Aggregate spatial maps were estimated as the centrotypes of com-ponent clusters to reduce sensitivity to initial algorithm parameters (Ma et al., 2011). Single-subject images were concatenated in time to per-form the single group ICA estimation and subject specific spatial maps estimated using back reconstruction with the GICA approach in GIFT. The GICA algorithm estimates single-subject images and timecourses from the single group ICA estimation, thereby allowing individual variation in spatial maps and timecourses (Erhardt et al., 2011), and we have previously demonstrated that inter-subject variance is well-cap-tured in the group ICA model using this algorithm (Allen et al., 2012). The resulting independent components (ICs) were scaled by converting each subject component image and the time course to z-scores. We performed an analysis of the reliability of the ICA source estimates obtained in the ICA decomposition by calculating a stability metric (Ma et al., 2011) for each of the ICASSO clusters (Reported in Supplemen-tary Table 1). This demonstrated that the decomposition achieved compactly clustered components, with > 95% of components achieving > 0.75 average intra-cluster similarity where > 0.7 is con-sidered acceptable. Components with < 0.75 average intra-cluster si-milarity were discarded to be conservative.
2.5. Network selection and feature identification
ICA generates components from the mixed fMRI signal that re-present a mix of‘true’brain networks and artefactual components from various sources such as cerebrospinalfluid, white matter, blood vessels and head motion. The separation of components into these two groups currently remains a semi-manual process, informed by quantitative metrics but reliant on the experience of the investigators, though the automation of this process is an area of ongoing research by ourselves and others. For each of the 75 ICs in this study, we separated INs from artifact by examining spectral metrics and visually inspecting the spa-tial maps. Spectra were characterized by two metrics: the fractional amplitude of low frequencyfluctuations (fALFF), and dynamic range.
fALFF is the ratio of the integral of spectral power below 0.10 Hz to the integral of power between 0.15 and 0.25 Hz. Dynamic range is the difference between the peak power and minimum power at frequencies to the right of the peak. Data are provided for each component in Supplementary Table 2. Generally, ICs that represent brain networks have higher values in spectral metrics, while noise components have lower values. Two graders (NdL and VDC) used the metrics to rate the ICs “good”, “fair” and“poor”.“Poor” components with low spectral values were discarded, with the two components with < 0.75 intra-cluster similarity in the ICASSO analysis also detected in this group. Spatial maps rated“fair”and“good” based on metrics were visually inspected and any considered marginal were also excluded to pursue a conservative analysis. In particular, components with activation that visually overlaps white matter, or has a strong‘edge like’appearance were discarded. We retained 33 ICs that were the 33 INs collectively forming the analytic substrate for the remainder of our study (Supplementary Fig. 1).
Maxima of coordinates in MNI space associated with each of the INs are detailed in Supplementary Table 3. An attribution was made of the primary neurocognitive function of each IN using, where available, prior studies defining networks on the basis of specific coordinates and/ or regions and also by examining the function of four or more of the highest maxima using the Brodmann Interactive Atlas (http://www. fmriconsulting.com/brodmann/Interact.html). Multiple literature-based confirmatory sources with specific Talairach or MNI coordinates were available for all members of the TPN and the DMN (the control INs) and for the primary sensorimotor and visual networks (Laird et al., 2011; Smith et al., 2009; Spreng et al., 2013; Seeley et al., 2007; Dosenbach et al., 2006; Dosenbach et al., 2007; Power et al., 2011; Fox et al., 2005; Vernet et al., 2014). Subsequently, we grouped INs into primary neurocognitive systems, namely task positive (TPN), default mode (DMN), visual (VIS), sensorimotor (SM), language (LANG) and other control (OTH) networks.
2.6. Steady-state functional connectivity measures
We computed 5 outcome measures to characterize steady-state connectivity, summarized inTable 1:
To compute power spectra, subject-specific timecourses were de-trended using the multi-taper approach derived from Chronux (Bokil et al., 2010), with the time-bandwidth product set to 3 and the number of tapers set to 5. Spectra were then element-wise log-transformed to normalize the skewed power distribution. We constructed spatial maps by selecting voxels that represented the strongest and most consistent coactivations for each IN on a voxelwise basis across all subjects, by performing a voxelwise one-sample t-test on the individual subject component imaging and thresholding individual voxels at (mean + 4 standard deviations). Thus, spatial maps represent the brain regions most associated with the component's timecourses, instantiated in thresholded t-maps. We constructed the steady-state FNC matrix by computing the Pearson's correlation coefficient between every pair of timecourses to generate a symmetric 33 × 33 matrix of correlations for each subject. First, subject-specific timecourses were detrended and despiked, and filtered using afifth-order Butterworth low-passfilter with a high frequency cutoff of 0.15 Hz. Correlations were then
transformed to z-scores using Fisher's transformation (z = atanh(k)) where k is the correlation between the timecourses of any two com-ponents.
Using the Pearson's correlation coefficient between every pair of INs for each subject, we constructed sets of correlations to form the intra-system and inter-intra-system measures. For the intra-intra-system measure, cor-relations pairs were grouped into the neurocognitive system of interest corresponding to our core grouping of INs. For example, all correlations between each of the possible pairwise combinations of the seven sen-sorimotor networks comprised the sensen-sorimotor system group. For the inter-system measure, positive and negative correlation pairs were si-milarly grouped but in this case to examine effects between the systems. For example, the inter-system correlation between the TPN and DMN would include all possible pairings among the six TPN and three DMN INs.
2.7. Steady-state connectivity statistical analysis
Covariates (predictors) of interest (Extended Data Table 4) were age in years, full scale IQ level, framewise displacement (coded as con-tinuous variables), site, male or female sex, diagnosis of autism or controls, whether subjects had their eyes open or closed during the scan, if subjects were on any medication at the time of the scan, and the presence of any co-morbid diagnoses (coded as discrete variables). Data for each subject were obtained from the ABIDE phenotypic file. We were not able to model handedness, since handedness is not available in the ABIDE phenotypicfile for many sites. Age and IQ were plotted as histograms and compared with the Gaussian distribution, and skewness and kurtosis calculated, and age was log transformed. Since the dataset includes images acquired from 16 sites, we also included the site where the study was performed as a covariate in order to examine whether site was a significant predictor of response variation. Each site was modeled as an individual regressor. While the variance from all sites was re-tained, thefirst site alphabetically (CalTech) was selected to act as a dummy variable (comparison group) within the multiple regression model to avoid exact collinearity. Every possible pair of covariates was submitted to modeling and all effects on outcome measures were ana-lyzed on a voxelwise basis, a more conservative method than cluster-based techniques (Eklund et al., 2016).
In order to optimize for the large dimensions of the voxelwise out-come measures (Spectra, spatial maps and FNC pairwise correlations) we used a multivariate model selection strategy to enable testing of predictors on the response matrices (for voxelwise outcome measures) as a whole and reduce the number of statistical tests performed. First, we proceeded by backward selection, performing a multivariate ana-lysis of covariance (MANCOVA) on each predictor in the model using the MANCOVAN toolbox in GIFT (Allen et al., 2011). This proceeds in a stepwise fashion, performing an F-test at each iteration to compare the current full model with the reduced model and produce afinal reduced model in which all terms not associated with higher order interactions are preserved at alpha = 0.01 to control false discovery rate (FDR). Reduced models were independently selected for each voxelwise out-come measure and every IN. In the MANCOVA, site and mean frame-wise displacement were found to be significant predictors. Accordingly, the variance associated with site and framewise displacement was re-moved from the analysis by removing the variance associated with each individual site regressor and the framewise displacement regressor from the correlation values.
Subsequently, significant predictors were submitted to multiple univariate regressions and covaried with age, sex, diagnostic group, medication status, presence of psychiatric co-morbidities and IQ. We tested for significance atα< 0.01 corrected for multiple comparisons to control FDR to discover which outcome measures were associated with age, sex, diagnostic group, medication status, presence of psy-chiatric co-morbidities, and IQ. Univariate models werefit to the ori-ginal data and not the reduced model. For the FNC correlation measures
Table 1
Steady-state outcome measures.
Measure Hierarchical level and type of characterization Power spectra Within-network coherence
Spatial maps Strongest within-network regional activations FNC Pairwise connectivity between individual networks Intra-system Correlation strength within grouped networks Inter-system Correlation strength between grouped networks
we calculated the standard error of the mean (STDERR). We performed a similar analysis using the same components including only subjects with ASD to further determine if the presence of psychiatric co-mor-bidities and current use of medication were significant predictors, and found that they were not. In order to assess for residual motion effects, the interaction of framewise displacement × group was also tested in the univariate analysis to assess for residual motion effects in significant predictors.
For the intra-system measure, we calculated the mean of correla-tions for all possible pairwise combinacorrela-tions of INs within each system (for example, all the sensorimotor INs). We then performed two sample t-tests (2-tailed, assuming equal variance) to discover whether sig-nificant (α< 0.05, corrected to control FDR) differences existed for mean intra-system correlations between subjects with autism and con-trols.
For the inter-system analysis, we calculated mean of correlations for all possible pairwise combinations of INs between pairs system (for example, all the sensorimotor INs with all DMNs). We then performed two sample t-tests (2-tailed, assuming equal variance) to discover whether significant (α< 0.05, corrected to control FDR) differences existed for mean inter-system correlations between subjects with autism and controls.
2.8. Dynamic connectivity
We computed dynamic FNC using a sliding window approach in-stantiated in the dFNC toolbox in GIFT. First, the timecourses were detrended and despiked using 3D despike in the AFNI software then filtered using afifth-order Butterworth low-passfilter with a high fre-quency cutoffof 0.15 Hz. Then, FNC covariance matrices were calcu-lated between all pairwise INs for each subject using the correlations derived from our ICA analysis by moving a Gaussian window in 1 TR increments across the subject TCs. Of note, since this is multisite data the TR varies from site to site with a range of 1.5 to 3 s and our algo-rithm incorporated this. In addition, the variance associated with site was removed from the analysis by removing the variance associated with each individual site regressor from the correlation values, prior to performing clustering. Successive FNC matrices for each window were then concatenated to form a [33 × 33 × (number of window units)] array representing a state transition vector, or how the FNC state changed through time for each subject.
Subsequently, we performed a clustering analysis to examine the structure and frequency of FNC patterns that recurred in the state transition vectors. The k-means clustering algorithm was applied to the individual arrays of FNC covariance matrices using the City method and the algorithm iterated a maximum of 200 times before convergence. We iterated this method to discover the extent to which results were sen-sitive to variations in the number of clusters selected and the size of the Gaussian window. Based on our prior work (Allen et al., 2014) we chose an initial parameter set of 6 states and a window size of 30TR, and varied parameters around this for a sensitivity analysis including 5, 6 and 7 clusters, each with window sizes of 25, 30 and 35TR (and therefore with 169, 164 and 159 window units respectively) for a total of 9 permutations. In addition, we applied a threshold concept re-quiring that a given FNC covariance matrix be present in a minimum number of 10 windows for each subject included.
We note that there is an overall structure to the dFNC matrices that appears constant among the clusters and somewhat resembles a‘ ske-leton’ structure of pairwise correlations that recurs from cluster to cluster. This is an expected effect that may also be seen in comparable analyses in other disorders (Rashid et al., 2014) and may reflect the high proportion of variance in brain activity that is thought to remain similar regardless of the task being performed or individual brain state (Cole et al., 2014). In addition, in every permutation there is a matrix in which most networks appear to be correlated. These ‘red states’ do appear in dynamic connectivity analysis of other, separate datasets and
appear to be clusters representative of the mean of all variance ex-amined. We examined the individual subjects present in this state in the current analysis and they were drawn from all sites, supporting that in this current study this cluster or state may also be the mean. We note that no significant group differences were found in this‘red’state in any of the 9 permutations of the dynamic analysis and therefore it does not influence the direction of our reported results.
2.9. Dynamic connectivity statistical analysis
We computedfive measures of dynamic connectivity. Significant group differences in FNC were computed for each state using two-samplet-tests atα= 0.05, corrected to control FDR. We also calculated the number of times each subject moved between states during their individual timecourse, the average time (in windows) that each subject spent in each of the states once entering that state (dwell time), and the fraction of their total timecourse each subject spent in each state. Two sample t-tests were performed in these timing measures to examine significant (α= 0.05, corrected for dwell and fractional time to control FDR) differences between subjects with autism and healthy controls. Finally, we calculated the number of subjects within each group (con-trols and subjects affected by autism) present in each state and used two samplet-tests to examine significant (p< 0.05) differences between groups in this measure.
2.10. Test-retest reliability analysis
We performed a test-retest analysis on two subsets of the data to ascertain whether the basic directionality of our core results was reli-able. Firstly, the dataset was split into group 1 and group 2 of equal size to create two half-size datasets with similar characteristics to each other and the larger group (Supplementary Data Table 4). Prior to statistical testing, we performed a regression between the base FNC 33 × 33 matrix (Fig.1) and that of the subgroups to test their similarity. Sub-sequently, we examined group differences in power spectra, spatial maps, steady-state FNC and dynamic measures (for the median 6 state, 30TR window solution) in the subgroups using the same experimental parameters as in the larger dataset. Since the sub-groups have less power and half the degrees of freedom, we performed steady-state voxelwise statisticalt-tests at a significance level of 0.05, with correc-tion for FDR.
3. Results
3.1. A high order model delineated the steady-state connectome at multiple hierarchical levels
We assembled a 33 × 33 network matrix of interactions in a high order model, representing steady-state FNC across the whole brain for all subjects, including individuals with ASD and controls (Fig. 1a). There were no residual motion effects in FNC with the exception of reduced correlation in the three network pairs of INs 14 × 22, 12 × 29 and 32 × 33. In the test-retest analyses, FNC matrices for subgroups 1 and 2 displayed 99.7% and 99.9% correlation with the full group FNC matrix respectively. Spatial maps were grouped according to their neurocognitive function (Fig. 1b), with visual examples of the control network groups displayed (Fig. 1c) here. Among task positive networks, we extracted and positively identified the salience, ventral attention, right and left fronto-parietal, cingulo-opercular, and dorsal attention networks and three default mode networks: core, anterior and posterior. We identified 7 visual, 7 sensorimotor, 4 other control and 6 language networks (Supplementary Fig. 1 and Supplementary Table 4).
3.2. Bidirectional steady-state control network differences in ASD center on inter-network connectivity
In subjects with ASD, we identified significant differences in inter-network pairwise FNC after controlling for IQ, site, motion, medication status, presence of comorbid diagnoses, eyes open or closed, age and gender (correcting for multiple comparisons at alpha = 0.01 to control FDR). In FNC, we found reduced connectivity strength (hypo-con-nectivity) between the right fronto-parietal network and both the core and anterior default mode networks, with these effects replicated in both subgroups of the test-retest. Hypo-connectivity was also observed between the ventral attention and left fronto-parietal networks, though this effect was not reliably replicated in either test-retest subgroup. We also detected hypo-connectivity in the anterior-posterior axis of the default mode networks, replicating this effect in subgroup 1. By con-trast, the cingulo-opercular network showed abnormally increased correlation (hyper-connectivity) with the anterior DMN, replicated in subgroup 2 in test-retest. This was the only instance of hyper-con-nectivity we identified in steady-state FNC. There was no interaction of residual motion with FNC group effects in any pair of control networks. We did notfind differences between subjects with autism and controls in either measure associated with intra-network integrity (spatial maps and power spectra) in this high order model, and replicated this ne-gativefinding in both subgroups in test-retest.
Of the 5 unique network pairings that were disrupted in control networks, DMN sub-networks were involved in 4 of these, including hypo-connectivity in the anterior-posterior DMN axis. Here, ourfi nd-ings parallel much of the extant literature in autism. More specifically, hypo-connectivity among the sub-networks or nodes of the DMN (Assaf et al., 2010; Jung et al., 2014) and anterior-posterior hypo-connectivity in the DMN, (Starck et al., 2013) have been highlighted as the best-replicated findings in the (albeit heterogenous) autism connectivity literature (See review by Hull et al (Hull et al., 2016)).
In task-positive networks, it is more challenging to compare our results with others due to fewer studies, and methodologic and subject selection differences. For example, in 40 children with ASD, Abbott et al. identified hyper-connectivity between the DMN and executive (fronto-parietal) control network, in contrast to ourfinding of hypo-connectivity, though this study examined 4 networks in a lower model order, treating the fronto-parietal network as a single entity (Abbott et al., 2016). We identified a locus of hyper-connectivity involving the cingulo-opercular network, where the insula is one of two core regions. The insula and its connections have recently acquired more prominence in the autism, but it is also a core constituent of the salience network. These networks somewhat overlap (Power et al., 2011), as may be seen in Fig. 1c, and ideally, both networks would be present in any one model to allow effective inter-study comparisons: most extant studies focus on one or the other network. Connectivity differences in the in-sula and salience networks have been well-demonstrated in autism, particularly in multiple interesting studies by the Uddin group (Uddin et al., 2013; Uddin and Menon, 2009). With respect to the cingulo-opercular network, Chen et al. (Chen et al., 2016) found disrupted connectivity among the cingulo-opercular, fronto-parietal networks and DMN and intriguingly, Nomi & Uddin detected a ‘weaker functional relationship between the DMN and a [non-salience] subcortical/insula component’ in adolescents with ASD (Nomi and Uddin, 2015). Our finding of hyper-connectivity between cingulo-opercular and anterior DMN differs from this general trend of identifying hypo-connectivity in insula-related networks. In this regard, more studies in autism including both salience and cingulo-opercular networks will be helpful to dis-ambiguate effects. In terms of the canonical DMN-dorsal attention cir-cuit, ourfinding that this had normal connectivity parallels work by others (Nomi and Uddin, 2015; Kennedy and Courchesne, 2008).
Our negative results in measures of intra-network disruption in control networks are in accordance with some studies (Abbott et al., 2016; Bos et al., 2014), but other groups have detected differences in
Fig. 1.The steady-state functional connectome in a high order model.
a, Pearson pairwise correlations between networks averaged across the fMRI timecourses delineate a 33 × 33 network matrix of interactions in a high order model, representing steady-state FNC across the whole brain for all subjects, including individuals with ASD and controls. We grouped networks by their primary neurocognitive functionb, into systems. Members of the task positive and default mode control systemc, are shown in greater detail with slices corresponding to the peak intensity activation in each plane. Coordinates for each network including right and left maxima for the top three regions are available in Supplementary Table 4.
intra-network measures, and an important school of thought exists conceptualizing ASD as a disorder where local hyper-connectivity contrasts with long-range hypo-connectivity (Geschwind and Levitt, 2007). Fewer studies specifically focusing on TPN networks as distinct from the DMN exist, and age stratification, may also be an important influence in detecting these effects on a network basis. For example, Farrant & Uddin (Farrant and Uddin, 2016) detected hyper-connectivity within the dorsal and ventral attention networks in children with ASD, but hypo-connectivity in adults. Model order is also worthy of con-sideration, since intra-network disruption in a low model order might appear as inter-network disruption among sub-networks in a higher model order.
3.3. Domain networks showed pervasive reduced inter-network connectivity in ASD
Control networks exert configurative influence over downstream domain-specific networks. We also identified group effects in domain-specific networks. Sensory abnormalities are common in ASD, encom-passing visual, tactile, auditory and olfactory processing differences, with a common theme of atypical perceptual integration. Motor fea-tures - predominantly stereotypies, sometimes called‘stimming’- have been of particular interest as possible diagnostic markers since they precede communication deficits at ages 6–12 months. Paralleling our findings in control networks, we identified widespread differences in pairwise FNC in domain networks in ASD (Fig. 2), but not in spectra or spatial maps, again suggesting that disruption is centered on the func-tional relationships between networks rather than their intra-network integrity. However, a contrastingfinding was that in domain networks the direction of these pairwise differences was uniformly of reduced correlation strength. A total of 16 unique pairwise differences were detected in domain-specific networks in autism. We observed reduced correlation in three network pairs of INs 14 × 22, 12 × 29 and 32 × 33 where we had detected possible motion contamination ren-dering these group effects potentially spurious, and we therefore dis-counted them in reporting results. Of the remaining 13, every group effect except IN17x19 (two sensorimotor networks) was present IN at least one of the test-retest subgroups, with three pairs (12 × 21, 17 × 21 and 15 × 31) appearing in both.
Language impairment exhibits great inter-individual variability in ASD. We found disruption to FNC in 4 language networks in 7 pairwise network relationships. Interestingly, three of these were with a single higher-level visual processing network (IN15). Three visual networks displayed pairwise reduced connectivity strength in 8 pairings, in-cluding both lower-level (IN 12 and 14) and higher-level (IN 15) visual processing networks. Well-known visual perceptual differences in ASD are characterized by deficits in global processing (whole object) but superior low level processing (objectdetails), and recent causative ex-planations have focused on a lack of integration between low- and high-level visual processes (Smith et al., 2015). In sensorimotor networks,
we identified FNC differences in 5 networks in 10 pairings, most commonly with visual or other sensorimotor networks. IN21, the right primary sensorimotor network, displayed the most frequent deficits, with hypo-connectivity in four pairwise relationships. Two of these, with IN12 (a visual network) and IN17 (a sensorimotor network) re-plicated in both subgroups in test-retest. These prominent effects in the primary right sensorimotor network are noteworthy given motor ste-reotypies are a cardinal feature of ASD.
3.4. Group effects in FNC in control and domain-specific networks were unaffected by IQ level
Intellectual disability is a significant co-morbidity with ASD. In contrast to most published studies using large datasets, we included subjects with co-morbid intellectual disability and low normal IQ (< 80). IQs ranged from 41 to 148 (mean = 108) and were normally distributed in our subject group, with 27% below the population mean of 100. Importantly, no FNC effects were attributable to IQ or an IQ x autism interaction (replicated in test-retest), indicating that ASD may have an FNC phenotype that is independently detectable. While sig-nificant FNC effects were attributable to age (though not an age x autism interaction), this is consistent with results in unaffected in-dividuals (Allen et al., 2011), reflecting a generalized maturation pro-cess.
3.5. System-based measures demonstrated a mix of hyper- and hypo-connectivity
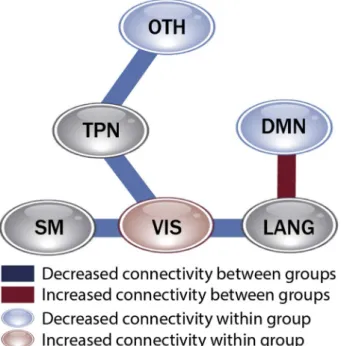
To complement intra-network and inter-network measures we ex-amined connectivity relationships in groups of networks, arranged by their neurocognitive function (Supplementary Fig. 1). In autism (Fig. 3), we identified significantly decreased within-system connection strength in the default mode network group (comprising the three DMN subnetworks) and the group of other control networks. Since this is a high order model which decomposes the DMN into constituent sub-networks, thisfinding may be conceptually related tofindings by others of disruption within the DMN in lower order models, as discussed above. By contrast, we identified abnormally increased connectivity within the visual network group. There was no difference between autism and controls in the intra-system measure in the TPN, sensor-imotor or language groups. When relationships between systems of networks was considered, there was also a mix of hyper- and hypo-connectivity, though as with individual FNC, hypo-connectivity pre-dominated. Reduced inter-system connection strength most affected the visual system, in its connections to language, sensorimotor and TPN systems, and the TPN group relationship to other control networks. However, we observed hyper-correlation between the language and DMN systems.
Fig. 2.Steady-state FNC differences in ASD.
a,Significant differences (log scale) in functional connectivity measures between b,pairs of net-works after controlling for IQ, site, motion, age, gender, eyes open/closed, medication and co-mor-bidity status, corrected for multiple comparisons at α= 0.01 to control false discovery rate (FDR).
3.6. Dynamic connectivity analysis delineates a temporal structure of dysconnectivity in ASD
Most fMRI connectivity analyses use steady-state measures, ag-gregating averaged connections to create a summative, stationary pic-ture of whole-brain network configuration. However, functional con-nectivity and FNC are non-stationary, exhibiting dynamic shifts that also display spatiotemporally patterned organization. Sustained tem-poral synchrony among networks creates multiple separable, persistent states observable in fMRI (Calhoun et al., 2014; Cole et al., 2013). States likely instantiate the multi-scale spatio-temporal organization of information processing, enabling transitions between processing modes
(e.g. attentional shifts) and the application of established templates to novel tasks and consolidation of learning. As patterns of intra-network regional coupling facilitate the formation of task-specific templates at a lower hierarchical level, these dynamic configuration templates may frame efficient inter-network brain state transitions and represent a “latent functional architecture” enabling higher cognition (Spreng et al., 2013). Newer dynamic FNC techniques using fMRI can delineate variability in FNC over the resting state neuroimaging time-course and have become a powerful new tool to elucidate the mechanisms of state changes underlying behavior and cognition (Calhoun et al., 2014) successfully discriminating patient groups in schizophrenia and bipolar disorders (Rashid et al., 2014). To date, these concepts have only been applied in ASD to data from a handful of brain regions in small samples (Falahpour et al., 2016) and have not been performed on a whole brain, network basis.
Unlike conventional FNC analysis that averages across the rsfMRI timecourses, this dynamic approach can separate significant differences in patterns of abnormal connectivity and locate these in individual states, providing a more granular picture of the structure of functional connectivity in ASD. Here, the 6 state, 30TR-size window solution is displayed (Fig. 4), with the full set of state transition matrices for control subjects in the sensitivity analysis available for comparing the effects of parameter variation (Supplementary Fig. 3).
Analysis of group effects (‘Difference’) shows significant (corrected for multiple comparisons at alpha = 0.05 to control FDR) pairwise differences in multiple states. As in steady-state FNC, a mix of abnor-mally decreased and increased correlation is evident in control network pairings with decreased connectivity more common among domain-specific networks. While research is still at too early a stage to attribute specific behaviors or tasks that may be associated with individual brain states identified in dynamic resting-state analysis, we note that dis-ruption to the overall configuration of pairwise correlations is most common in certain states. In these states there is more diffuse antic-orrelation, particularly in the relationships among network systems vs within systems, and between the control network vs sensorimotor and visual groups. In particular, the right fronto-parietal control network is anticorrelated with most other TPN members.
We compared results across the sensitivity analysis (Fig. 5) and were particularly interested in group differences present regardless of the
Fig. 3.Intra-system and inter-system connectivity in ASD.
Group effects in correlations between networks within a neurocognitive system (bubbles), and between systems (lines) corrected atα= 0.05 to control FDR.
Fig. 4.Dynamic functional connectivity across brain states in controls and subjects with ASD.
Distinct, stable brain states exist within the aggregated resting state timecourses each with a specific FNC pattern. Each 33 × 33 network matrix is composed of Pearson pairwise correlations (color scale) between the 33 networks identified in the group independent component analysis for all subjects, decomposed into individual states using k-means clustering. We computed 9 permutations of this analysis with the 6 state, 30TR-size window solution shown here. Dynamic connectivity in control subjects (‘Unaffected’) is compared to that in individuals with ASD (‘Autism’) and significant group effects (‘Difference’) displayed for each individual state (log scale). Significant pairwise differences in FNC for each state are displayed, corrected for multiple comparisons at alpha = 0.05 to control FDR.
window size, and observable in ≥2 state number variants. Among control networks, hypo-correlation between the right fronto-parietal network and core DMN, in the anterior and posterior DMN axis, and hyper-correlation between the cingulo-opercular network and anterior DMN met these criteria. These were also robust in steady-state FNC and replicated in 1 + sub-group in dFNC test-retest. Hypo-correlation of the right fronto-parietal control network with the anterior DMN was the single most robustfinding in our entire pipeline, present in all 9 dFNC permutations, sub-group 1 of the dFNC test-retest, the steady-state analysis and both steady-state test-rest groups. However, hypocorrela-tion between the ventral attenhypocorrela-tion and left fronto-parietal networks seen in steady-state did not meet these criteria or replicate in dFNC test-retest. Two other connections that were not present in the steady-state analysis were robust to parameter variation in the dFNC sensitivity, namely hypoconnectivity between the posterior DMN and both the right fronto-parietal network and core DMN, but were not replicated in the dFNC test-retest analysis.
Domain network group effects in dFNC were less consistent between steady-state and dynamic FNC, and within permutations of the dFNC sensitivity analysis, showing particular paucity in the 7 state solution. Despite the greater numbers of domain-specific networks, only three group differences were as robust as the highlighted control networks effects across the dFNC sensitivity analysis. Two of these observations involved language networks, and were between INs 25 and 30 (present in all 9 permutations, and in sub-group 2 in the test-retest) and INs 32
and 8 (present in two states and all windows, but not test-retest), though these effects were not present in the steady-state FNC. However, the third was a connectivity deficit (appearing in 2 states and all window variants) between the right primary sensorimotor network and a high-level visual network (IN21x17) that replicated strongly in the steady-state FNC analysis, though not in the dFNC test-retest.
3.7. The tempo of brain state transitions may be jittered in ASD
The disruption we identified in the fronto-parietal networks implies alteration to start-cues, while that in the cingulo-opercular network suggests impaired state maintenance. Therefore, we predicted loss of appropriate tempo in brain state transitions in ASD. Our results suggest disrupted state transition tempo does exist in ASD in the form of a significant decrease in the number of times subjects with autism change brain state. This result varied somewhat across permutations of the dFNC analysis, but oscillations were significantly dampened in autism in 5/9 permutations, and narrowly missed significance in 4 more, making it a fairly robust finding (Fig. 6) in the sensitivity analysis, though it did not replicate in test-retest. We did not detect significant group differences in subjects' dwell time or the fraction of time they spent each state in nearly every permutation of the analysis, with scattered exceptions. Differences in the number of subjects in each state was never significant.
Fig. 5.Group Differences in Dynamic Connectivity Sensitivity Analysis.
Group differences in autism vs controls for each permuta-tion of the dFNC analysis. Significant pairwise differences in FNC for each state are displayed, corrected for multiple comparisons at alpha = 0.05 to control FDR.
4. Discussion
During the first year of life the simple IN architecture present at birth reorganizes in a sequenced trajectory supporting brain functional maturation. The cingulo-opercular network differentiates out of the fronto-parietal control networks, DMNs proliferate, sensorimotor, vi-sual and attention networks reorganize and overall long-range con-nectivity increases (Fair et al., 2007). Control networks operate at the highest logical level of brain organization, exerting downstream con-figurative effects.
The control system backbone comprises sets of specific task-positive (TPN) and default mode networks (DMN,Fig.1) (Cole et al., 2013). The Petersen-Posner attention model proposes that the dorsal attention network selects sensory stimuli based on internal goals/expectations (orienting) while the ventral attention network is activated by beha-viorally important but unexpected stimuli (reorienting), and controls recovery from attentional lapses. Reorienting enables the improvisation of novel, task-relevant actions and adaptive function. Executive control incorporates and extends this basic attentional scaffold (Petersen and Posner, 2012). In the influential dual network view of executive con-trol, the fronto-parietal control networks and certain ventral attention regions (Dosenbach et al., 2006) provide transient start cue signals before a task-specific spatio-temporal FNC configuration is instantiated to perform a task. The cingulo-opercular network follows with a sus-tained task-general maintenance signal (Dosenbach et al., 2007; Sestieri et al., 2014) to keep the brain online. Core cingulo-opercular (dorsal anterior cingulate, bilateral insula) and more anterior fronto-parietal control network regions also perform error/performance feedback (Dosenbach et al., 2006; Dosenbach et al., 2007) with a salience net-work believed to maintain alertness and visual attention (Sadaghiani et al., 2010). Early work in fMRI (Fox et al., 2009) identified a re-ciprocal anticorrelated relationship between the dorsal attention net-work and correlated regions named the default mode netnet-work that became deactivated when the brain entered‘task-positive’mode and vice versa. This default mode network was accordingly associated with ‘task-negative’and interospective modes of brain function. Extending this, three default mode subsystems have recently been identified: Anterior (DMNA) involved in emotion inhibition, goal-directed and social cognition, posterior (DMNP) in memory, self-reflection and au-tobiographical conceptualization, and core (DMNC) that may facilitate intra-DMN information transfer (Andrews-Hanna et al., 2014). The combined TPN-DMN system is now understood to implement executive control by shifting the spatio-temporal patterning of whole-brain FNC states (Cole et al., 2013; Uddin et al., 2009) to implement specific or integrative tasks. Downstream, domain networks respond by
reconfiguring their activation patterns (Dosenbach et al., 2007). Char-acterizing a detailed model of whole brain FNC incorporating control network relationships represents a substantial technical challenge in fMRI data. Specifically, a high order model of > 20 networks is re-quired, since low order models fail to divide the lateralized fronto-parietal control networks (Smith et al., 2009), disambiguate the spa-tially overlapping cingulo-opercular from salience networks (Power et al., 2011) and separate the DMN subsystems (Andrews-Hanna et al., 2014).
In subjects with ASD, our work demonstrates disruption in the control networks that are vulnerable to altered differentiation during the infant period, and traces the sequelae that propagate dynamically through the chronnectomic hierarchy. The correspondence between our findings, events in the normal developmental sequence of networks during infancy, and the unique infantile age of onset of ASD suggests that early disrupted network maturation from diverse causes may manifest as a convergent macroscale functional phenotype in ASD. Our results suggest substantial differences in the function of certain control networks in autism, particularly those associated with task cues and task maintenance, and the ‘task-negative’ default mode networks, comporting with conceptualizations of autism as being in part a‘ dis-order of control’(Fair et al., 2007). These results in the resting-state suggest alterations to the networks that support executive/top-down processes operating in the brain to control the instantiation, main-tenance and switching of the functional connectivity configurations that subserve tasks. Thus, they led us to predict that there would be alteration to dynamic states, where we identified disrupted dynamic FNC configurations, and a dampening to subject oscillations among brain states. Since thesefindings are in imaging obtained in the resting-state, and connectivity configurations in this condition are hypothe-sized to be templates that are active in task-performance, it raises the important question of whether ourfindings could be demonstrated in task conditions in autism.
Our model consistently confirmed the importance of abnormalities in control network architecture in ASD, and of the central role of inter-network connectivity, in both steady-state and dynamic measures. We provide an integrated, detailed picture of whole-brain connectivity in autism that proposes certain motifs may operate across this hetero-genous disorder, notwithstanding the variability among individuals in terms of neurocognitivefindings, IQ level and psychiatric comorbid-ities. This coherent framework may help reconcile disparate previous observations (such as debates regarding short- versus long-range or under- versus over-connectivity), elucidate connectivity patterns that have hitherto been obscure, and demonstrate that not only the spatial but also the temporal organization of brain function is disturbed in ASD. We found that control networks as a group exhibit proportionally more deficits that are consistent between steady-state and dynamic FNC measures than domain-specific networks. This observation may be autism-specific, or may be attributable to control networks having more inherent variability in their correlations across brain states, and war-rants further investigation.
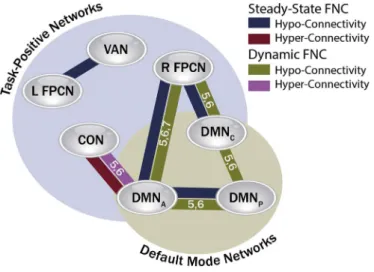
Our aim in this study was to bring together many outcome measures spanning steady-state and dynamic connectivity to comparefindings across these techniques in a high-order model and large, varied subject group. When we consider results from this perspective, guided also by ourfindings in sensitivity and test-retest analysis, several specific net-work connections are prominent. Deficits in the right fronto-parietal-DMNA, right fronto-parietal-DMNC, and cingulo-opercular-DMNA cir-cuits, and in the DMNA-DMNPaxis proved quite robust (Fig. 7), and may link mechanistically to the disrupted state change tempo that we identified in autism. Further investigation of these motifs, for example by exploring their presence in sub-populations of ASD, other conditions such as task-based fMRI, and comparisons to other developmental neuropsychiatric disorders, would help confirm their specificity and potential to elucidate mechanisms of ASD behaviors.
The collection of resting state fMRI data is not confounded by
Fig. 6.Difference in the number of times subjects changed states in ASD.
For each permutation of the dynamic connectivity analysis (horizontal axis), the sig-nificance of the group difference is shown, where plog10= 1.30 is equivalent top= 0.05.
The number of times subjects changed states was significant or almost significant in every permutation except the 6 state, 25TR solution.
behavioral, motor or language performance requirements and is highly efficient, with 6 min of data sufficient to reliably capture networks and provide multiple outcome measures (Allen et al., 2011). Network con-nectivity measures obtained from resting state fMRI hold great promise to further inform our understanding of human brain development and function and provide neuropsychiatric biomarkers and treatment tar-gets for disorders such as ASD. Future studies comparing conditions distinct from and overlapping with ASD will inform the specificity of thesefindings.
5. Author contributions
N.dL conceived the study design, and performed data preparation, neuroimaging and statistical analysis with input from V.D.C.; V.D.C conceived the study design and developed the methods and software used in the analysis; D.D. and B.H.K. participated in study design. S.R. performed algorithm development and coding. N.dL wrote the manu-script with input from V.D.C, D.D. and B.H.K.
Supplementary data to this article can be found online athttp://dx. doi.org/10.1016/j.nicl.2017.05.024.
Acknowledgements
The authors thank Cameron Craddock and Chao-Gan Yan from The Child Mind Institute for their clarification of collection methods in the ABIDE dataset. We also thank Brian A. Dickinson for his assistance with coding, suggestions and proofreading, and B. Ernesto Johnson for his assistance with pairwise correlation mapping and figure preparation. This work was supported by the American Psychiatric Institute Janssen Scholar Award, and the National Center For Advancing Translational Sciences of the National Institutes of Health under Award Number UL1TR000423 to N.dL and by the National Institutes of Health under grants P20GM103472 and R01EB020407 and the National Science Foundation under award 1539067 to V.D.C. The content is solely the responsibility of the authors and does not necessarily represent the official views of the National Institutes of Health. The authors declare they have no conflicts of interest.
References
Abbott, A.E., et al., 2016. Patterns of atypical functional connectivity and behavioral links in autism differ between default, salience, and executive networks. Cereb. Cortex 26, 4034–4045.http://dx.doi.org/10.1093/cercor/bhv191.
Allen, E.A., et al., 2011. A baseline for the multivariate comparison of resting-state net-works. Front. Syst. Neurosci. 5, 2.http://dx.doi.org/10.3389/fnsys.2011.00002. Allen, E.A., Erhardt, E.B., Wei, Y., Eichele, T., Calhoun, V.D., 2012. Capturing inter-subject variability with group independent component analysis of fMRI data: a si-mulation study. NeuroImage 59, 4141–4159.http://dx.doi.org/10.1016/j. neuroimage.2011.10.010.
Allen, E.A., et al., 2014. Tracking whole-brain connectivity dynamics in the resting state. Cereb. Cortex 24, 663–676.http://dx.doi.org/10.1093/cercor/bhs352.
Andrews-Hanna, J.R., Smallwood, J., Spreng, R.N., 2014. The default network and self-generated thought: component processes, dynamic control, and clinical relevance. Ann. N. Y. Acad. Sci. 1316, 29–52.http://dx.doi.org/10.1111/nyas.12360. Anticevic, A., et al., 2014. Global resting-state functional magnetic resonance imaging
analysis identifies frontal cortex, striatal, and cerebellar dysconnectivity in obsessive-compulsive disorder. Biol. Psychiatry 75, 595–605.http://dx.doi.org/10.1016/j. biopsych.2013.10.021.
Assaf, M., et al., 2010. Abnormal functional connectivity of default mode sub-networks in autism spectrum disorder patients. NeuroImage 53, 247–256.http://dx.doi.org/10. 1016/j.neuroimage.2010.05.067.
Bokil, H., Andrews, P., Kulkarni, J.E., Mehta, S., Mitra, P.P., 2010. Chronux: a platform for analyzing neural signals. J. Neurosci. Methods 192, 146–151.http://dx.doi.org/ 10.1016/j.jneumeth.2010.06.020.
Bos, D.J., et al., 2014. Developmental differences in higher-order resting-state networks in autism Spectrum disorder. Neuroimage Clin 4, 820–827.http://dx.doi.org/10.1016/ j.nicl.2014.05.007.
Buescher, A.V., Cidav, Z., Knapp, M., Mandell, D.S., 2014. Costs of autism spectrum disorders in the United Kingdom and the United States. JAMA Pediatr. 168, 721–728. http://dx.doi.org/10.1001/JAMAPEDIATRICS.2014.210.
Calhoun, V.D., Adali, T., 2012. Multisubject independent component analysis of fMRI: a decade of intrinsic networks, default mode, and neurodiagnostic discovery. IEEE Rev. Biomed. Eng. 5, 60–73.http://dx.doi.org/10.1109/RBME.2012.2211076. Calhoun, V.D., Miller, R., Pearlson, G., Adali, T., 2014. The chronnectome: time-varying
connectivity networks as the next frontier in fMRI data discovery. Neuron 84, 262–274.http://dx.doi.org/10.1016/j.neuron.2014.10.015.
Chen, H., et al., 2016. Multivariate classification of autism spectrum disorder using fre-quency-specific resting-state functional connectivity—a multi-center study. Prog. Neuro-Psychopharmacol. Biol. Psychiatry 64, 1–9.http://dx.doi.org/10.1016/j. pnpbp.2015.06.014.
Cole, M.W., et al., 2013. Multi-task connectivity revealsflexible hubs for adaptive task control. Nat. Neurosci. 16, 1348–1355.http://dx.doi.org/10.1038/nn.3470. Cole, M.W., Bassett, D.S., Power, J.D., Braver, T.S., Petersen, S.E., 2014. Intrinsic and
task-evoked network architectures of the human brain. Neuron 83, 238–251.http:// dx.doi.org/10.1016/j.neuron.2014.05.014.
Di Martino, A., et al., 2014. The autism brain imaging data exchange: towards a large-scale evaluation of the intrinsic brain architecture in autism. Mol. Psychiatry 19, 659–667.http://dx.doi.org/10.1038/mp.2013.78.
Dosenbach, N.U., et al., 2006. A core system for the implementation of task sets. Neuron 50, 799–812.http://dx.doi.org/10.1016/j.neuron.2006.04.031.
Dosenbach, N.U., et al., 2007. Distinct brain networks for adaptive and stable task control in humans. Proc. Natl. Acad. Sci. U. S. A. 104, 11073–11078.http://dx.doi.org/10. 1073/pnas.0704320104.
Du, Y., et al., 2015. A group ICA based framework for evaluating resting fMRI markers when disease categories are unclear: application to schizophrenia, bipolar, and schizoaffective disorders. NeuroImage 122, 272–280.http://dx.doi.org/10.1016/j. neuroimage.2015.07.054.
Duerden, E.G., Mak-Fan, K.M., Taylor, M.J., Roberts, S.W., 2012. Regional differences in grey and white matter in children and adults with autism spectrum disorders: an activation likelihood estimate (ALE) meta-analysis. Autism research : official journal of the International Society for Autism Research 5, 49–66.http://dx.doi.org/10. 1002/aur.235.
Eklund, A., Nichols, T.E., Knutsson, H., 2016. Cluster failure: why fMRI inferences for spatial extent have inflated false-positive rates. Proc. Natl. Acad. Sci. U. S. A. 113, 7900–7905.http://dx.doi.org/10.1073/pnas.1602413113.
Erhardt, E.B., et al., 2011. Comparison of multi-subject ICA methods for analysis of fMRI data. Hum. Brain Mapp. 32, 2075–2095.http://dx.doi.org/10.1002/hbm.21170. Fair, D.A., et al., 2007. Development of distinct control networks through segregation and
integration. Proc. Natl. Acad. Sci. U. S. A. 104, 13507–13512.http://dx.doi.org/10. 1073/pnas.0705843104.
Falahpour, M., et al., 2016. 'Underconnected', but not broken? Dynamic fcMRI shows underconnectivity in autism is linked to increased intra-individual variability across time. Brain Connectivity.http://dx.doi.org/10.1089/brain.2015.0389.
Farrant, K., Uddin, L.Q., 2016. Atypical developmental of dorsal and ventral attention networks in autism. Dev. Sci. 19, 550–563.http://dx.doi.org/10.1111/desc.12359. Fox, M.D., et al., 2005. The human brain is intrinsically organized into dynamic, antic-orrelated functional networks. Proc. Natl. Acad. Sci. U. S. A. 102, 9673–9678.http:// dx.doi.org/10.1073/pnas.0504136102.
Fox, M.D., Zhang, D., Snyder, A.Z., Raichle, M.E., 2009. The global signal and observed anticorrelated resting state brain networks. J. Neurophysiol. 101, 3270–3283.http:// dx.doi.org/10.1152/jn.90777.2008.
Geschwind, D.H., Levitt, P., 2007. Autism spectrum disorders: developmental dis-connection syndromes. Curr. Opin. Neurobiol. 17, 103–111.http://dx.doi.org/10.
Fig. 7.The control network chronnectome in ASD.
A web of abnormal functional connectivity affecting brain control networks is centered on the right fronto-parietal control network and default mode network in autism. We su-perimpose pairwise disruption visible in the steady-state and dynamic connectomes (with the specific dynamic state in which dFNCfindings appear noted as a number within the line connection) to illustrate the importance of analyzing dynamic connectivity in building an integrated understanding of the differences in connectivity in this complex neuropsychiatric disorder.