University of Massachusetts Amherst University of Massachusetts Amherst
ScholarWorks@UMass Amherst
ScholarWorks@UMass Amherst
Doctoral Dissertations Dissertations and Theses
July 2016
Who is like Whom? Reclassification and Performance Patterns for
Who is like Whom? Reclassification and Performance Patterns for
Different Groupings of English Learners
Different Groupings of English Learners
Molly M. Faulkner-BondUniversity of Massachusetts Amherst
Follow this and additional works at: https://scholarworks.umass.edu/dissertations_2
Part of the Bilingual, Multilingual, and Multicultural Education Commons, Educational Assessment, Evaluation, and Research Commons, Education Policy Commons, and the Survival Analysis Commons
Recommended Citation Recommended Citation
Faulkner-Bond, Molly M., "Who is like Whom? Reclassification and Performance Patterns for Different Groupings of English Learners" (2016). Doctoral Dissertations. 624.
https://scholarworks.umass.edu/dissertations_2/624
This Open Access Dissertation is brought to you for free and open access by the Dissertations and Theses at ScholarWorks@UMass Amherst. It has been accepted for inclusion in Doctoral Dissertations by an authorized administrator of ScholarWorks@UMass Amherst. For more information, please contact
Who is like whom?
Reclassification and performance patterns for
different groupings of English learners
A Dissertation Presented By
MOLLY M. FAULKNER-BOND
Submitted to the Graduate School of the
University of Massachusetts Amherst in partial fulfillment of the requirements for the degree of
DOCTOR OF PHILOSOPHY
May 2016
College of Education
© Copyright by Molly M. Faulkner-Bond 2016 All Rights Reserved
WHO IS LIKE WHOM?
RECLASSIFICATION AND PERFORMANCE PATTERNS FOR DIFFERENT GROUPINGS OF ENGLISH LEARNERS
A Dissertation Presented By
MOLLY M. FAULKNER-BOND
Approved as to style and content by:
________________________________________ Stephen G. Sireci, Chair
________________________________________ Lisa Keller, Member
________________________________________ Aline Sayer, Member
__________________________________ Joseph B. Berger, Senior Associate Dean College of Education
DEDICATION To Frank Bond, Sr. (July 2, 1927 – April 22, 2013)
Despite being counseled out of school after 9th grade, my grandfather never stopped valuing education, and never tired of watching his children and grandchildren collect
ACKNOWLEDGMENTS
I think it is safe to say that without the formidable Ellen Forte, none of this – my degree, my dissertation, my love for education research and policy – would have happened. It was Ellen who first introduced me to this field, and it was Ellen’s intellect, leadership, and dedication that inspired me to love this work as passionately as I do. It was Ellen, too, who not only encouraged me to go to graduate school, but essentially ensured as much by conspiring with Stephen Sireci to lure me to UMass Amherst under false pretenses so that I could meet the faculty and students there. Without that benevolent manipulation, who knows where I’d be in my career or studies – at best a few years behind where I am now, but quite possibly on a different track altogether. I owe Ellen a deep debt of gratitude for all she has done (and continues to do) to support and inspire me, both directly and indirectly. I will probably spend the rest of my life thanking her (gladly).
It’s worth noting that Ellen also connected me to the person who later helped me get my dissertation data – someone who has also become a highly-respected and beloved role model to me. Unfortunately, for confidentiality reasons, I cannot thank that person by name, nor can I thank any of several other individuals from that state who made time and space in their busy schedules to help me get this dataset. If any of them see these acknowledgments, though, I trust they will know who they are, and to them I say: THANK YOU for making the time. Without you, there would be no this. I would also like to extend my gratitude to my committee members – Steve Sireci, Lisa Keller, and Aline Sayer – for their supportive attitudes, helpful feedback, and gracious flexibility throughout this process.
Steve, in particular, deserves additional thanks. Ellen didn’t trick me into going to graduate school just anywhere – she specifically guided me towards Steve Sireci and the
wonderful advisor to me, and I feel very lucky to have found him. We both care deeply about doing research that is practical and policy-oriented, and he has challenged me to grow and stretch myself as a thinker, a scholar, and a person. He has given me a great deal of intellectual freedom, particularly for this dissertation, but also stayed available and present for when I do need advice or guidance. He knows when to push and when to let up, and is particularly good at recognizing those moments when what I really need to hear is, “Molly, you should relax. Why don’t you take tonight off?” I am grateful for all Steve has done to help me get to this point in my career.
Although Steve has been my primary advisor throughout my time at UMass, I have enjoyed and appreciated the opportunities I’ve had to work with the other UMass faculty as well. Ron Hambleton, Lisa Keller, Jennifer Randall, Craig Wells, and April Zenisky have all been patient teachers, thoughtful mentors, and generally kind people to me since the day I arrived on campus. I am particularly grateful to Lisa, Jennifer, and Craig, who together have built my knowledge of statistics entirely from scratch – an especially relevant feat for this dissertation, since I taught myself a whole new method to do this study. The mere idea of such an act was inconceivable to me before I entered their classrooms.
There is a third organization whose support made this dissertation possible: Educational Testing Service (ETS), and particularly Mikyung Kim Wolf in the English Language Learning and Assessment (ELLA) group. Although Mikyung was not directly involved in this particular study, she has generally helped me expand and refine my thinking on EL research and policy in numerous ways. More specifically, she also made it possible for me to work in the ELLA group as a graduate research fellow which, in addition to being a rewarding experience, literally made it possible for me to support myself and live in the same
state as my husband while writing my dissertation. Because of the travel arrangements involved, it also allowed me to get to know Mary Pitoniak, who has been a generous and patient mentor and host. Mary sat through more defense presentation and job talk practice runs than anyone except my husband, providing thoughtful and helpful feedback every time. I am grateful to Mikyung, to Mary, and to ETS for their support.
And finally, there are those other folks – the ones who have forgiven me when I’ve missed their birthday parties and baby showers; who have opened their homes to me when I needed a place to work or sleep between semesters; who have nodded their heads
supportively when I try to explain my field, my degree, my dissertation topic, even if they have no clue or interest in what I’m talking about. I am lucky to have such wonderful friends and family in DC, Maryland, Western Mass, Princeton, and beyond, who have cheered me along through this process, and waited patiently while I tell them, “just another six months or so!” for almost two years (or really, five years, if you count all of graduate school). The Faulkners, the Bonds, and the Griswolds (also the Elitzers and the Newton House family) have all made my graduate school experience more bearable through their love and support.
And, finally, no individual has done more for me than my favorite human of all, my husband Jeff. Thank you, Jeff, for being there to encourage, support, feed, and listen to me. Thank you for sitting through dozens of practice presentations. Thank you for enduring the bad days and celebrating the good ones, and for reminding me to sleep, bathe, and breathe throughout this dissertation process. Marrying you in the middle of all this was the best decision I’ve ever made. Soon, the tables will be turned and you’ll be the one dissertating. I only hope I do as good a job supporting you as you have for me.
ABSTRACT WHO IS LIKE WHOM?
RECLASSIFICATION AND PERFORMANCE PATTERNS FOR DIFFERENT GROUPINGS OF ENGLISH LEARNERS
MAY 2016
MOLLY M. FAULKNER-BOND, B.A., HARVARD COLLEGE Ph.D., UNIVERSITY OF MASSACHUSETTS AMHERST
Directed by: Professor Stephen G. Sireci
Approximately 10 percent of the US K-12 population consists of English learners (ELs), or students who are learning English in addition to academic content in areas like English language arts (ELA) and mathematics. In addition to meeting the same academic content and performance standards set for all students, it is also a goal for ELs to be reclassified – i.e., to master English so that they can shed the EL label and participate in academic settings where English is used without needing special support. Working with a
longitudinal cohort of ~28,000 ELs in grades 3 through 8 from one state, this study uses discrete-time survival analysis to study the probability of being reclassified as a function of time, instructional covariates (e.g., type of language instruction), background
covariates (e.g., the student’s home language), years of EL-related service, and district resources. The results suggest that, while probability of reclassification can vary considerably as a function of students’ instructional program, intrastate mobility, and grade retention, ultimately the best predictor of reclassification is the amount of time students have been receiving services. Policy recommendations are provided to support decision-making and resource-allocation, particularly for students most at risk of remaining ELs for a prolonged period of item. Future research ideas are also discussed.
TABLE OF CONTENTS
ACKNOWLEDGMENTS ...v
ABSTRACT ... viii
LIST OF TABLES ... xi
LIST OF FIGURES ... xiii
CHAPTER 1. INTRODUCTION ...1
1.1. Background ...1
1.1.1. The EL Lifecycle in US K-12 Settings... 4
1.1.2. Different Ways of Grouping ELs ... 8
1.2. Statement of the Problem ...10
1.3. Significance of the Problem ...11
1.4. Purpose of the Study ...12
2. LITERATURE REVIEW ...14
2.1. What is the Overall Purpose of the EL Classification System? ...14
2.2. How Should ELP Be Defined and Measured? ...17
2.3. How Should Reclassification Standards be Set? ...20
2.4. How Should Reclassification Be Studied? ...24
2.5. Previous Studies of Reclassification: Who Gets Reclassified, and When? ...27
2.6. Common Findings Across Reclassification Studies ...39
2.7. Conclusions ...42
3. METHODOLOGY ...46
3.1. Data Characteristics and Variables ...49
3.1.1. Student Sample ... 50
3.1.2. Reclassification Criteria ... 54
3.1.3. Time Variables ... 57
3.1.4. Missing data... 62
3.2. Data Analyses ...64
3.2.1. Baseline discrete-time models ... 65
3.2.4. Model Comparisons and Interpretation ... 72
4. RESULTS ...79
4.1. Descriptive Survival Rates ...79
4.1.1. Observed Hazard and Survival by School Year ... 79
4.1.2. Observed Hazard and Survival by EL Year ... 81
4.1.3. Characteristics of Censored Students ... 82
4.2. Fitted Model: Duration Dependency and Time Specifications...87
4.2.1. Main Effect of Time ... 87
4.3. Fitted Model: Factors Affecting Survival ...90
4.4. Fitted Model: Final Model and Interpretations ...93
4.4.1. Time – Main Effects ... 95
4.4.2. Cohort, Sex, Immigrant Status, and Off-grade Status – Main Effects and Interactions ... 97
4.4.3. Home Language Main Effects ... 98
4.4.4. District and Mobility Main Effects... 99
4.4.5. Language Instructional Program – Main Effects and Interactions .... 100
4.4.6. Time in the EL Subgroup – Main Effects and Interactions ... 103
4.5. Preliminary Summary of Results ...104
5. DISCUSSION ...124
5.1. Results by Research Question ...124
5.1.1. Reclassification probability over time, grade-level ... 125
5.1.2. Reclassification probability based on time in the EL subgroup ... 127
5.1.3. Factors affecting probability of reclassification ... 128
5.2. Policy Implications and Recommendations ...130
5.2.1. Considerations for Reclassification Policies ... 130
5.2.2. Other Policy Considerations ... 133
5.2.3. Identifying and Supporting At-Risk Students ... 136
5.3. Limitations and Further Research ...136
APPENDIX: FOLLOW-UP STUDY ...140
LIST OF TABLES
Table Page
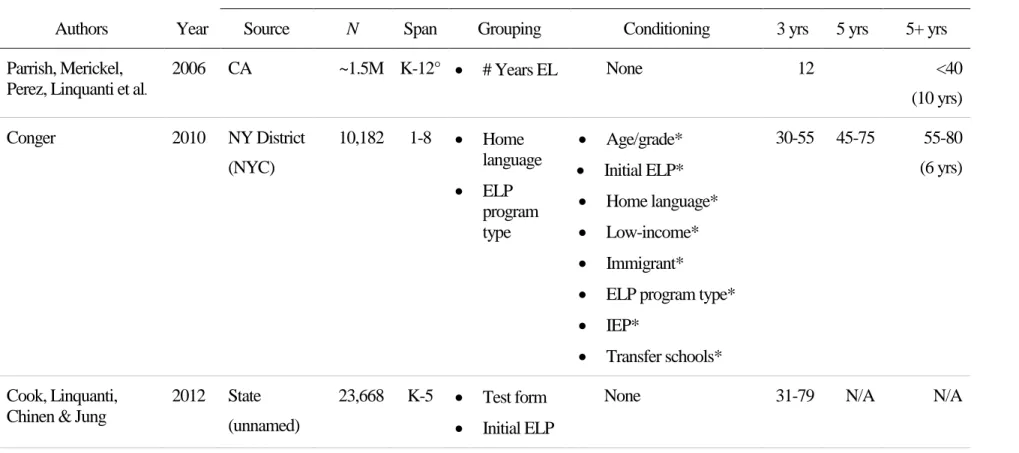
2.1. Summary of prior survival analysis designs and findings ... 44
3.1. Summary of baseline year student characteristics, by cohort ... 75
3.2. Cross-tab of school years and grade-levels ... 76
3.3. Summary of missing data, by cohort ... 76
3.4. Covariates affecting conditional probability of reclassification ... 77
4.1. Life table by school year ... 109
4.2. Life table by EL year ... 110
4.3. Summary of censored student characteristics, based on timing ... 111
4.4. Summary of time specification models by school year (SY) and EL year (EL) ... 112
4.5. Model Fit and Comparisons for Different Predictor Specifications ... 113
4.6. Final point estimates for the effect of time on reclassification ... 114
4.7. Final point estimates for the effect of sex, immigrant, and off-grade status ... 114
4.8. Final point estimates for the effect of home language on reclassification ... 115
4.9. Final point estimates for the effect of district resources on reclassification ... 115
4.10. Final point estimates for the effect of language instruction program type ... 116
4.11. Final point estimates for the effect of time in the EL subgroup on reclassification ... 117
4.12. Incremental R2 Increase Per Predictor, Controlling for Time Only... 117
A.1. Distributional characteristics of proficiency-centered ELA and math scores by year, 2007 cohort ... 151
A.2 Distributional characteristics of proficiency-centered ELA and math scores by year, 2008 cohort ... 152
A.3. Distributional characteristics on proficiency-centered ELP assessments by year, 2007 cohort ... 153
A.4 Distributional characteristics on proficiency-centered ELP assessments by year, 2008 cohort ... 154
A.5. Accommodation use by type, content area, school year ... 155 A.6. Summary of Missing Data, by Cohort ... 156 A.7. Summary of Attrition, by Cohort ... 157
LIST OF FIGURES
Figure Page
1.1 Identification and reclassification lifecycle for an English learner ... 13
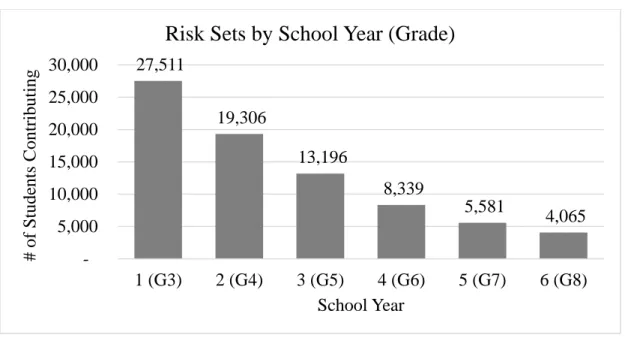
3.1. Number of students eligible for reclassification each year, by school year... 78
3.2. Number of students eligible for reclassification each year, by EL year ... 78
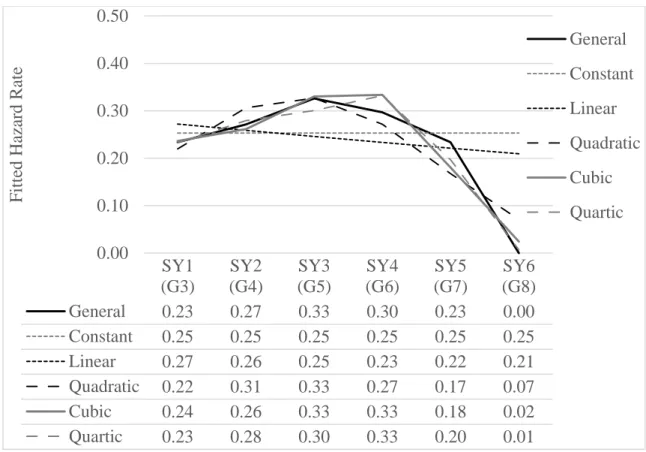
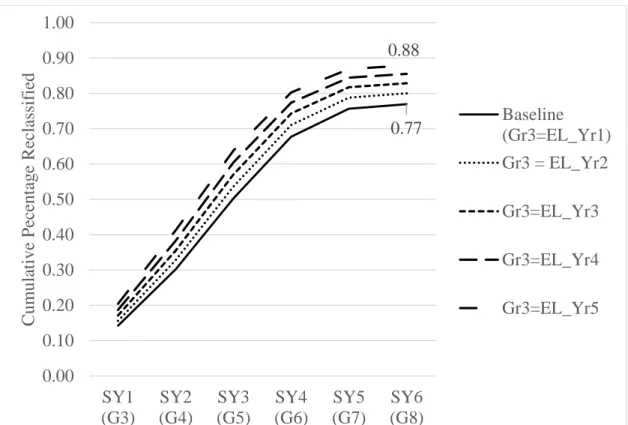
4.1. Fitted probability of reclassification by school year for various time specifications ... 118
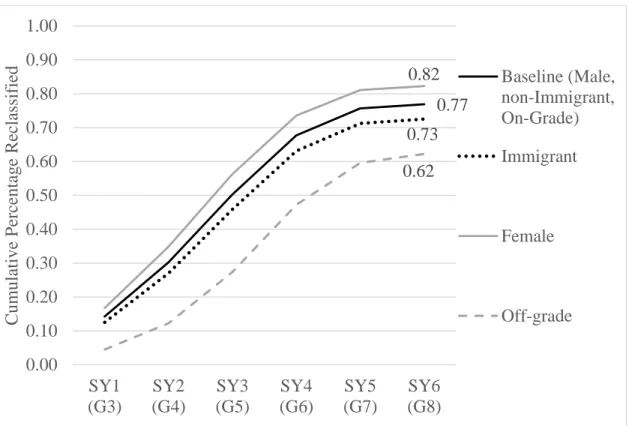
4.2. Cumulative failure rates based on sex, immigrant, and off-grade status ... 119
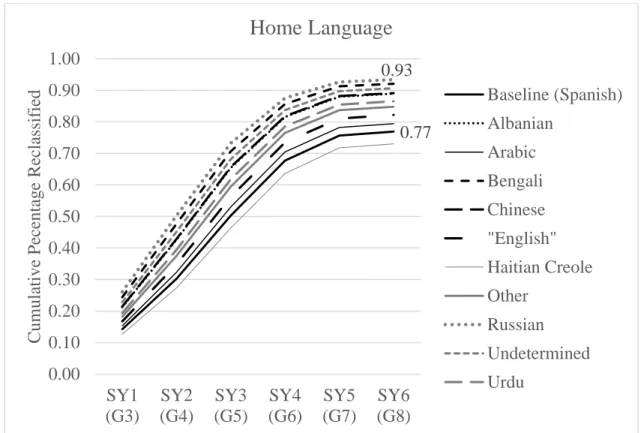
4.3. Cumulative failure rates based on home language ... 120
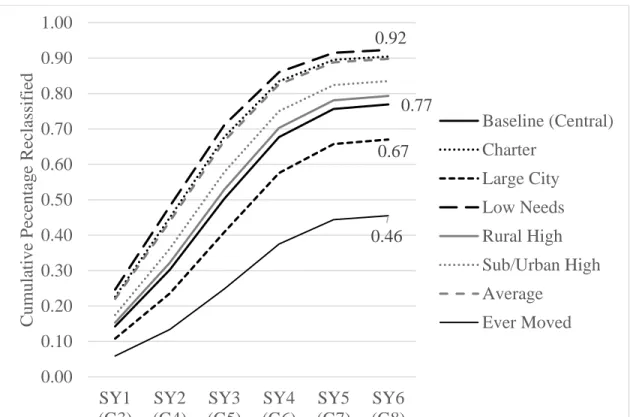
4.4. Cumulative failure rates based on district resource needs ... 121
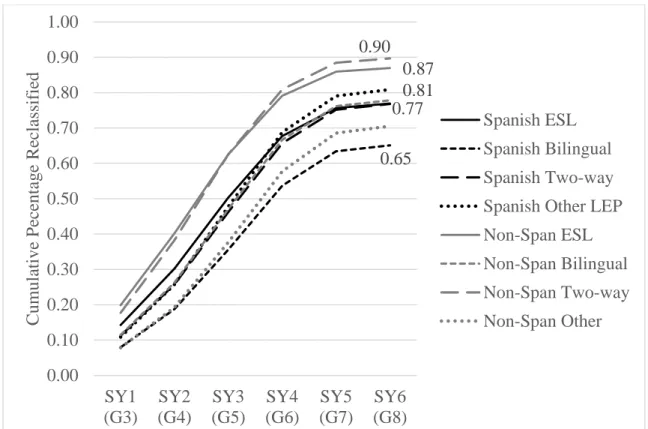
4.5. Cumulative failure rates based on language instruction program type ... 122
4.6. Cumulative failure rates based on time in the EL subgroup ... 123
4.7. Fitted hazard rates by EL year for students in different school years (grades) ... 123
A.1. Average proficiency-centered ELA scores by school year, cohort ... 158
A.2. Average proficiency-centered math scores by school year, cohort ... 158
CHAPTER 1 INTRODUCTION 1.1. Background
Approximately 10 percent of the US K-12 population consists of students who are learning the English language in addition to learning academic content in areas like English language arts (ELA) and mathematics. The goal for these students, referred to in this paper as English learners (ELs)1, is to learn English as quickly as possible so they can participate in academic settings where English is used without needing special support. An additional goal is to ensure that these students all meet the same challenging academic content and performance standards expected of the general population. An implication of the first stated goal (of linguistic proficiency) is that, eventually, ELs will be folded into the general population for instruction and assessment. This expectation of reclassification, as the transition from EL to former EL is called, makes ELs unique relative to other special populations such as students with disabilities, because it implies that their special status is intended to be temporary 2.
The timing and criteria associated with reclassification can have direct and far-reaching impact on ELs’ educational opportunities and later achievement. On the positive side, reclassification can open the door to more challenging academic coursework (e.g., Advanced Placement courses) that may have been inaccessible to students as ELs due to scheduling conflicts or lack of teacher capacity. On the negative side, reclassification
1 Students in this subpopulation are referred to with many names including limited English proficient
(LEP), English as a second language (ESL), English language learners (ELLs), emerging bilinguals (EBs), and English learners (ELs). I use the term English learner (EL) throughout this paper because of its person-first, non-deficit orientation, and because it is the terminology currently used by the US Department of Education.
typically signifies the end of a student’s access to linguistic instruction, linguistic supports in the classroom, and accommodations on assessments; obviously, premature removal of any of these supports could have detrimental effects on achievement. States are essentially tasked with balancing these pros and cons so that ELs are retained in the subgroup for long enough that they will not suffer setbacks when their supports are removed, but not so long that they emerge from the subgroup unprepared to meet standards for college and career readiness.
Given these stakes, states and districts have a vested interest in designing their reclassification process so that it threads the needle between these two undesirable consequences. This requires two important considerations in particular: first, an
appropriate cut score must be chosen for the level of ELP that ELs should obtain before transitioning. It should be high enough that their language no longer hinders their academic performance, but not so high as to be prohibitive. Second, a decision must be made about what aspects of a student’s linguistic or academic performance should (and should not) be considered as part of the reclassification decision. Many potential measures and scores are available to use (e.g., separate scores for the four language domains of reading, writing, listening, and speaking; composite scores combining some or all of these domains; scores from academic content assessments; grades or GPA, etc.), and each has its own set of pros and cons for inclusion. All of these considerations can and should be supported by data and research.
In practice, however, such data – and the research applied to them – can be difficult to parse, study, and interpret correctly. This is because ELs are a diverse group of students, both as individuals, and as a cohort over time. As individuals, ELs speak
different home languages, come from different backgrounds, and receive different types of linguistic instruction and supports during their time in the EL subgroup. Importantly, they also become ELs in the first place at different ages and with different levels of ELP. For all of these reasons, ELs spend different amounts of time in the EL subgroup; they also progress towards the goal of proficiency and reclassification at different rates, and they have different needs along the way. Despite this diversity, accountability reporting lumps all ELs together as one subgroup, differentiated only by grade-level. By ignoring other differences within the EL subgroup, current accountability models can mask the fact that the EL subgroup is a constantly shifting cohort, with students entering and exiting at different times, for different reasons, and having followed different journeys.
The study described in this paper will present some alternate approaches for grouping and tracking ELs over time. Using longitudinal data from a cohort of ELs in one state, it includes analyses designed to explore patterns in students’ progress, performance, and reclassification between grades 3 through 8 – critical years for accountability testing and reporting. Over this important period, I focus on students’ probability of being reclassified as a function of different time-based groupings; I also will investigate interactions such as the effect of student-level characteristics on the length or trajectory of the journey to reclassification, or how a student’s relative position within his or her journey may affect his progress or performance.
First, however, I provide more background and context about how ELs are educated and assessed in US schools. As these opening paragraphs suggest, this context is complex, and unique to this particular subgroup; it is, however, important for readers to understand this context for the analyses that follow to have meaning and value.
Accordingly, the next two sections will provide more detail regarding (1) how ELs are identified, served, and reclassified, (2) the many ways that ELs can be both differentiated from one another, and grouped together.
1.1.1. The EL Lifecycle in US K-12 Settings
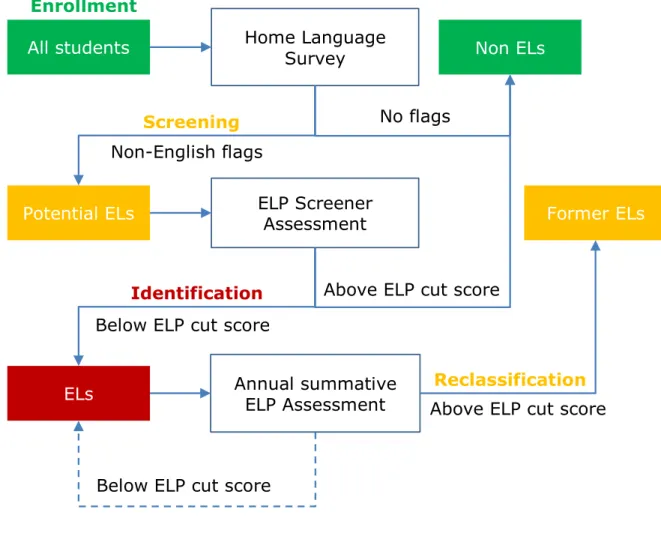
Keeping in mind that there are many within- and across-state variations, the typical process by which ELs are identified, served, assessed, and reclassified is illustrated in Figure 1.1, and is discussed subsequently.
Students are initially identified as ELs via the school enrollment process. Most schools administer a home language survey (HLS) to new families to collect information about students’ language background. If a student’s HLS suggests that s/he uses or is exposed to non-English languages at home, he or she is referred to take a so-called “screener” assessment of ELP. The purpose of this screener is to determine whether the student’s language skills are likely to affect his or her ability to learn, to meet academic performance standards, or to “participate fully in society” when English is used. Students who demonstrate proficiency on this screener assessment are released back into the mainstream student population as initially fluent English proficient (IFEP) students, while students who score below their state’s proficiency threshold are labeled as ELs and referred for services.
The way ELs are served in the period between their identification and
reclassification is a matter of district- or school-level discretion, though some states have passed laws mandating or prohibiting particular types of instructional programs (Parrish et al., 2006; Smith, Coggins, & Cardoso, 2008). There is also specific federal guidance prohibiting the segregation of ELs into dead-end or sub-par programming based on their
categorized as either English-only or bilingual, where a language other than English is also used for some instruction in the latter case (Genesee, 1999). Families also may refuse the offer of language services for their child, though districts still face a legal responsibility to ensure that all ELs, including those not receiving specialized services, have equal access to the same educational opportunities offered to all students. Under the two most recent reauthorizations of the Elementary and Secondary Education Act
(ESEA), they are also still responsible for ensuring that these students meet the state’s performance standards in ELA, mathematics, and science.
However they are served, all ELs, as mentioned previously, are expected to transition out of the EL subgroup (i.e., be reclassified) eventually. Thus, starting in the year they are identified, all K-12 ELs are assessed annually in ELP, to track students’ progress towards proficiency and determine whether they are ready to be reclassified. Reclassification process models will be described in more detail in the literature review, but typically, students must meet a certain performance standard on the state ELP assessment to be considered for reclassification. Reclassified students are often referred to as reclassified fluent English proficient (RFEP).
It is important to note that the use of statewide summative ELP assessments was new in the era of No Child Left Behind (NCLB). Prior to NCLB, states typically did not have standardized or coordinated systems for defining ELP or deciding when ELs had achieved it; states or districts that did opt to use ELP assessments did so at their own discretion, and were not subject to federal regulation or monitoring. NCLB introduced, for the first time, mandated systems of statewide standards, assessments, and
Today, all states have articulated K-12 standards for ELP, which inform the assessment content and cut scores that guide the reclassification process3. The ELP
standards are required to be “aligned” to the state’s academic content standards, in the sense that they represent the linguistic content and uses found in academic classrooms and on academic assessments. (Notably, ELP experts have advocated for using the term “correspondence” to describe this relationship, since it differs in nature from the more typical “alignment” relationship between standards and assessments of those standards.) Similarly, the cut scores and performance standards on the state ELP assessment are expected to be set so that a proficient performance signals mastery of the types of language a student would need to meet their state’s academic content and performance standards.
As the final step of the EL lifecycle, the law also requires that RFEP students be monitored for two years after they are reclassified, to ensure that the reclassification decision is serving the student’s best interests. Again, the content and nature of this monitoring process varies from school to school; in some settings, students may continue to receive minor instructional supports or accommodations, and may also continue to participate in the statewide ELP assessment. In others, monitoring may only consist of teachers checking students’ academic performance at the end of the year. Regardless, federal guidance allows states to include monitored RFEP students as part of the EL subgroup for academic accountability reporting purposes; many states follow this option, since RFEP students are likely to earn higher scores on academic assessments, thereby
3 Note that in the context of ELP, “content standards” refer to linguistic and communication skills and
helping to pull up the average performance of the EL subgroup. A student who makes it through his monitoring period without being referred back for more service will then exit the EL subgroup entirely, and cease to be included in its numbers for any further
reporting.
Although the monitoring period marks the end of the federally mandated EL lifecycle, a student’s ever having been an EL may remain a characteristic of interest for policymakers, researchers, and educators alike. While it is important to track ELs’ achievement up to and including their point of reclassification, their performance after this point – even when they are no longer considered part of the special population – provides important evidence and feedback about the adequacy of their preparation and the reclassification standards and policies. Accordingly, a 2010 working group
specifically highlighted the importance of tracking the academic achievement of ELs throughout their academic careers (not just during their time as ELs), as their post-reclassification achievement may be one of the most important indicators of language program quality, or equity within the school system (Working Group on ELL Policy, 2010).
One final critical point about the EL lifecycle is the complete absence of standardization across, and even within some states (see, e.g., Bailey & Kelly, 2013; Linquanti & Bailey, 2014; Linquanti & Cook, 2015; Mahoney & MacSwan, 2005; Ragan & Lesaux, 2006). Although the federal government mandates identification, service, assessment, reclassification, and monitoring, it does not go so far as to tell states how
they must achieve these requirements4. As a result, every step, process, instrument, criterion, and timeline in the cycle is open-ended and subject to interpretation.
Particularly since NCLB marked the first time that states became involved as enforcers with respect to EL policies, many states opted to grant districts and schools considerable freedom and discretion to define and implement their own systems. In practice, this has meant that ELs who move across and even within states often will find themselves subject to different service systems with different criteria; as a result, such students might find themselves abruptly moved from one stage in the lifecycle to another, as a function only of geography or policy. This also means that ELs – at least those who move at some point in their K-12 lifetime – do not necessarily follow linear paths through the EL
lifecycle, and may skip or repeat phases based on policy differences in their new schools. 1.1.2. Different Ways of Grouping ELs
All ELs follow some version of the life cycle described in the previous section, but it is important to also recognize the diversity of the students who become members of this group. While all ELs share the label of their subgroup – and, by extension, have been identified as needing help to reach an acceptable level of ELP – they also differ from one another in some important ways. First, as referenced in the introduction, ELs speak different home languages, have different household and demographic backgrounds, and receive different types of services to support their English development over time.
More importantly, however, are the ways in which ELs differ substantively, in terms of their ELP status and growth. It is not uncommon to see or think of terms like
4 Although NCLB does not include specifics about EL services, other federal documents such as
“beginner” or “advanced” to describe EL students, but it is important to disentangle three related concepts that these terms can reference: namely, a student’s (1) grade-level, (2) level of ELP, and (3) time since identification. In particular, one might expect to find differences in progress and performance among:
1. Younger vs. older ELs, who differ from one another in terms of their age and grade-level;
2. Newer vs. long-term ELs, who differ from one another in terms of how long they have spent in the EL subgroup; and
3. Beginner vs. advanced ELs, who differ from one another in terms of their level of English proficiency.
It is important to recognize that students who are similar in one of these traits may be very different on another – for instance, two third grade ELs might have very different levels of ELP, or two intermediate ELs may be in different grade-levels, or have spent very different amounts of time in the EL subgroup. Not all newly identified ELs are young, or are beginners, and not all beginners are young, or are newly identified.
These differences are relevant because, although all three of these dimensions matter for interpreting a student’s performance and needs, accountability reporting only takes one of them into account: grade-levels. Thus, as both individuals and a group, ELs’ performance in all areas – ELP, ELA, and mathematics – is defined, measured, and reported based on expectations for that student’s grade-level. Similarly, their progress over the past year or expected progress for the future do not take into account their current level of ELP or how long they have been an EL. This means, by extension, that when states or researchers use accountability data to study how long ELs take to reach
proficiency, or how their ELs are performing in academic content areas, or whether language affects content performance, they are usually studying ELs who have been grouped together based on their grade-levels, without accounting for these other ELP-relevant factors. One of the central premises of this study is that grouping ELs in this way, while expedient, may mask or distort important information about these students’ progress, performance, and needs.
1.2. Statement of the Problem
The present study sits at the intersection of the topics that have been summarized thus far: the EL lifecycle, reclassification, and different ways of grouping ELs to create relevant subgroups within the population. To date, while numerous studies have
evaluated reclassification rates and covariates that affect them, none have systematically compared the outcomes or interpretations associated with different ways of grouping ELs. In other words, studies group students by either their time in the EL subgroup, or their grade-levels, or their ELP, but few have asked the question which of these groupings is more useful or informative for decision-making.
In addition, while a great deal of research has been conducted in the past few years about reclassification and longitudinal growth for ELs, most of the best-designed studies have used cohorts that start in kindergarten. Coincidentally, kindergarten is the one point at which a student’s grade and time in the subgroup are more or less conflated, meaning the beginning of a student’s EL status maps directly onto the beginning of their schooling. Such cohorts are excellent for developing a baseline sense of the amount of time it takes students to be reclassified, and the trajectories they follow to get there. Their generalizability is somewhat limited, however, because not all ELs begin in kindergarten.
For students who do not begin “at the beginning,” we might expect to see different developmental patterns; or, at least, we should ask whether the same patterns hold. For example, as I will discuss in the literature review, some studies have developed estimates of the average amount of time it takes students to achieve English language proficiency; others have identified certain schooling moments (e.g., the transition from elementary to middle school) as critical moments for transition. It seems worth asking: to what extent are such findings conditional on students’ having started in kindergarten, and to what extent are they generalizable to ELs who join the subgroup later? What
milestones and patterns might we observe for students who become ELs in grade 2 or grade 3? Do they tend to follow parallel, but delayed, trajectories, or do we see entirely different patterns and milestones for these students?
1.3.Significance of the Problem
Reclassification is a critically important moment in an EL student’s career, as it directly affects his or her access to appropriate instruction and, by extension, his or her later academic achievement. As such, reclassification standards should be set carefully to ensure they are maximally beneficial to students, and evaluated regularly to ensure that students on both sides of the divide – meaning, those who are retained, and those who are reclassified – are served well by the outcomes of the reclassification criteria.
Evaluating reclassification criteria requires exploring two families of questions. First, which students meet the threshold, when do they reach it, and what factors affect their probability or timing of doing so? Secondly, for students who do reach the
reclassification threshold, do we see evidence that they are well-prepared for the
sets of questions are critically important to EL success and reclassification validity; this paper will focus primarily on the former, however.
1.4.Purpose of the Study
The purpose of the current study is to explore reclassification patterns in a
longitudinal panel of ELs from one state. It is guided by the following research questions: 1. What is the probability of reclassification over time for a cohort of ELs progressing
from grade 3 to grade 8?
a. When are third grade ELs most likely to be reclassified?
b. Does the probability of reclassification vary by either grade-level, amount of time in the EL subgroup, or both?
2. Are students who have been in the EL subgroup for a long time (>5 years) more or less likely to be reclassified than more recently identified students?
3. What factors affect the probability of reclassification for students in the same grade-level, or who have been ELs for the same amount of time?
Figure 1.1 Identification and reclassification lifecycle for an English learner
All students Home Language Survey
ELP Screener Assessment Annual summative ELP Assessment Non ELs No flags Potential ELs Non-English flags
Above ELP cut score
ELs
Below ELP cut score
Former ELs
Above ELP cut score
Below ELP cut score
Reclassification Enrollment
Identification
Screening
Figure 1. Identification and Reclassification Lifecycle for an English
learner
CHAPTER 2 LITERATURE REVIEW
This chapter will build on the first by summarizing research on the major topics that have been discussed thus far, as well as on the quantitative methods that will be used in this study. I begin with a brief summary of current thinking about how reclassification should be defined and approached, followed by a summary of research on how different ways of defining ELP may affect who gets reclassified. Since reclassification is supposed to occur when language no longer exerts undue influence on students’ academic
achievement, this is followed by a brief summary of research on how language and content performance relate for ELs generally, and subgroups of EL in particular, based on factors such as their grade-level and level of ELP.
Next, I discuss how research about reclassification has evolved over the past 15 years in terms of methods, data structuring, and interpretations. I argue that the field has experienced something of a learning curve since NCLB’s implementation in
understanding how research of ELs’ performance can best be designed to produce valid and useful results. Having addressed this, I then use the final section to summarize literature about progress and performance leading up to reclassification, including factors affecting the likelihood of reclassification. Taken together, the topics reviewed in this chapter should set the stage for the methods I propose for this study, in chapter 3. 2.1.What is the Overall Purpose of the EL Classification System?
Lau v. Nichols was a 1974 Supreme Court case in which Chinese-American students in San Francisco sued their district based on its language policies. Their central complaint was that the district required students to be proficient in English to graduate,
Delivering the Supreme Court’s opinion in the case, which the students won, Justice William O. Douglas wrote,
there is no equality of treatment merely by providing students with the same facilities, textbooks, teachers, and curriculum; for students who do not understand English are effectively foreclosed from any meaningful education.
(Lau v. Nichols, 1974, p. 566)
This court decision, which was decided based on Title VI of the Civil Rights Act of 1964, persists as the foundation for contemporary EL education policy. As Douglas’ wording suggests, the primary concern for ELs is essentially to prevent such educational
“foreclosures,” and ensure that they are not excluded from educational opportunities on the basis of their linguistic proficiency. Because language has been established by courts as a proxy for national origin, excluding ELs based on their linguistic proficiency would amount to a violation of these students’ civil rights – Title VI specifically prohibits exclusion on the basis of “race, color, or national origin” (The Civil Rights Act of 1964. Pub. L. 88-352, 1964)
NCLB defines ELs as students
whose difficulties in speaking, reading, writing, or understanding the English language may be sufficient to deny the individual the ability to meet the State’s proficient level of achievement on State assessments described in section 1111(b)(3); the ability to successfully achieve in classrooms where the language of instruction is English, or the
opportunity to participate fully in society. §9101(25)(D)
Echoing the Lau language, the NCLB definition also makes an explicit link between language, inclusion, and opportunity to learn (or perform). Thus, as mentioned in the first chapter, the purpose of the EL identification and reclassification system as a whole is to identify students whose language skills threaten to exclude them from the curriculum, neutralize that threat through effective language instruction, and then remove the EL
label so that the student can participate in “regular” educational settings as a “normal” student.
This legal context is important for understanding reclassification, because it also provides the foundation for how to determine when a student should not be considered an English learner: specifically, when it can be shown that a student’s opportunities to learn or demonstrate academic proficiency are not compromised by their linguistic proficiency. The challenge, of course, is accurately judging when this criterion has been reached. As the varied performance of native speakers shows, even students with full linguistic access to instruction may yet fail to meet the academic standards set for them. Thus, one of the trickiest aspects of reclassification is figuring out how to isolate the role of language, specifically, in students’ performance.
In the next two sections, I discuss two specific aspects of this challenge. The first is defining linguistic proficiency, both conceptually, and in terms of how it should be scored and reported from a test. Because language is a mutli-faceted construct involving skills in numerous semi-distinct domains (e.g., speaking, writing, comprehension, etc.), it can be measured, scored, and reported in multiple ways. The way domains are combined and weighted to represent proficiency, however, affects which students are deemed proficient and eligible for reclassification. The second aspect is how relationships
between language and content should be considered in making reclassification decisions. It seems intuitive that content performance should be considered somehow, since a lack of access to content is part of the EL definition. Different ways of incorporating it, however, also affect which students are reclassified, as well as the reasons for which students may remain ELs over time.
2.2.How Should ELP Be Defined and Measured?
Based on the phrasing of NCLB, states report anywhere from two to nine different scores from their ELP assessments. Currently, the most common model (used in 42 states) is to report separate scores for the four domains of reading, writing, listening, and speaking, plus a composite comprehension score (a combination of listening and reading) and overall proficiency (a combination, sometimes weighted, of all four domains)
(Faulkner-Bond, Shin, Wang, Zenisky, & Moyer, 2013). Although states may report all of these scores to students and teachers, they may use only some for the specific purpose of ELP standard-setting and reclassification. Thus, the first decision a state must make in designing a reclassification process is which ELP measures to consider for
reclassification, and how to combine them.
One option is to combine all ELP subscores into one overall proficiency score, and use this score as the sole indicator of students’ ELP. The use of an overall score represents a compensatory approach, which is premised on the idea that relative weaknesses in certain language domains can be tolerated if they are complemented by strengths in other language domains. If this does not seem believable (conceptually, or in practice), states also may choose to make the overall proficiency score a weighted
average of the four domains, with certain domains given more weight if they are shown or believed to be more important for academic success. In Texas, for example, 75 percent of a student’s overall ELP level is based on their performance on the state’s ELP reading test (Texas Education Agency & Pearson, 2012). One advantage of the compensatory approach is that the overall score is based on the most items and is thus the most reliable
score from a decision consistency standpoint. In other words, there is less of a chance that students might be classified differently if they were to retest.
The next step along this continuum is what Carroll and Bailey (2015) refer to as a combination decision rule, where students who meet an overall ELP standard also must score above certain minima in each domain to be reclassified – e.g., a student must have an overall ELP level of “proficient” and not score in the lowest performance level for any language domain. Or, finally, if it is believed or shown that students need to demonstrate mastery in all domains to be truly proficient, states may use a conjunctive decision rule, where students must earn proficient scores on all ELP subtests to be eligible for
reclassification. A drawback to combination and conjunctive models is that they require making decisions based on subtests that may be relatively short (e.g., 15 to 20 items). Since test length directly affects reliability and standard errors of measurement, there is a higher chance that students might hit or miss a cut score due to random error, rather than actual linguistic proficiency (or a lack thereof). This fact can blur the distinction between students who are and aren’t reclassified – that is, students who are more or less
indistinguishable in their performance may end up on either side of the cut score, simply due to measurement error.
Although standard setting panels may consider the practical impact of different proficiency models when making their final decisions, there are few published studies that have directly compared the impact of different proficiency definitions on student outcomes and performance. In a descriptive study of 875 ELs and 92 non-ELs in grade 5, Carroll and Bailey (2015) illustrated how decision rules can lead to sizable differences in the number and proportion of EL students who are recommended for reclassification. In
particular, they found that conjunctive rules that impose minimum performance
requirements for all subtests (e.g., students must meet a cut score on all domain subtests) tend to identify the most students as non-proficient, whereas compensatory models that focus only on the overall proficiency score identify the fewest non-proficient students.
Some studies with California data have also evaluated which scores tend to be the limiting factor for students’ transitioning at different points in time. California uses a complex model, where students must meet three separate criteria: (1) an overall ELP score in the state’s performance level 4 (out of 5), (2) scores that are not below level 3 (out of 5) on each domain subtest, and (3) performance in at least level 2 (out of 4) for the state’s ELA assessment. In a longitudinal study of over 200,000 ELs from the Los
Angeles Unified School District (LAUSD), Thompson (2012) found that the ELP reading subtest was the most likely barrier to reclassification for her students up through grade 5, after which the ELA content assessment became the limiting score. Robinson (2011) reached a similar conclusion in a study of 39,736 California ELs (all from one unnamed district), where he also observed that the ELP reading score held back the largest
proportion of potentially eligible students in fourth, fifth and sixth grade (between 30 and 40 percent of students), but the ELA assessment limited between 40 and 50 percent of eligible students for grades 7 through 10. Umansky and Reardon (2014) also observed that the ELA content assessment became the limiting factor for reclassification starting in 6th grade in their study of 5,423 California ELs from one district.
Findings like these underscore the impact – intended or unintended – of using a conjunctive model compared to a compensatory one. For example, since neither
students, this suggests that, were California to use a compensatory model, as opposed to its conjunctive one, many more students would have been reclassified than under the current system. This is neither good nor bad per se, but does serve to illustrate how different ways of defining ELP can affect students’ time in the EL subgroup. These findings also point to the impact of incorporating content assessment scores into
reclassification decisions, in addition to ELP scores; I discuss this idea further in section 2.3.
2.3.How Should Reclassification Standards be Set?
Setting reclassification standards requires both defining ELP and deciding what type of evidence is necessary to determine that it has been achieved. Needless to say, it is both complicated and high-stakes, as it affects which students make it through, and how reclassified students go on to perform as RFEP students.
As a baseline, Wolf and Farnsworth (2013) stress the importance of establishing the validity of the ELP assessment itself, as reclassification can only be as fair and as valid as the scores that form its primary – or perhaps only – criterion. In particular, they emphasize the importance of (1) appropriately articulating the ELP construct in terms of the language knowledge and skills necessary for academic contexts, and (2) properly aligning ELP standards with ELP assessments, including establishing correspondence between ELP standards and academic standards. They recommend that states collect evidence to support the reliability, construct validity, and consequences of the ELP assessment’s use for reclassification purposes. They also encourage states to consider impact data for different standards and models to see how they affect the number of students who transition, how long students spend as ELs, how students who are
reclassified go on to perform, etc. In a study of ELs from various grade levels in three different states, Kim and Herman (2009) explored these types of questions by seeing what the predicted content score was at the reclassification cut point, and comparing this predicted value to the average performance of non-ELs.
Beyond the ELP assessment itself, states must decide which scores to use, both from the ELP assessment, and possibly from other sources. In some states, ELP and reclassification are essentially synonymous, while in others, achieving ELP is a trigger to look for further evidence to make a reclassification decision. Ragan and Lesaux (2006) studied the identification and reclassification criteria used in the 10 states and 10 districts with the largest EL enrollments (at the time), and found that eight of the ten states and five of eight districts considered additional criteria in exit decisions such as academic test scores, grades, or teacher or committee recommendation. Generally, some states, such as California and Massachusetts, recommend that districts consult other measures for students who have met the state’s ELP standard (California Department of Education, 2015; Massachusetts Department of Elementary and Secondary Education & DePascale, 2012), whereas others, such as Oregon, Arizona, and the state used for this study, rely solely on ELP scores, as a rule.
The use of additional scores can obviously affect reclassification rates, as suggested with the examples from California referenced in section 2.2. Or, to use an example from a different state, Carroll and Bailey (2015) illustrate that a stepwise decision process, in which ELP scores serve as the first indicator for reclassification considerations, can also limit which students have the opportunity to transition. In particular, they found that a proportion of ELs in their sample of 875 demonstrated
proficient or advanced performance on all of their state’s academic content assessments, but fell short of meeting ELPA performance criteria. Such students – whose numbers varied from 2 to 34 individuals, depending on the ELPA decision rule used – would not have been considered for reclassification in their state since ELPA scores are considered first. The authors suggest, in response, that states should consider both language and content performance simultaneously – rather than sequentially – to ensure that students who may be eligible for reclassification are not overlooked.
Cook, Linquanti, Chinen, and Jung (2012) propose a different solution, which is to examine the relationships between ELP scores and content scores, rather than the scores themselves. They specifically recommend that:
Researchers can define “English language proficient” as the point at which EL students’ academic content achievement assessed using English becomes less related to their ELP. That is, there is a point at which EL students have sufficient English language skills to adequately function in English on content assessments; accordingly, there should be observable decreases in the relationship between the two assessments. At or beyond this point is where the ELP performance standard might be
considered… (Cook et al., 2012, p. 8)
They propose three quantitative methods for empirically identifying this turning point using real data: decision consistency, logistic regression, and descriptive box plots. All three models require sorting or grouping ELs based on their level of ELP, and then plotting the language-content relationships for these different groups. For decision consistency, they plot the percentage of students scoring in the proficient range in both ELP and content for different levels of ELP, and recommend setting the cut score at or around the level of ELP that has the highest percentage of proficient-proficient
agreement. For logistic regression, they predict the probability of scoring in the proficient range on each content assessment, conditional on ELP score. They recommend setting the
cut score at the point where the probability of meeting the ELA standard is at or above chance (0.5). For the descriptive box plots, they recommend creating box plots of content performance for each ELP performance level, and setting the cut score at or around the ELP level that is closest to being centered on the content performance cut score (i.e., half the students in the ELP level score above the content cut, and half score below).
Cook et al. (2012) illustrate all three of their methods using two-year data samples for grades 4, 7, or 10 from three different states (n-sizes ranged from 1,120 to 2,563 depending on the grade-level and state). Among other things, their illustration
demonstrates both that the predicted point of divergence does occur in all samples, and, equally important, that its placement varies from state to state and level to grade-level based on factors such as the state’s ELP standards, content standards, and the linguistic complexity of the test forms themselves. They also note that their design is premised on the fact that academic content cut scores are typically non-negotiable when ELP cut scores are set; thus, the resulting cut scores should be considered to maximize desirable outcomes conditional on academic content scores. Were both cuts being set concurrently, it is possible that both could be placed more optimally.
Having set standards for ELP and reclassification, the next step for any state or policymaker is to collect evidence for the validity of this standard. In this context, three particularly important validity considerations are (1) which students meet this standard, (2) how long it takes them to get there, on average, and (3) how they fare after they have met it and transitioned out of the EL subgroup. Due to the scope of the current study, only (1) and (2) will be discussed in depth, in the final section of this literature review.
First, however, I pause briefly to discuss some methodological considerations for how reclassification should be studied at all.
2.4.How Should Reclassification Be Studied?
In general, because of its mandates about standardized ELP assessment and disaggregated reporting, NCLB has played a major role in shaping research about ELs in the 21st century. In addition to codifying reclassification as a formalized event, NCLB’s mandates also forced states to pay attention to ELs’ progress and performance, and ensured that certain information about these students would be included in state-level datasets. In the fifteen years during which NCLB was law, research on these students proliferated (and continues to, despite a new ESEA reauthorization in December 2015). Over the same period, however, many experts came to recognize exactly how complex and difficult it can be to come up with appropriate designs and methods to get good, meaningful information about ELs’ performance and progress. Thus, the research of the past fifteen years also represents something of a learning curve for the field, as
researchers have refined their thinking about how to validly structure their EL data, apply their models, and interpret their findings.
Choosing valid research designs to study reclassification can be surprisingly tricky, because of the way the EL subgroup works. Even before NCLB, Linquanti (2001) identified an important “redesignation dilemma,” which is that high achieving ELs are more likely to be reclassified, while struggling ELs are more likely to stay in the subgroup. This dynamic, while obvious, can distort the data, particularly since
accountability data are primarily cross-sectional in nature, and do not track individual students over time. At the group level, this dynamic will make it consistently appear that
reclassified ELs do very well, which suggests that the EL programs and reclassification are functioning well and preparing students to succeed upon exiting. What it masks, however, is the fact that the same lower achieving ELs are remaining in the EL subgroup year after year without exiting. Thus, rather than each student making steady progress towards English proficiency, higher-achieving students are passing through and leaving these “long-term ELs” behind (Menken, Kleyn, & Chae, 2012; Olsen, 2010). This suggests, by contrast, that the programming is actually not working, precisely for the students who need the most help.
The primary implication of this dynamic is that typical accountability data, which groups ELs only by grade, is not enough on its own to give an accurate picture of ELs’ progress. A cross-sectional sample of third grade ELs, for example, might include students who have been ELs for 5 years, three years, and one year, and who have low, medium, and near-fluent levels of English proficiency. Substantively, it matters which of these students make progress or exit the subgroup. In particular, if students who have already received years of instruction are not likely to exit, this suggests that something is not working in either the instruction, the reclassification standard, or both.
A related secondary challenge in measuring ELs’ language development longitudinally is identifying the appropriate outcome measure for such studies. Since ELPA participation ceases within two years of being reclassified, and since
reclassification may occur at any grade-level after any length of time in the subgroup, there is no common outcome datum for all ELs, other than reclassification itself. Given, again, the way EL status functions, this event could occur at any grade-level, and may come at the end of a trajectory of many or few years spent taking the ELP assessment and
participating in language instruction. Those differences matter, for design and interpretation.
It took a few years for researchers to appreciate these dynamics in their data. In time, however, states and researchers learned that the time an EL had spent in the subgroup needed to be accounted for in their designs, and the field has converged
increasingly on a few appropriate methods for these purposes. First, descriptive analyses of state data are actually somewhat common, as they can effectively provide a portrait of who is transitioning, when, and after how long, even if they cannot answer questions about what factors predict reclassification. The remaining two sections include several studies that are based solely on descriptive analyses of state datasets (American Institutes for Research, 2013; Carroll & Bailey, 2015; Grissom, 2004; Massachusetts Department of Elementary and Secondary Education & DePascale, 2012).
Second, discrete-time survival analysis (also referred to as event-history modeling) has increasingly been used to study the time it takes for students to be reclassified. The primary advantage of survival analysis is its capacity to model
censorship within a dataset – that is, to account for and model the fact that some subjects may not achieve the intended outcome within an observation period. In the context of reclassification, it can acknowledge that there is a difference between an EL who has been in the subgroup for 8 years and then is reclassified, and one who has been in the subgroup for 8 years and still has not been reclassified when the observation period of a study ends. Survival analysis also uses as its outcome the probability (referred to as the hazard) that a particular outcome will or will not happen for a given subject. Because the probability is the outcome, this solves the aforementioned problem of needing an
outcome variable to predict in these longitudinal studies. At least five studies to date have used survival analysis to study reclassification in the EL K-12 context, all of which will be discussed in the final literature review section (Cook et al., 2012; Parrish et al., 2006; Slama, 2014; Thompson, 2012; Umansky & Reardon, 2014).
2.5.Previous Studies of Reclassification: Who Gets Reclassified, and When? Studies of reclassification typically focus on questions like how long it takes students to reach their state’s reclassification threshold, the proportion or likelihood of students transitioning in any given year, and factors that affect a student’s likelihood of being reclassified. Some studies have explored such questions descriptively, by simply looking at the proportion of students who are reclassified each year.
The Massachusetts Department of Elementary and Secondary Education
(MDESE), for example, conducted a number of descriptive analyses of over 225,000 K-12 ELs who enrolled in the state’s public education system between 2002 and 2011 (Massachusetts Department of Elementary and Secondary Education & DePascale, 2012). They found that the proportion of students transitioning in each grade increased steadily from 10.1 percent in grade 1 up to a peak of 23 percent in grade 5, before decreasing again through middle and high school, save for one slight surge in grade 9. The highest transition rates occurred in grades 4 through 8. They also found that students spent 3.5 years as ELs, on average, with an interquartile range of 2 to 5 years. Contrary to most other studies discussed here – and possibly owing to regional differences in EL populations between Massachusetts compared to states like California – they found that Hispanic students (who are generally assumed to be Spanish speakers) spent less time as
ELs, on average, compared to speakers of other languages (2.3 years, compared to 3.9 years for non-Hispanic students).
The American Institutes for Research (AIR) conducted descriptive analyses of ELs from Oregon over a three-year observation period from 2009 to 2012 (American Institutes for Research, 2013). Their sample included 39,575 ELs who were in grades K-10 in the first data year and had complete data for the three-year period, either because they transitioned or because they remained ELs and had three years of test scores for analysis. AIR focused on students’ two- and three-year performance level patterns and calculated the percentage of students who followed various paths such as earning the same performance level in consecutive years, or exiting after earning a particular
performance level in the previous year. They observed that between a third and a half of students at each performance level scored in the same level in consecutive years – for example, 46 percent of students scoring in Level 2 in 2009-10 scored in the same level again in 2010-11. This tendency was most pronounced for younger students in grades K-2. On the other hand, across all grades, 51 percent of students who scored in the second highest performance level (Level 4) in the first year went on to score in Level 5 in the next year, making them eligible for reclassification. These findings suggest that, in Oregon at least, students may take two years to progress through each performance level, at least until they reach Level 4.
In agreement with several other studies that are summarized in this section, AIR (2013) also found that late elementary school seemed to be a popular transition point for ELs. They observed that, compared to other grades and test forms, a higher percentage of students who took the grade 3-5 ELP test form were reclassified the next year, across all
performance levels. For example, although very few students who scored in Level 2 one year were reclassified the next year, this unusual pattern was more common for grade 3-5 students compared to other grades (9 percent of grade 3-5 students, compared to, for example, 5 percent of grade 6-8 students).
Grissom (2004) calculated the probability of reclassification over time for California ELs from grades 2 through 5 using three cohorts of data from 1998 through 2003 (pre-NCLB, notably). His cohorts ranged in size from approximately 58,000 ELs in the 1998 cohort to just under 79,000 in the 2000 cohort. In all three cohorts, he observed that less than a third of students had been reclassified by grade 5. Grissom did not have data on when the students in his cohorts were initially identified as ELs, so the most conservative reading of his findings is to consider grade 2 (his first year of data) as students’ first year as ELs. By this estimate, grade 5 represents their fourth year in the EL subgroup, at least; if students were identified earlier than grade 2 (which many probably were), grade 5 could represent five or six years of EL status. Notably, Grissom’s findings clash with several other studies described in this section, which found that fifth grade was often a peak reclassification year for ELs both within and beyond California. Consistent with some other studies, however, he found that slightly more girls transitioned each year than boys, that Spanish speakers were less likely to transition than speakers of other languages, and that lower-income students – identified based on their eligibility for free or reduced-price lunches (FRL) through the National School Lunch Program (NSLP) – were less likely to transition than non-eligible students.
While descriptive analyses of reclassification rates can provide a general sense of how likely reclassification is for certain groups of students, they are limited in their
generalizability and predictive value. As referenced in the preceding section, event history or survival analysis has become a go-to method for studies of this type. One of its strengths is the articulation of a set of continuous functions to describe the relationships among covariates and predictors for reclassification over time – these are known as the survival function and the hazard function (see section 3.2.1 for a more detailed discussion of these functions). These functions allow for stronger interpretations and comparisons, and can be useful to make predictions and evaluate possible outcomes. Several studies using this design are described next, and are also summarized in Table 2.1.
One of the earliest survival analysis studies of reclassification was by Parrish et al. (2006), in an evaluation study of a California law, Proposition 227 (Prop 227). Passed in 1998, Prop 227 is a controversial law that essentially mandated English-only
instruction for ELs, and also set the expectation that ELs should be reclassified after one year. Among many analyses conducted to evaluate the law’s effects, these authors used survival analysis to determine how many students were meeting the law’s one-year expectation for reclassification. Although the methods are not spelled out in great detail, it appears that the authors used cross-sectional statewide California data for the 2002-03 school year (approximately 1.5 million ELs, though the exact number is not reported in the technical appendices), and grouped students according to the number of years they had been identified as ELs in US schools. Thus, the groups contained all ELs in grades K-12 who had been in the subgroup for one year, two years, three years, etc. The results of the survival analysis therefore represent the proportion of students who are reclassified after increasing numbers of years in the EL subgroup, regardless of their grade-level. For example, the Year 4 estimate would represent the proportion of students who were
reclassified after spending four years as ELs, regardless of what grade-level they were in on identification or reclassification.
They found that only 12 percent of students were reclassified after three years of instruction, and fewer than 40 percent had been reclassified after ten years of instruction. They acknowledge that their method of grouping students is somewhat imprecise,
particularly since they could not differentiate between the number of years students had been ELs at all and the number of years they had been ELs in California, specifically – for the purpose of evaluating Prop 227, this would be an important distinction. Their estimates are lower than those found in other studies described here, but those differences could stem from the study’s cross-sectional design, or the fact that the data came from very early in NCLB’s passage. If nothing else, their findings certainly demonstrate that Prop 227’s expectation for reclassification after one year of instruction is unrealistic.
In the same report described above about studying relationships between ELP and content performance (see section 2.3), Cook et al. (2012) also conducted event history analysis using K-5 data from one state. These authors grouped their sample of 23,668 students by test form (K-2 or 3-5) and initial ELP (Level 1, 2, or 3) and then calculated reclassification rates over the next four years. Because of their grouping, this entailed calculating separate survival functions for six different groups: Students who took the K-2 form and scored in ELP Level 1 on their first administration; students who took the K-K-2 form and scored in ELP Level 2 on their first administration; students who took the 3-5 form and scored in ELP Level 1 on their first administration, and so on. Each group ranged in size from just under 10,000 (n = 9,328 for students in the K-2 group who