Author: Marta Reina Campos
Facultat de F´ısica, Universitat de Barcelona, Diagonal 645, 08028 Barcelona, Spain.∗ Advisor: Jordi Torra
(Dated: June 3, 2015)
Abstract: The main goal is to develop efficient tools to help validating the data received daily from the Gaia satellite. In order to do so, we study the main data processes and their outputs and build three different tools calledExtendedStats,FlIdtValidation andAutoAlarms.
I. THE GAIA MISSION
The Gaia satellite was launched from the French Guiana on December 19, 2013. It is a mission of the European Space Agency (ESA) which aims to determine the position, proper motions and parallaxes of more than one billion stars and other objects with unprecedented accuracy, as well as their photometry and spectroscopy. Currently, the satellite is orbiting the second Lagrange point L2 (placed 1.5 million kilometers from the Earth in the anti-Sun direction and co-rotating with the Earth around the Sun) and has been in nominal operations since July 2014. At the end of the mission, around 2022, the most accurate 3D map of our galaxy is expected.
II. DATA PROCESSING
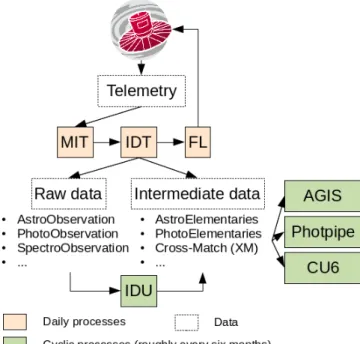
As it is represented in Fig. 1, once the data is down-loaded from the spacecraft, it goes through a series of three daily data processes called Mission Operations Cen-ter (MOC) InCen-terface Task (MIT), Initial Data Treatment (IDT) and First Look (FL). The MOC Interface Task re-ceives RAPID files from the MOC and sends them as PacketGroups to IDT. The Initial Data Treatment re-orders the telemetry data into tables (called xxxxObser-vation[8]) and generates preliminary astrometric, photo-metric and spectroscopic data for all the sources detected as well as an initial determination of the attitude of the satellite. All the data is stored in a database, and the raw and the intermediate data are used in First Look to monitor almost in real-time the on-board detectors and see if any correction on them is necessary.
After these three processes, all the data is stored into the main database. Every six months during the length of the mission, an iterative process called IDU uses all the raw data up to that moment and the latest calibra-tions to recalculate all the parameters and redetermine the catalogue produced by IDT.
Several algorithms have been developed to extract all the physical information from the Gaia data: the As-trometric Global Iterative Solution (AGIS) will
deter-∗Electronic address: [email protected]
mine positions and velocities, the Photometric Pipeline (Photpipe) will determine the photometric solutions of the sources observed, and CU6 is a Coordination Unit (CU) working on the spectra and radial velocities.
FIG. 1: Scheme of the main processes used to create the as-trometric and photometric catalogue from the Gaia data. The coloured boxes represent different processes, being the colour an indication of how often they are performed, and the dashed boxes represent different types of data.
A. Initial Data Treatment (IDT)
The Initial Data Treatment runs three main tasks. The first one is to reconstruct and rearrange the raw data into tables so it can be used in the various CUs (called xxxxOb-servation). The second one is the initial determination of the astrometric and photometric parameters (stored in tables calledxxxxElementary[9]) as well as an initial de-termination of the attitude of the satellite (OGA1). This is the so called intermediate data which is later used in FL, AGIS and Photpipe. The third task is to create the catalogue by cross-matching the observations against an
on-ground source catalogue and producing a Match ta-ble, linking transits (detections) and sources, adding new sources when needed. The cross-match (XM) is triggered roughly once a day.
In order to keep track of the process and be able to identify each piece of data, different numerical identifica-tions are determined on this first stage of data processing. The first one, and most important, is determined from on-board data and it is calledtransitId. This identifica-tion is unique for each given detecidentifica-tion. The second one corresponds to which source of the catalogue the transit has been linked to (if it creates a new source then a new one is produced), and it is calledsourceId. And the third one codes the technical information of the IDT process used and it is called IDTsolutionId.
In every IDT job several tables are produced. Besides the tables containing the raw and intermediate data, spe-cially relevant are those tables containing the result of the cross-match and the result of the attitude and coor-dinates first computation (calledMatch,Oga1and Detec-tionRecordrespectively). The XM job links every transit to the adequate sources of the catalogue within a cer-tain radius and decides to which one the transit actually corresponds, so the Match table links all the identifiers associated to a detection: its transitId, the IDT solu-tionId and its designatedsourceId. TheOga1table con-tains a refined first on-ground determination made from the IOGA (Initial On-Ground Attitude) output, which is the initial attitude determination made by IDT from the raw attitude data from the satellite. The Detection-Record table contains the result of the first coordinates determination made by IDT (detections are identified by both itstransitId as well as its IDT solutionId).
B. First Look (FL)
The First Look system is a near real time monitoring system of the on-board instruments. It uses the raw and intermediate data to perform a statistical analysis on a daily basis and verify if a set of situations are happening or not. In the case where anything on the instruments is wrong, an urgent petition for a change is raised to the MOC. It is an important part of the data processing as it proposes changes that may avoid further errors.
Besides this monitoring, it also recomputes several pa-rameters of the transits processed in the last 24 hours by IDT, such as the coordinates and the attitude of the satellite (stored in tables called Oga2 and Prima-rySource/SecondarySource respectively). As a FL run does not always coincide with an IDT run, the repro-cessed data is associated with a solutionId which codes the version of FL software used among other technical data. This FL solutionId identifier is not the same one as that given by IDT, so a table called InputDataUsed is used to store which IDTsolutionId are used to com-pute a certain FL run and which FLsolutionId they have associated.
III. STATISTICAL ANALYSIS
The validation tools developed had to be optimized to work with huge amounts of data as they were designed to run over at least one IDT run, which contains around 22 hours of transits (about 40 million detections on aver-age). Because of the large volume of data, only statistical analysis can be performed on a daily basis.
The robust scatter estimator (RSE) is a dispersion es-timator described in [4] and [6] as
RSE= 0.390152∗(P90−P10)
whereP90 and P10 are the 90th and 10th percentiles
re-spectively, and the constant has been chosen to make RSE equal to the standard deviation for a Gaussian dis-tribution.
As it is discussed in [6], the median and the RSE are recommended as the robust estimators of the centre of an array of data and of the sample standard deviations respectively. Despite of this, the analysis included in the tools described here includes the determination of the minimum and the maximum, the computation of the mean and the median as central estimators, and the com-putation of the standard deviation and the RSE. It was decided to compute also the mean and the standard de-viation so their similarity to the median and RSE could be verified.
IV. VALIDATION TOOLS A. ExtendedStats
The first tool developed in this work,ExtendedStats, is the one most similar to what had already been devel-oped. It is implemented inside the IDT system and it is used off-line to verify that the data streaming, recep-tion and processing is being done correctly. This tool has been designed to perform a statistical analysis over all the transits processed on an IDT run and produces a set of histograms. It analyses all the parameters (both scientific and technical) included in the following tables: (i) Raw data: AstroObservation, PhotoObservationand
SpectroObservation
(ii) Intermediate data: AstroElementary and PhotoEle-mentary
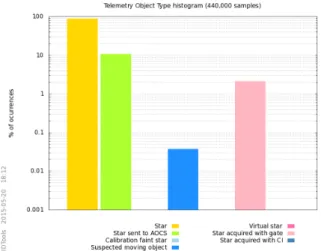
In Fig. 2 and 3 we show two examples of the his-tograms produced with this tool for every transit in an AstroObservation table with 440 thousand entries. The first one corresponds to a histogram of the object type flag, which is set on the satellite according to what the on-board software thinks a certain transit is. The sec-ond one correspsec-onds to a histogram of the flags raised on-board during the acquisition of the transits.
FIG. 2: Example of one of the plots produced by our Ex-tendedStatstool. It is a histogram of the Object Type flag (set on-board) for every transit in a 440000AstroObservation table.
FIG. 3: Example of one of the plots produced by our Extend-edStats tool. It is a histogram of the flags raised on-board during the acquisition of every transit in a 440000 AstroOb-servationtable.
B. FlIdtValidation
The FlIdtValidation tool was designed to compare the outputs from an IDT run against the outputs of the FL process. The FL algorithms are the first ones in the Gaia data processing able to reach microarcsecond-level astrometry, so we can use the FL outputs as a reliable reference against which we can check the quality of the IDT daily outputs. In order to do so, we implemented an algorithm to compare the coordinates and the attitudes computed by the two data processes.
The most difficult part of designing this tool was to decide which tables were needed and how to load them in an easy and quick way so that the program would not take too long to run. The final design for the data loading is represented in Fig. 4 and consists of the following
steps:
(i) Through the configuration of the program, we have to define the IDT solutionId refering to the cross-match (XM) of the run we want to study.
(ii) Using the IDT XM solutionId, the software loads theInputDataUsed, looks for all the FL solutionId
linked to the specified IDT XM solutionId and stores them in a list calledflSolIdList.
(iii) Using the listflSolIdList, the software loads all the entries from thePrimarySourceor SecondarySource table (corresponding to high priority or low priority transits) linked to the FLsolutionId in the list. (iv) It loads, from theMatchtable, all the transits with
the IDT XM solutionId and whose sourceIds ap-pear on thePrimarySource/SecondarySourcealready loaded. Only thetransitIds of the detections loaded are stored into a list calledtransitIdList.
(v) Using the list transitIdList, the software loads all the entries from the DetectionRecord table, and stores only thetransitId, the solutionId, the Gmag and the coordinatesαandδcomputed by IDT. (vi) It loads all the Oga1entries corresponding to that
IDT run interval time.
(vii) It loads all the Oga2 entries corresponding to all the FLsolutionIds.
FIG. 4: Scheme of the data selection and loading for our FlIdtValidation Tools. The green box represents the given IDT cross-match solutionId from which all the data is se-lected.
This tool has two different parts: the coordinates anal-ysis and the attitude comparison. The first one consists in a thorough analysis, transit by transit, of the coordi-nates determined by IDT and FL and requires as inputs thetransitId and thedetectionRecord, either the Prima-rySourceor theSecondarySource, and theOga1tables. It computes the deviation of the IDT coordinates using the
FL coordinates as the reference. Among other parame-ters, it computes the distance between the coordinates as d = |ρF Lb −ρIDTb |, where ρF Lb is the unit vector in spherical coordinates of the FL coordinates (the same for b
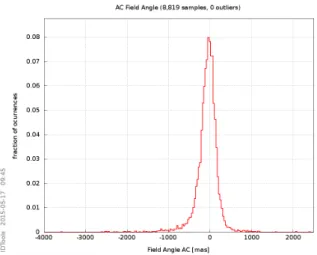
ρIDT), as well as the field angles AC and AL. The field angles are defined as the projection on the across-scan and the along-scan direction of the angle between the detection and a reference axis defined on the spacecraft. All the parameters computed are stored as histograms for an easier visual analysis. In Fig. 5 we present an ex-ample of the histograms produced for the field angles in the across and the along scan directions corresponding to the difference between the IDT and FL coordinates. It can be seen that the distributions are well centred in zero and the dispersion is rather small. Note that this analysis reveals that IDT is correctly determining the sky coor-dinates of most of the transits with a sub-miliarcsecond accuracy. Note, however, that some value can go up to -2500 mas (in the case of Fig. 5 (a)). All values should be contained inside the XM radius (rXM = 2 arcsec), so this out-of-range values indicate that something strange is happening.
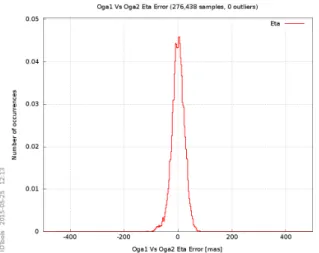
The attitude comparison uses the same algorithm as the one implemented in IDT and used to compare devi-ations between the raw attitude, IOGA, Oga1 and the Nominal Scanning Law (NSL), as described in [4]. It takes as inputs only Oga1 and Oga2 tables referring to the same Obmt (On-Board Mission Timeline) time inter-val, and stores as outputs histograms as a function of the number of occurrences and as a function of time of the rotation deviation of Eta, Zeta1 and Zeta2. These pa-rameters are the projection on the along and across scan directions (for field of view 1 and 2) of the attitude resid-uals and are obtained from comparing the difference of two quaternions, computed as the rotation of the three axes. In Fig. 6 there is an example of the histograms produced for the rotation deviation of Eta and Zeta1.
C. AutoAlarms
As described in [7], all the validation outputs from IDT are uploaded to a webpage called IDTMon so that anyone inside the Gaia project can access them and check how is the data reception and processing going.
Some of the validation outputs, such as the basic statis-tics, the attitude diagnostics or the cross-match monitor-ing, are daily revised by the ESAC and UB teams to see if there is something wrong. This is a time consuming process since it requires to check a lot of tables and plots in detail and to compare them with previous results to see if there has been any major variation. In order to do this evaluation easier, the AutoAlarms system has been designed to automatically check a series of predeter-mined parameters and to raise an alarm if any of them is not behaving like expected. This tool will be used daily in the last version of IDT that will be installed in ESAC in June 2015.
(a)Distribution of the field angle in the across scan direction corresponding to the difference between the IDT and FL coordinates in terms of the fraction of occurrences.
(b)Distribution of the field angle in the along scan direction corresponding to the difference between the IDT and FL coordinates in terms of the fraction of occurrences. FIG. 5: Example of two of the plots produced by our FlIdt-Validationtool on real data from Gaia.
TheAutoAlarmstool loads some of the files that are later used to build the IDTMon webpage and analyses certain parameters in them. The parameters analysed are both technical and scientific, such as how long do the jobs inside IDT take, or how many detections have been classified as spurious. The analysis can be done by comparing the value of the parameter against a reference defined in the program configuration, or by comparing it against the reference computed by previous results, or by comparing it against the other values for the same parameter (for example, to compare a value between the different CCD strips).
In the first case, the reference may be either a limit (upper or lower) or an absolute value and a certain tol-erance (which may be expressed as a percentage or as an absolute value). This case is useful for parameters that are expected to behave always in a certain way. In the second situation, the reference can be computed from
(a)Distribution of the rotation deviation of Eta in terms of the number of occurrences.
(b)Distribution of the rotation deviation of Zeta1 (field of view 1) in terms of the number of occurrences.
FIG. 6: Example of two of the plots produced by our FlIdt-Validationtool on real attitude data from Gaia.
the mean or the median of previous results (defining in the properties the method and the number of previous
results used), and the tolerance is defined through prop-erties. This is done for cases when the absolute value of reference may vary from one IDT run to another. Fi-nally, in the third case, a value is compared to the mean or the median of all the values for that parameter (as in the second case, the tolerance is defined through proper-ties). This last case is useful when trying to detect big variations of a parameter studied for different CCD rows. If in any of these cases a value does not fulfil the condi-tion, an alarm is set with an small explanation and stored into a log file, which will later be uploaded to the IDT-Mon webpage so anyone can see them and investigate why is it being set.
V. CONCLUSIONS
• My work has consisted in writing and testing the code for theExtendedStatsstarting from the Ba-sicStatstools, and on designing, writing and test-ing theFlIdtValidationandAutoAlarmstools. • Developing efficient tools to validate huge amounts of data is a crucial part for the development and operation of projects like Gaia.
• The work done has helped in the evaluation of the data during the commissioning as well as during the operational phase.
• The algorithms developed along this work have been included on the operational software and run on the IDT daily process.
Acknowledgments
I’d like to thank Dr. Torra for giving me the oppor-tunity to work in such a challenging group, as well as to Dr. Portell and Dr. Fabricius and their team for their patience and for letting me develop these projects on my own. I’d also like to thank my parents for all their sup-port.
[1] [CF-009] C. Fabricius, J. Torra, J. Portell, J. Casta˜neda and N. Blagor´dnova, Initial Data Treatment, Definition, GAIA-C3-TN-UB-CF-009-03(August 2010)
[2] [JP-051] J. Portell, C. Fabricius, U. Bastian, J. Torra, and W. Lffler,IDT Daily Operations and Concepts, GAIA-C3-TN-UB-JP-051-02(January 2014)
[3] [JC-001] J. Casta˜neda, J. Portell and C. Fabricius, Guide-lines and Implementation of the Intermediate Data Vali-dation (IDV),GAIA-C3-TN-UB-JC-001(December 2006) [4] [DBB-001] N. Garralda, J. Casta˜neda, J. Portell, C.
Fabri-cius, P. Vall´es and D. Batall´e,Description of the Interme-diate Data Validation tool, GAIA-C3-TN-UB-DBB-001-02
(March 2012)
[5] [LL-30] L. Lindegren,Attitude parametrization for Gaia, SAG-LL-30(July 2000)
[6] [HL-007] H. Lenhardt and U. Bastian,Collection of use-ful mathematical formulas for Gaia/DPAC, GAIA-C3-TN-ARI-HL-007-04(August 2011)
[7] [MRC-001] M. Reina, IDTMon User Software Manual, GAIA-C3-TN-UB-MRC-001-01(February 2015)
[8] More specifically: AstroObservation, PhotoObservation and SpectroObservation