3669-1
MANAGING CUSTOMER EXPERIENCE USING DATA ANALYTICS IN A PARTNERING VENTURE M. Roos1* & J. Bekker2
1Department of Industrial Engineering Stellenbosch University, South Africa
2 Department of Industrial Engineering Stellenbosch University, South Africa
ABSTRACT
Today’s technologies are changing the physical, digital and biological worlds. This change impacts the economy and how industries operate. In the light of this, we ask how these changes can be incorporated into customer experience. To investigate this, a demonstrator was developed in which a customer’s activities are simulated on a full-scale partnering platform while the business data are captured and analysed. The focus is on the domain of travel, in which customers use several modes of transportation while engaging with various collaborating enterprises. This paper will discuss the results and findings obtained, showing how customer experience can be managed and improved with the use of data analytics in a partnering venture.
1 The author was enrolled for an MEng (Industrial) degree in the Department of Industrial Engineering, Stellenbosch University, South Africa
3669-2 1. INTRODUCTION
Technology has been around since the seventeenth century and has played a fundamental role in the economic growth, productivity and welfare of countries [1, 2]. The past three industrial revolutions have demonstrated these changes. The first industrial revolution introduced mechanical production, the second brought about mass production and the third enabled automation by using computers. Today we are in the fourth industrial revolution in which the interaction between technologies impacts the physical, digital and biological worlds. These technologies include nanotechnology, artificial intelligence, quantum computing, gene sequencing,
etc.[3, 4]. But in this fourth industrial revolution, how does one manage and improve customer experience to increase revenue?
An example of how technology can be used to manage customer experience, is the Airbus A380 aircraft first class suite of Singapore Airlines. Some of its features include a seat that can rotate 360 degrees, a bed and a TV whose position can be changed depending on where you are positioned in the suite. The food is made according to the customer’s preferences and the Airbus A380 has an entertainment system that keeps a record of the customer’s choices [5, 6]. Another example of how technology can be used to manage a customer’s experience is the TripIt digital system in which a customer sends his or her flight, car rental, hotel and restaurant details and the system then creates a master itinerary from it. The system alerts the customer on a real-time basis on the progress of the trip [7, 8]. Digital systems similar to this are TripCase and WorldMate. These systems focus on managing a customer’s experience based on details provided by the customer, but it does not provide insights from it in order to improve a customer’s experience.
Therefore, the aim of the study is to determine how data analytics can be used on a cross-functional business partnering platform in order to increase and manage a customer’s experience. This study forms part of a mutual, ongoing research project done by the Unit for System Modelling and Analysis (USMA) in the Industrial Engineering Department of Stellenbosch University. For this study, a capability demonstrator will be developed, known as the Trip Planner. The Trip Planner will act as a digital information and support system in order to demonstrate how to manage and improve a customer’s experience with the use of data analytics and business partnering. It will plan a trip for a customer based on a departure date, return date, destination and a budget entered by the customer, together with the customer’s historical behaviour and preferences. Using this approach, the Trip Planner aim to deliver a ‘superior’ customer experience, because it will exceed the customer’s expectation. During the 28th annual SAIIE conference in 2017, the architecture for the Trip Planner demonstrator was presented [9] and the remainder of this paper will discuss how it is developed and the results and findings. The first section provides a concise summary of the theoretical concept investigated to get a better understanding of how the Trip Planner should be developed. The second section gives an overview of the model development for the Trip Planner demonstrator. The third section provides an overview of the simulator used in the Trip Planner demonstrator. The fourth section discusses the results and findings gained from it. The conclusion gives a summary of the key concepts discussed and how this study contributes to the management and improvement of customer experience, with the use of data analytics on a business partnering platform.
2. A LITERATURE BACKGROUND FOR THE TRIP PLANNER
The first step of this study was to conduct a literature study based on customer experience and its management, Big Data and its analytics, as well as business partnering on a cross-functional platform and how these three subjects integrate with each other. The paper in the SAIIE28 conference proceedings [9] provided an extensive overview of the literature study. This section will provide a concise summary of Customer Experience Management and Business Partnering on a cross-functional platform, as well as how machine learning contributes to the management of customer experience.
2.1 Customer experience management
To understand how a customer’s experience can be improved and managed, it is important to know what Customer Experience is and to be familiar with the management approach required to address this.
Customer Experience is defined by Best et al. [10], Meyer & Shwager [11] and Richardson [12] as the “sum-total of experiences a customer has with a product and/or service. The experiences expand throughout all interactions a customer has with that particular product and/or service. That is from the first interaction until discontinued use”. From this definition it is evident that it is more than just whether a customer is satisfied with a product
3669-3
or service. Customer Experience also takes place at various touchpoints during a customer’s interaction with a product or service, whether it is during the buying, using and/or sharing phase. But how does one manage and improve it?
Various management approaches exist, such as Customer Experience Management, Customer Interaction Management, Customer Knowledge Management, Customer Relationship Management and Service Quality Management. The two most used approaches in industry are Customer Experience Management (CEM) and Customer Relationship Management (CRM) [10, 11, 13, 14].
For this study CEM will be used. Firstly, because it is built on top of good practices and processes of CRM. Secondly, CEM is a proactive management approach whereas CRM is a reactive management approach [11]. One can define CEM as a strategic management approach in which an organisation transforms from a business-centric to a customer-centric organisation [10]. By following this approach, an organisation will have the ability to proactively respond to the drives and needs of a customer in order to manage and improve the Customer Experience with its product and/or services [11]. In other words, the organisation will change its skills, systems and processes to deliver a ‘superior’ Customer Experience. According to Schmitt [13], the focus will not only be on the customer’s transactions but rather on building rich and lifelong relationships with customers.
Therefore, CEM is the appropriate management approach to use for this study, as the aim is to plan a trip for a customer in a proactive manner based on their needs and desires. These needs and desires will be learned from analysing historical customer data and behaviour.
2.2 Business partnering on a cross-functional platform
Unfortunately, a customer’s historical and behavioural data are not freely available. Therefore, to gather all relevant data available about a customer, business partnerships are required. The organisations in these partnerships should be able to share the data amongst each other on a platform. Firstly, it is important to understand what business partnering is.
Business partnering is defined by Ellram & Hendrick [15] and Sheth & Parvatiyar [16] as a “relationship between two or more competing and/or non-competing organisations in which they share information amongst each other in order to share the reward or risk of such a relationship, whether it is for strategic or operational reasons”. Burns et al. [17] point out that most business partnerships are used today for analytical and advisory purposes. Therefore, for organisations to enter into a business partnership, it is important to know who the parties involved are as well as the purpose of the partnership. Once the business partnerships have been established, the organisations can share data amongst each other. Secondly, it is important to know how the data will be shared. An approach to this is to share data amongst parties across a platform, known as business partnering on a cross-functional platform. This term is synthesised by the authors, in which business partnering is combined with business platforms. In order to explain this concept, it is important to understand what a business platform is. A business platform as defined by Truner [18] is a “platform which consists of a set of related systems, processes, people and data that deliver (or expose) a set of business services via a standard set of application program interfaces”. Therefore, business platforms give an organisation the ability to transform its business processes by using a set of organisational principles and business capabilities. It is also a medium for an organisation to share and analyse its customer data.
It is also important to understand what a cross-functional platform is. An organisation that participates in the partnership, signs up to this platform for various functionalities. The functionalities include learning more about their customers, to build trusting relationships, to share data and to generate more revenue. The functionalities can be unique or the same for all the organisations involved. But it is important that all the organisations should share non-sensitive customer data.
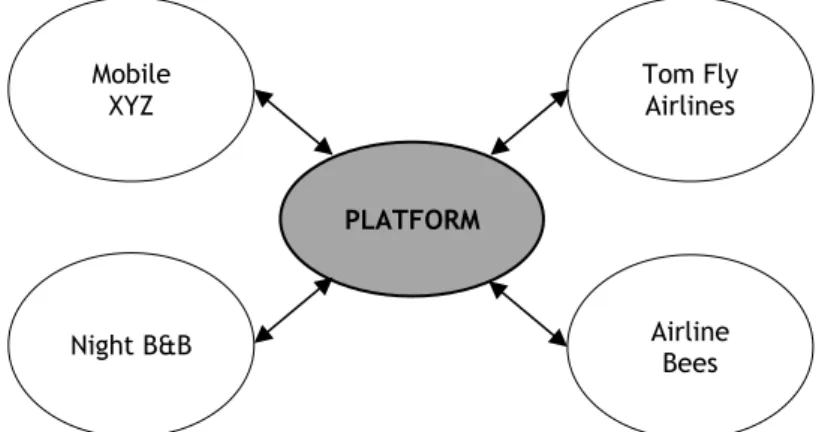
Therefore, business partnering on a cross-functional platform will be a technological architecture that is information based. It is important to note that it is a technological architecture, since it will give the organisations the ability to share and exchange data in order to add value for the involved partners as well as the owner of such a platform. Figure 1 shows an example of how it works.
3669-4
Let say that in A-Friendly-City there is an owner of such a platform. The first business partner who opts into the platform is Mobile XYZ that is the leading telecommunication business in A-Friendly-City. The second business partner is Tom Fly Airlines that only flies domestically. The third business partner is Airline Bees that flies internationally and domestically. Although Tom Fly and Airline Bees are competitors, they still share customer data and generate value by using each other’s business opportunities. The fourth and last business partner is
Night B&B that is the only bed and breakfast business in A-Friendly-City and they own three facilities.
Figure 1: Business partnering on a cross-functional platform
All four of these partners can help each other with sharing relevant customer data. Mobile XYZ have access to all the browser and location information of its customers. By sharing this information, the other partners can learn how the customers travel in and around A-Friendly-City and what internet sites are accessed by the customers, in order to predict behavioural trends. Night B&B can share data about when the customers check in and out, so the airlines can better plan their flight schedules. The airlines can share information on when and how many customers are travelling in and out of A-Friendly-City and where these customers come from. More types of customer data can be shared on this platform in order for these organisations to create more value. By looking at the example above, it is clear that business partnering on a cross-functional platform plays a vital role in the ability for the Trip Planner demonstrator to be a success. If partners do not opt into the Trip Planner’s platform, it will not be able to improve and manage a customer’s experience when they go on a trip.
2.3 Machine learning and artificial intelligence
Organisations have a lot of data available about a customer, but not all use it to learn more about their customers [19]. If all organisations applied analytical techniques on the customer datasets, they would have the ability to understand their customers better. By doing this, the organisation would be able to better manage and improve its customers’ experiences and more revenue will be generated.
To do data analyses, Big Data Analytics is required. Machine Learning is used in the Big Data Analytics domain to perform data mining techniques on datasets in order to gain insights from it. As stated by SAS Insights [20], machine learning is a data analysis approach in which a computer can learn to perform specific tasks. It is made possible by learning from previous computations in order to gain insight from data and to produce decisions and results which are reliable and repeatable. The insights and results are determined by the application of complex mathematical calculations and algorithms.
But what is the link between machine learning and Artificial Intelligence (AI)? Marr [21] points out that machine learning forms a subset of AI. In simple terms, AI gives machines the ability to perform “smart” tasks and machine learning gives the machines the ability to learn how to do it. According to Hutson [22] “an important recent advance in AI has been machine learning, which shows up in technologies from spellchecking to self-driving cars and is often carried out by computer systems called neural networks”.
A formal definition of AI as defined by Frankish & Ramsey [23] is that it “is a cross-disciplinary approach to understanding, modelling, and replicating intelligence and cognitive processes by invoking various computational, mathematical, logical, mechanical, and even biological principles and devices”. In other words, AI aims is to understand and build intelligent agents or entities by using various approaches. AI also has the ability to not only to think and act rationally, but to also think and act humanely [24].
PLATFORM Mobile
XYZ
Tom Fly Airlines
3669-5
Therefore, for the Trip Planner demonstrator to be a success, machine learning techniques should be implemented in order to improve and manage each individual trip and to gain insight into the behavioural trends that exist. This will give the owner of such a system the ability to deliver a ‘superior’ customer experience in the travel domain and the participating organisations will be able to increase their revenue.
3. THE TRIP PLANNER DEMONSTRATOR
The focus of this study is to manage and improve a customer’s experience in the domain of travel. It is based on a case study in which the purpose of the Trip Planner is demonstrated. The case study is about how a customer, Thandi, who lives in Cape Town, enters her trip requirement into the system. The trip requirement consists of a desired date of departure, a date of return, the destination and a budget. Thandi indicated that she wants to go to Durban next week Friday, return the following Monday and her budget is R5 000. The system will use this information to book her accommodation, transportation mode to get to Durban and the transportation mode used in Durban and Cape Town. After the booking is completed, the Trip Planner will notify Thandi of all the events that will occur. During the trip itself, alterations can be made to the trip, based on Thandi’s feedback. The system will also notify Thandi about other events that might interest her based on her historical behaviour. For example, when she arrives at the airport, the system will inform her that the newest book by her favourite author is available in the bookstore.
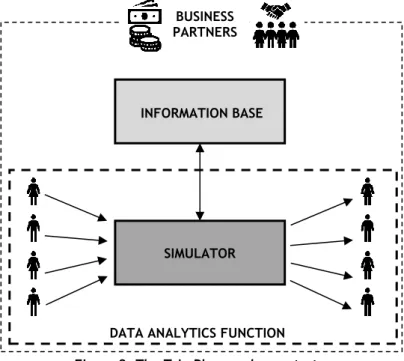
To develop this demonstrator, first an architecture is required. The architecture was provided by Roos & Bekker [9], during the SAIIE28 conference. The model development is based on this architecture. As can be seen in Figure 2, the Trip Planner demonstrator consists of four parts, namely business partners, an information base, a simulator and a data analytics function. These four parts are interdependent of each other and they integrate with each other to perform as a digital information and support system.
Figure 2: The Trip Planner demonstrator
The first part of the model is business partners. Without business partnerships, the Trip Planner demonstrator would not exist. The business partners are the backbone of the system, as they provide all the relevant customer data, but they are also the ones who will reap the benefits of this system.
The second part of the model is the information base. MS SQL Server is used as the database server for the Trip Planner information base. The data entities stored in the information base consist of the customers, customers’ historical transactions, accommodation companies, long-distance transportation companies (airplanes and buses), short-distance transportation companies (hailing app taxis such as Uber, ‘normal’ taxis and car rental), customer preference for the type of accommodation, short-distance transport and long-distance transport,
DATA ANALYTICS FUNCTION INFORMATION BASE
SIMULATOR BUSINESS PARTNERS
3669-6
recorded customer experience at touchpoints, booked accommodation, long-distance transportation and short-distance transport, trip requirements and other data entities relevant to these data entities. All data used for the Trip Planner demonstrator have been extracted either from websites or fictional data have been simulated in Matlab based on statistics.
The third part of the model is the simulator, where all the magic happens. The simulator has been developed in Matlab. The first functionality of the simulator is that it will use data from the information base to plan a customer’s trip, based on the trip requirement, customer preferences and customers’ historical behaviour. The second functionality of the simulator is that it will manage the customer’s trip while he or she is travelling. In other words, it will record the various touchpoints on the trip, make suggestions for other events that may be relevant to the customer and make alterations to the trip if required. The simulator will suggest unique trips for many customers. A customer can use the system repetitively and each time he or she will receive a unique trip that will manage their experience more effectively. The actions performed by the simulator is discussed in the next section.
The fourth part of the model is the data analytics function. Based on the previously completed trips, machine learning will be performed to gather insights. The machine learning tool that will be used for this is supervised learning as it makes future predictions by using a known dataset [25]. The two data mining techniques that are a subset of supervised learning are classification and regression techniques. Classification is a predictive data analysis technique in which associated class labels are used to divide data into predefined classes and regression is when relationships between dependent and one or more independent variables are explored in a given dataset [26, 27]. The data analytics function model will use the classification techniques in the simulator and to determine the results and findings of the Trip Planner.
4. THE SIMULATOR OF THE TRIP PLANNER DEMONSTRATOR
The simulator is the enabler of the processes in the Trip Planner demonstrator, as its prime functionality is to simulate unique trips for many customers. A unique trip will be simulated for a customer based on the trip requirements and the customer’s historical behaviour and preferences. The simulator has been developed in the Matlab software. In order to develop this simulator, it is important to understand the different phases that it should undergo. In other words, what phases are required for a customer to go on an actual trip which is solely planned by the simulator based on the trip requirements in which the customer’s experiences will be managed and improved.
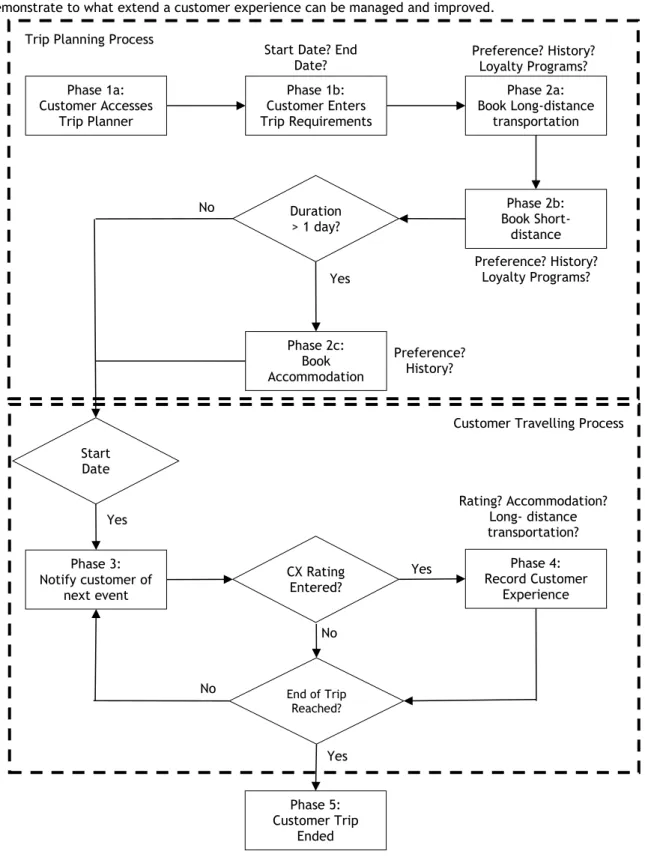
In order to know what phases are required, it is important to know the processes required for the Trip Planner demonstrator. The processes can be divided into two processes as defined in the architecture, namely the trip planning process and customer travelling process. The trip planning process is the process of where a customer’s trip is planned and booked. The customer travelling process is when the customer receives notifications on the upcoming events of the trip and the customer rates the experience at the various touchpoints. The phases required to enable the simulator to run these processes can be seen in the concept model of the simulator as presented in Figure 3.
The first two phases forms part of the tip planning process. In the first phase a customer accesses the system and enters their trip requirements in order for a trip to be booked and planned. The simulator will choose a random customer and it will then assign a start and end date, a destination that is in a different province from which the customer resides in and a budget that is depending on the duration of the trip as well as the destination of the trip.
The second phase of the simulator is the booking procedure. The booking procedure is done by applying rules on the information available about the customer’s historical behaviour, preferences and loyalty programs where applicable. The simulator will choice the best fitted option for the booking of accommodation, long-distance transportation and short-distance transportation based on these rules.
The last three phases forms part of the customer travelling process. During the third phase, notifications are sent out to the customers as the events of the trip unfold. The events are all touchpoints on the customer journey, where the customer journey is the actual trip. In other words, the simulator will send a notification prior to an event to inform the customer with the necessary information. Events include upcoming flights, bookings for car rentals, taxi’s arrival time, check-in and check-out times at the accommodation, special offers
3669-7
based on historical transactions, etc. The special offers will only occur during the time when a customer is at a long-distance transportation station or airport. It has only been limited to long-distance transportation to demonstrate to what extend a customer experience can be managed and improved.
Figure 3: The concept model of the simulator
Customer Travelling Process Trip Planning Process
Phase 1b: Customer Enters Trip Requirements Duration > 1 day? Phase 2b: Book Short-distance transportation Phase 2c: Book Accommodation Start Date Reached? Phase 3: Notify customer of next event CX Rating Entered? Phase 4: Record Customer Experience End of Trip Reached? Phase 2a: Book Long-distance transportation Phase 5: Customer Trip Ended Phase 1a: Customer Accesses Trip Planner
Start Date? End Date? Destination? Budget? Preference? History? Loyalty Programs? Preference? History? Loyalty Programs? Preference? History? Yes No Yes No No Yes Rating? Accommodation? Long- distance transportation? Short-distance Yes
3669-8
The fourth phase is when a customer rates the experience of a touchpoint, which can occur during or after the touchpoint. In order for the simulator to capture a customer experience, the customer has to physically rate their experience at these various touchpoints. But a customer will not necessarily rate their experience at every touchpoint in the trip and they will most probably only rate their experience if they had an above or below average experience. Therefore, two approaches can be used for the recording of the customer experience. Either an average experience can be recorded if the customer did not rate the experience or it will only record the rating entered by the customer considered that it will only be above or below average experience. For the purpose of this study, the latter approach will be used as the aim of the study is to show how this system can improve and manage a customer’s experience. The customer experience rating is based on a truncated Poisson distribution (which is discrete and finite). The lambda parameter of the Poisson distribution is forced to vary by means of a truncated exponential distribution. This emulates unpredictable customer behaviour.
The fifth phase is when a customer has completed a trip. During this phase the rating of the touch points are analysed in order to improve the historical outcome of the rule-based application. It is also important to note that after the customer has rated a touchpoint, the only future events in a trip that can be changed is the taxi service of the short-distance transportation and special offers based on historical transactions. All other events remain fixed. But for the next trip of a customer, the accommodation, long-distance transportation or any type of short-distance transportation can be changed if necessary. This reflects to what levels a customer experience can be influenced.
The simulator is therefore the fundamental part of the Trip Planner demonstrator in order to show how the customer experience can be improved and managed in the travel domain. The simulator is a rule-based system in which the system became cleverer as history is built up. The outcome of the rule-based application is influenced as history is build.
5. RESULTS AND FINDINGS
For this article, a concise database is used to demonstrate the functionality of the Trip Planner. Only airplanes have been used for the long-distance transport and only customers living in Cape Town, Johannesburg, Durban and Bloemfontein have been included.
As has been highlighted in the previous section, in order to capture a customer experience, the customer has to physically rate their experience at various touchpoints. A customer will not necessarily rate an experience at every touchpoint during the trip and will usually only rate the experience if it was above or below average. Therefore, only the extreme points are analysed.
The results and findings obtained from the application of machine learning techniques, namely the weighted average and rule-based classification, can be one of two sets. The first is that it will show how a customer’s experience has been improved and managed within a trip and/or how it has been improved from one trip to the next. The second represents the analysis that was done based on the customer experience rating. By doing analysis it will show which services most customers have been unhappy with and which services customers have rated higher. The latter results will indicate which companies need to improve their customer services and which ones have been doing well and it will give an overall view of how customer’s experience journeys in the travel domain.
For the first set of results, the following two examples from the database will be discussed (shown in Table 1). The first case is for Tendai Mbende, who has travelled twice from Bloemfontein to Johannesburg. For the first trip, the system booked her flights with KayLines but she was highly dissatisfied and gave the experience a poor rating (1 out of 5). Based on this, the system booked her flights for the second trip on Cheetah Airways by using the rule-based analysis, which she gave an above average rating (4 out of 5). The second case is for Brady
Pieterse, who travelled from Cape Town to Port Elizabeth. There he first used XYTransport but he was he was
not happy with the experience and gave it a below average rating (2 out of 5). Therefore, for the next on-ground transportation (short-distance transport) he required, the system booked Hop Around. After he used Hop Around, he did not record the experience, which indicated that he was reasonably satisfied. Other similar examples can be drawn from the results. These examples represent the capability of the system to improve and manage a customer’s experience during and after a trip by using the intelligence gained as history is build up.
3669-9
Table 1: Example of trip improvements
Customer Trip Destination Airline Short Distance Transport Accommodation Tendai
Mbende
1 Johannesburg KayLines Wheel on the hire Angala Hotel de Boutique 2 Johannesburg Cheetah Airways Wheel on the hire Angala Hotel de Boutique Brady Pieterse 1 Port Elizabeth Brightest Airways XYTransport None Hop Around
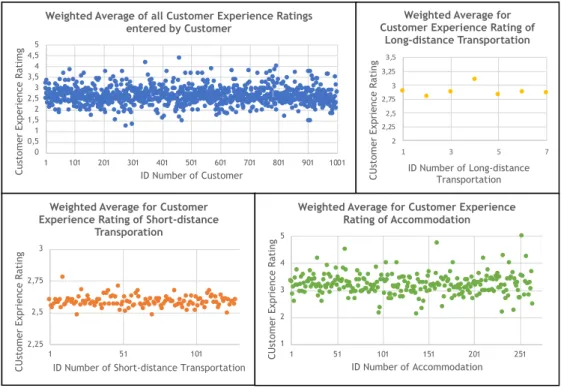
For the second sets of results, various classification techniques have been applied on the touchpoints in order to determine which services need improvement by using the weighted average method. Analysis was done for the long-distance transportation, short-distance transportation, accommodation and customers. The output after applying the weighted average can be seen in Figure 4. The y-axis represents the Customer Experience Rating entered by the customer and the x-axis represents the company and customer ID number used in the database. The top and bottom-rated companies have also been identified and can be seen in Table 2.
Figure 4: Weighted average plots
Table 2: Top and bottom-rated companies
Type of Service Top companies Bottom companies
Accommodation
1. Valdior de Vile (Durban)
1.Dock de Bridge Hotel & Suites (Cape Town) 2. Lalaria de Sleep Plasa
(Durban) 2. Di’o Hoek Country Hotel (Durban) 3. Lofts de Bohemian
(Cape Town) 3. Soonshowers Place (Pretoria) Long-distance
Transport Yendiza SA Central Airways
1. Friendly Car Rental 1. The Dolphin Cab 0 0,5 1 1,5 2 2,5 3 3,5 4 4,5 5 1 101 201 301 401 501 601 701 801 901 1001 C us to m er E xp er ie nc e R at im g ID Number of Customer
Weighted Average of all Customer Experience Ratings entered by Customer 2 2,25 2,5 2,75 3 3,25 3,5 1 3 5 7 C U st om er E xp ri en ce R at in g ID Number of Long-distance Transportation
Weighted Average for Customer Experience Rating of
Long-distance Transportation 2,25 2,5 2,75 3 1 51 101 C U st om er E xp ri en ce R at in g
ID Number of Short-distance Transportation
Weighted Average for Customer Experience Rating of Short-distance
Transporation 1 2 3 4 5 1 51 101 151 201 251 C U st om er E xp ri en ce R at in g ID Number of Accommodation
Weighted Average for Customer Experience Rating of Accommodation
3669-10 Short-distance
Transport
2. Mozzie and Jen Cabs 2. Willie’s Taxi
3. Friendly Haily (Sedan) 3. Ride and Pay (Sedan)
Based on these results, it is clear that the system can effectively book an entire trip for a customer and by doing so, it also has the ability to improve and manage a customer’s experience. It can also highlight the top and bottom-rated companies, for these companies to either improve their services or to keep on doing what they are doing. Future work will include the expansion of the database. In other words, the type of long-distance transportation options offers airplanes and buses and will also include all areas in South Africa, not only the major cities.
6. CONCLUSION
This article provided insight into the work completed in the domain of travel in order to show how customer experience can be managed by using data analysis and business partnering on a cross-functional platform. This work contributes to the mutual ongoing project of the USMA research team in order to show how Big Data Analytics can be used in a business to create value.
Based on the results and findings obtained from the Trip Planner demonstrator, it is clear that the system can effectively manage and improve a customer’s experience. It can also highlight top and bottom-rated companies. The Trip Planner demonstrator also shows how customer experience can be improved using modern technologies. For the implementation of such a system, an industrial engineer is an ideal candidate due to their ability to understand systems and the integration of it.
REFERENCES
[1] Buchanan, R.A. 2018. History of Technology, Encyclopaedia Britannica. [Online] Available: https://www.britannica.com/technology/history-of-technology. [Accessed: 21 May 2018].
[2] Morrar, R.; Arman, H. & Mousa, S. 2017. The Fourth Industrial Revolution (Industry 4.0): A Social Innovation Perspective, Technology Innovation Management Review, 7(11), pp. 12 - 20.
[3] Liu, Y. & Xu, X. 2017. Analysis, Industry 4.0 and Cloud Manufacturing: A Comparative Analysis, Journal of Manufacturing Science and Engineering, 139(3), pp. 034701-1 - 034701-8, 2017.
[4] Schwab, K. 2016. The Fourth Industrial Revolution, Switzerland: World Economic Forum.
[5] New A380 Suites. 2018. Singapore Airlines. [Online] Available: https://www.singaporeai r.com/en_UK/gb/flying-withus/cabins/suites/new-a380-suites/. [Accessed: 21 May 2018].
[6] The Points Guy. 2018. Review: Singapore’s New A380 Suite, the World’s New Best First Class. [Online] Available: https://thepointsguy.com/2018/02/sq-new-a380-suite-review/. [Accessed: 21 May 2018]. [7] What is TripIt - How it Works. 2018. TripIt. [Online] Available: https://www.tripit.com/learnMore
[Accessed: 21 May 2018].
[8] Instantly Organize Travel Plans with TripIt. 2017. YouTube. [Online] Available: https://www.youtube.com/watch?v=KRT2BBwHRIM. [Accessed: 21 May 2018].
[9] Roos, M. & Bekker, J. 2017. An Architecture for Customer Experience in a Partnering Venture, in SAIIE28 Conference Proceedings, South Africa, 2017.
[10] Best, I.; Shamir, S.; Amalfitano, M.; Cotton, S.; Kawecki, A.; Chowdhury, S.; Mitra, S. & Sendel, R. 2016. Customer Experience Management — Introduction and Fundamentals, TM Forum, GB962.
[11] Meyer, C. & Schwager, A. 2007. Understanding Customer Experience, Harvard Business Review. [Online] Available: https://hbr.org/2007/02/understanding-customer-experience. [Accessed: 23 May 2018]. [12] Richardson, A. 2010. Understanding Customer Experience, Harvard Business Review. [Online] Available:
https://hbr.org/2010/10/understanding-customer-experie. [Accessed: 23 May 2018].
[13] Schmitt, B. 2003. Customer experience management: A revolutionary approach to connecting with your customers, New York: Wiley.
[14] Walden, S. 2017. Customer Experience Management Rebooted: Are you an Experience brand or an efficiency brand, London: Macmillan.
[15] Ellram, L. & Hendrick, T. 1995. Partnering Characteristics: A Dyadic Perspective, Journal of Business Logistics, 16(1), p. 41–64.
[16] Sheth, J. & Parvatiyar, A. 1992. Towards a Theory of Business Alliance Formation, Scandinavian International Business Review, 1(3), p. 71–87.
[17] Burns, J.; Warren, L. & Oliveira, J. 2014. Business partnering: Is it all that good?, Controlling and
3669-11
[18] Truner, A. 2017. Platforms: Design, deploy, diversify, repeat, TM Forum Inform. [Online] Available:
https://inform.tmforum.org/features-and-analysis/2017/05/plat forms-design-deploy-diversify-repeat/. [Accessed: 23 May 2018].
[19] Hopkins, B. 2016. Think You Want to Be “Data-Driven”? Insight Is the New Data, Forrester. [Online]
Available:
https://go.forrester.com/blogs/16-03-09-think_you_want_to_be_data_driven_insight_is_the_new_data/ [Accessed: 23 May 2018].
[20] Machine Learning: What it is and why it matters. n.d. SAS Insights. [Online]. Available: https://www.sas.com/en_za/insights/analytics/machine-learning.html. [Accessed: 23 May 2018]. [21] Marr, B. 2016. What Is The Difference Between Artificial Intelligence And Machine Learning?, Forbes,
[Online]. Available: https://www.forbes.com/sites/bernardmarr/ 2016/12/06/what-is-the-difference-between-artificial-intelligence-and-machine-learning/ - 445045c72742 [Accessed: 23 May 2018].
[22] Hutson, M. 2017. AI Glossary: Artificial intelligence, in so many words, Science, 357(6346), p. 19. [23] Frankish, K. & Ramsey, W.M. 2014. The Cambridge Handbook of Artificial Intelligence, Cambridge
University Press.
[24] Russell, S.J. & Norvig, P. 2016. Artificial Intelligence: A Modern Approach, 3rd edition, Pearson. [25] Kotsiantis, S.B. 2007. Supervised Machine Learning: A Review of Classification, Informatica, 31, pp.
249-268.
[26] Ngai, E.; Hu, Y.; Wong, Y.; Chen, Y. & Sun, X. 2011. The application of data mining techniques in financial fraud detection: A classification framework and an academic review of literature, Decision Support Systems, 50(3), pp. 559-569.
[27] Han, J. & Kamber, M. 2006. Data Mining: Concepts and Techniques, 2nd edition, Morgan Kaufmann Publishers, pp. 285-464.