A Data-Driven Approach Using Deep Learning Time Series
Prediction for Forecasting Power System Variables
Nezmin Kayedpour
1,2*, Arash E. Samani
1,2, Jeroen D. M. De Kooning
1,3,
Lieven Vandevelde
1,2, Guillaume Crevecoeur
1,21
Department of Electrical Energy, Metals, Mechanical Constructions and Systems, Ghent University, Belgium
2EEDT Decision & Control, Flanders Make
3
EEDT Motion Products, Flanders Make
*[email protected]
Abstract—This study investigates the performance of ‘GroupMethod of Data Handling’ type neural network algorithm in short-term time series prediction of the renewable energy and grid-balancing variables, such as the Net Regulation Volume (NRV) and System Imbalance (SI). The proposed method is compared with a Multi-layer Perceptron (MLP) neural network which is known as a universal approximator. Empirical validation results show that the GMDH performance is more accurate in compression with the most recent forecast which is provided by ELIA (Belgian transmission system operator). This study aims to practice the applicability of the polynomial GMDH-type neural network algorithm in time series prediction under a wide range of complexity and uncertainty related to the environment and electricity market.
Keywords- Renewble energy, Power system, Timeseries prediction, Group method of data handling (GMDH), Multi-layer perceptron (MLP)
I. INTRODUCTION
The system operators are responsible for maintaining the balance between electricity supply and demand [1]. By increasing the number of renewable power installations into the grid, this balance is becoming more difficult to maintain due to the intermittent and unpredictable characteristics of renewable sources [2]. Despite the obstacles, the main objective of the European Network of Transmission System Operators for Electricity (ENTSO-E) is the secure and stable integration of renewable energy resources (wind and solar power) into the power system [3,4].
Apart from the stochastic behavior and uncertain nature of renewable energy resources, the high complexity of Internal Energy Market (IEM) competitions complicates the contribution of renewables in grid balancing [5]. To overcome such limitations and simplify the decision-making procedure for energy actors on both generation and curtail levels, detailed forecasting of power system elements is needed [6]. Additionally, the load and wind power short-term forecasts of a few minutes to hours ahead are required to design the advanced frequency control systems of offshore wind farms, which can provide ancillary services as well as improve the power-sharing and scheduling of generating capacity and operating reserves [7].
Among the wide variety of short-term forecasting methods which are applicable for predicting future values of time series, deep learning neural network-based approaches are the most successful ones [8,9,10].
In this study, a neural network has been proposed based on the machine learning technique to study the application of ‘Group Method of Data Handling’ (GMDH) in the power system time-series prediction. The proposed GMDH is applied on the short-term forecasting of wind power, solar power, system imbalance variables and tariffs within the Belgian control area.
This paper is organized into four sections. In section 2, policies of the Belgian Transmission System Operator (TSO) Elia to maintain the stability of the grid are described. Furthermore, the fundamental grid balancing variables are introduced as the main future values of the time series which can be predicted based on past values, which are reported by Elia and are available at Elia’s website. Section 3 presents the deep learning approach and method in time series prediction. Section 4 presents the achieved prediction results. Section 5 concludes and discusses further research.
II. GRID BALANCING VARIABLE
Within the Belgian control area, Elia guarantees the stability of the grid. Balancing Responsible Parties (BRPs) are responsible for managing their instantaneous perimeter residual imbalances on a 15 minute time interval, by an increasing or decreasing the volumes of electricity taken off or injected into the grid. Elia has also created an incentive mechanism to encourage every BRP to maintain the balance of the grid in its control perimeter. In this mechanism, BRPs are subject to imbalance tariffs at the end of every quarter-hour when an imbalance occurs. In this system, imbalance can be positive (injection exceed offtake) or negative (offtake exceed injection).
Elia requests BRPs for upward and downward activation to regulate the balance of its area. This request is based on the Marginal Incremental Price (MIP) and Marginal Decremented Price (MDP) respectively. The prices for positive and negative imbalance depend on the situation of NRV in the Elia control area. Four possible scenarios are
briefly described in Table I. The parameters α and β are
additional components that encourage the BRPs to regulate their balance at zero regardless of the circumstances [11].
In this context, the Net Regulation Volume (NRV) is calculated using the difference for each moment between the sum of the volumes of all upward regulations and the sum of the volumes of all downward regulations. A positive value indicates there is a deficit in the area which means offtakes are more than injections and the negative value indicates there is a surplus in the area which means injections are more than offtakes.
TABLE I. Imbalance tariff in a BRP perimeter
Im b a la n ce i n th e B R P s p er im et er
Situation in the Elia control area Net Regulation Volume (NRV)
Surplus in the Area Offtakes < Injections
NRV is negative (net downward
regulation)
Deficit in the Area Injections > Offtakes
NRV is positive (net upward regulation)
Positive A B
MDP – α1 MIP – β1
Negative C D
MDP + β2 MIP + α2
The Area Control Error (ACE) is, for a considered quarter and expressed in MW, the difference between the scheduled and measured values of the interchanges of the Belgian control area, taking into account the effect of frequency bias. The System Imbalance (SI) is calculated by taking the difference between the Area Control Error (ACE) and the Net Regulation Volume (NRV). POS/NEG are tariffs applicable for a positive or negative imbalance within the BRP’s perimeter.
The ancillary services that can be provided by a BRP depend on numerous factors. One of them is a detailed forecast of the system balancing variables which should be provided by system operators. Elia monitors the smooth operation of its grid’s variables around the clock such as total load, wind power, system imbalance, etc. This means continuously tracking time series and making forecasts.
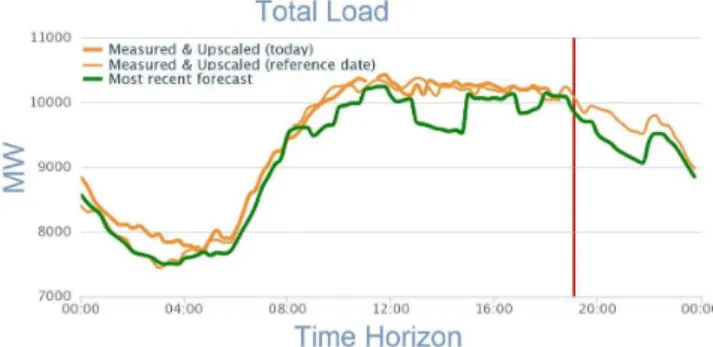
Figure 1.The most recent estimation of the total load for a single day (provided by Elia)
Fig. 1 shows an estimation of the total load on 25th of
July 2019 in real-time (bold orange curve), which can be compared with the measured & up-scaled total load for the specified reference date (orange curve), and with the most recent forecasts (green curve) for the specified forecast (up to 5 hours ahead). The total load is based on a combination of computation, measurements, and extrapolations. In case one or more of the inputs is missing, the graph, as well as the historical data, will show blanks [11].
III. METHODOLOGY
The aim of this study is to apply and compare the neural network architectures that are capable of learning temporal features and the chaotic nature of renewable sources and the complexity of power grid variables and components. For enhancement of the short-term prediction, the constructive neural network learning algorithm is used based on the Multi-Layer Perceptron (MLP) and the Group Method of Data Handling (GMDH). These models are applied due to their capability to predict any time series and continuous nonlinear function with an arbitrary accuracy. GMDH is a robust and persuasive method which is the basis of many types of polynomial neural networks with a significant improvement in the prediction errors compared to the classical MLP structure with regression analysis.
Artificial Neural Networks (ANNs) have been widely used for time series forecasting. The well-known Multi-layer Perceptron (MLP) method, even with one hidden layer, can be realized as a universal approximator of arbitrary nonlinear functions. The gradient descent method is used to train the MLP based on the “error back-propagation” which is one of the most popular learning algorithms for predicting chaotic time series as well as tracking the regression problems [12].
In this study, the MLP neural networks with maximum 3 hidden layers and a maximum of 10 neurons at each layer are used to find a good predictive model for short-term time series forecasting. To predict the future values of the time series from the past values, the MLP structure is trained with a large training dataset which is collected with a quarter-hour sample time in the whole year of 2018 and validated with a new unseen test dataset for the most recent five months of the year 2019.
Although the dynamic neural networks are good at time series prediction, the problem of the initial values of connection weights, choosing the structure of the MLP or finding a suitable learning rate during training are still challenging for applying this method to real-world problems.
A. Group Method of Data Handeling (GMDH)
In this work, regarding the practical problem of the forecasts, a nonlinear regression method is used as a semi-supervised deep learning tool that automatically self-organizes the predictive distribution of variables. GMDH by its own nature is able to drive the best polynomial network structure in order to reveal the approximated function with high accuracy to predict future values from statistics, historical dataset [13].
The GMDH time series prediction considers a general relationship between delayed inputs and output variables in the form of polynomial functions which is referred to as Volterra function series or the Kolmogorov–Gabor polynomial function expressed by:
0 1 1 1 1 1 1 m m m m m m i i ij i j ijk i j k i i j i i k
y
a
a x
a x x
a x x x
= = = = = == +
+
+
(1)where y is the response variable, x is the vector of lagged time series to be regressed, m is the number of variables and
a
0,a
i,a
ij anda
ijk are the weights [14, 15].In this study, the quadratic K-G polynomial is used in the form of: 2 2 0 1 2 3 4 5 ( , )i j i j j i i j z= f x x = +b b x +b x +b x x +b x +b x (2) Figure 2.The schematic structure of GMDH neural network In respect of time series, the GMDH algorithm learns the relationship among the lags with the function f which is given in (2). The proposed stochastic approximation algorithm is based on a multilayer structure using various component subsets of the polynomial function for each layer; in the way that the output obtained from the last layer will be set as a new input variable for the next layer. The architecture is shown schematically in Fig. 2. All possible tries of two independent variables are taken out of a total n inputs to build a regression polynomial in the form of (2) in the first layer. Therefore, the activation function is the second-order polynomial but it can be gradually increased to higher orders to find an architecture with an optimal complexity. The number of solutions will be restricted by a threshold value of the external criterion to find the fittest structure. The parameters are calculated by using a least-squares estimation.
IV. RESULTS
In this study, time series prediction is practiced on each power grid variable dataset containing 50,000 samples which are observed and measured every quarter-hour during the year 2018 (training dataset) and the first five months of the year 2019 (test dataset). All datasets will be divided into the learning set, containing 35,000 sample, and the
validation set, containing 15,000 samples. After a data cleaning procedure, the training process with a maximum number of 3 layers and a maximum number of 20 neurons in each layer is applied to determine the coefficients for all the neurons. To avoid overfitting, the number of neurons cannot increase more than 20. However, the parameter called “Selection Pressure” is considered, can be varied between zero and one, as a criterion to determine the number of neurons. If the selection pressure equals zero all the neurons will be selected for the next layer (maximum 20) but if the selection pressure equals one, then those neurons which have the poorest results must be removed from the inputs of the next layer. The criteria are defined by the root mean square error (RMSE). The forecasting ability of each GMDH for the whole dataset, training and validation dataset is assessed using the Root Mean Square Error (RMSE), error mean, and error standard deviation (σ).
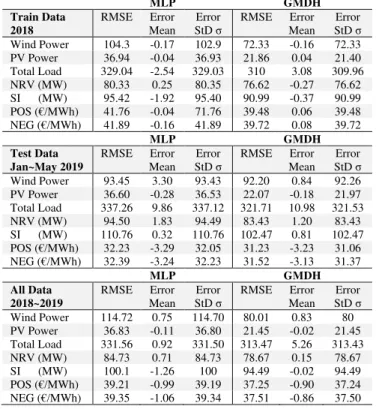
Prediction results using both MLP and GMDH methods are given in Table II.
TABLE II. Summary Statics Performance Short-Term Forecasting
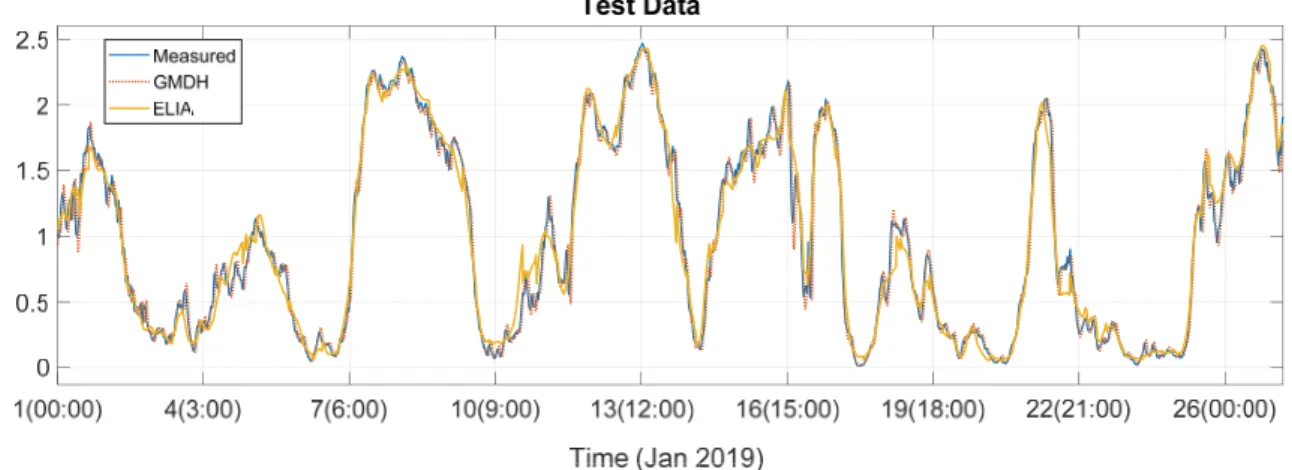
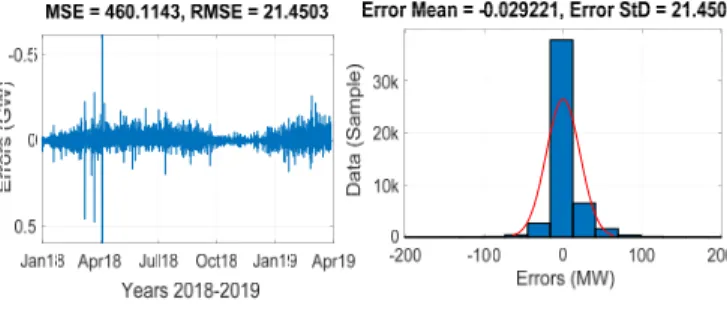
MLP GMDH Train Data 2018 RMSE Error Mean StD Error σ RMSE Error Mean StD Error σ Wind Power 104.3 -0.17 102.9 72.33 -0.16 72.33 PV Power 36.94 -0.04 36.93 21.86 0.04 21.40 Total Load 329.04 -2.54 329.03 310 3.08 309.96 NRV (MW) 80.33 0.25 80.35 76.62 -0.27 76.62 SI (MW) 95.42 -1.92 95.40 90.99 -0.37 90.99 POS (€/MWh) 41.76 -0.04 71.76 39.48 0.06 39.48 NEG (€/MWh) 41.89 -0.16 41.89 39.72 0.08 39.72 MLP GMDH Test Data Jan~May 2019 RMSE Error Mean Error StD σ RMSE Error Mean Error StD σ Wind Power 93.45 3.30 93.43 92.20 0.84 92.26 PV Power 36.60 -0.28 36.53 22.07 -0.18 21.97 Total Load 337.26 9.86 337.12 321.71 10.98 321.53 NRV (MW) 94.50 1.83 94.49 83.43 1.20 83.43 SI (MW) 110.76 0.32 110.76 102.47 0.81 102.47 POS (€/MWh) 32.23 -3.29 32.05 31.23 -3.23 31.06 NEG (€/MWh) 32.39 -3.24 32.23 31.52 -3.13 31.37 MLP GMDH All Data 2018~2019 RMSE Error Mean StD Error σ RMSE Error Mean StD Error σ Wind Power 114.72 0.75 114.70 80.01 0.83 80 PV Power 36.83 -0.11 36.80 21.45 -0.02 21.45 Total Load 331.56 0.92 331.50 313.47 5.26 313.43 NRV (MW) 84.73 0.71 84.73 78.67 0.15 78.67 SI (MW) 100.1 -1.26 100 94.49 -0.02 94.49 POS (€/MWh) 39.21 -0.99 39.19 37.25 -0.90 37.24 NEG (€/MWh) 39.35 -1.06 39.34 37.51 -0.86 37.50 Fig. 3, 5 and 7 demonstrate the quarter-hourly measured total load, wind power, and photovoltaic power respectively during the first five months of the year 2019 and the short-term prediction obtained from the GMDH neural network, all on validation data compared with the most recent forecast that have been reported by Elia. Fig. 4, 6 and 8 illustrate the normal distribution of errors and the histogram of residuals. There are no extreme outliers but some are still set by the number of standard deviation away from the mean.
Figure 3. The wind power forecasting using GMDH, comparing with ELIA’s most recent forecast
Figure 4. The prediction-error of GMDH neural network for wind power Figure 6. The prediction-error of GMDH neural network for total load
Figure 5. The total load forecasting using GMDH, comparing with ELIA’s most recent forecast
Figure 8. The prediction-error of GMDH neural network for pv-power V. CONCLUSION AND PERSPECTIVES The growing share of renewable energy resources is challenging the BRPs to ensure the balance of the grid; not only they have to forecast the System Imbalance, Total Load, Net Regulation Volume and Positive/Negative imbalance within their perimeter but also have to monitor and forecast the electricity generated by wind power and solar power. Therefore, in this work, the GMDH neural network has been studied for short-term forecasting of all the above-mentioned variables. The prediction error statistics demonstrate accurate forecasting ability which has been learned from the historical datasets. The promising algorithm with the small error prediction is able to forecast such important power system variables using data-driven model and without knowing the underlying environment or the market rules.
It is also noteworthy that the GMDH is widely used for model evaluation and regression. However, when it comes to time series forecasting, its application sometimes might not be straight forward due to the inherent serial correlation and the possible non-stationarity of the data which potentially results in overfitting problem as well. Using the cross-validation procedure is a recommended solution to overcome such a problem [16].
ACKNOWLEDGMENT
This work is supported by the BEOWIND project, funded by the Energy Transition Fund of the Belgian federal government and the FWO research project G.0D93.16N, funded by the Research Foundation Flanders.
REFERENCES
[1] Gerard, Helena, Enrique Israel Rivero Puente, and Daan Six. "Coordination between transmission and distribution system operators in the electricity sector: A conceptual framework." Utilities Policy, 2018.
[2] Joos, Michael, and Iain Staffell. "Short-term integration costs of variable renewable energy: Wind curtailment and
balancing in Britain and Germany." Renewable and Sustainable Energy Reviews, 2018.
[3] Hirth, Lion, Jonathan Mühlenpfordt, and Marisa Bulkeley. "The ENTSO-E Transparency Platform–A review of Europe’s most ambitious electricity data platform." Applied energy, 2018.
[4] Knopf, Brigitte, Paul Nahmmacher, and Eva Schmid. "The European renewable energy target for 2030–An impact assessment of the electricity sector." Energy policy, 2015. [5] Deane, J. P., Á. Driscoll, and BP Ó. Gallachóir. "Quantifying the impacts of national renewable electricity ambitions using a North–West European electricity market model." Renewable energy, 2015.
[6] Hong, Tao, et al. "Probabilistic energy forecasting: Global energy forecasting competition 2014 and beyond.", International journal of forecasting, 2016.
[7] Ela, Erik, Michael Milligan, and Brendan Kirby. Operating reserves and variable generation. No. NREL/TP-5500-51978. National Renewable Energy Lab.(NREL), Golden, CO (United States), 2011.
[8] Ren, Ye, P. N. Suganthan, and N. Srikanth. "Ensemble methods for wind and solar power forecasting—A state-of-the-art review.", Renewable and Sustainable Energy Reviews, 2015.
[9] Gamboa, John Cristian Borges. "Deep learning for time-series analysis.", arXiv preprint arXiv, 2017.
[10] Almalaq, Abdulaziz, and George Edwards. "A review of deep learning methods applied on load forecasting.", 16th IEEE International Conference on Machine Learning and Applications (ICMLA), 2017
[11] Elia, Belgium’s electricity transmission system operator, http://www.elia.be
[12] Ravi, Vadlamani, Dadabada Pradeepkumar, and Kalyanmoy Deb. "Financial time series prediction using hybrids of chaos theory, layer perceptron and
multi-objective evolutionary algorithms.", Swarm and
Evolutionary Computation, 2017
[13] Abdel-Aal, Radwan E., Mourad A. Elhadidy, and S. M. Shaahid. "Modeling and forecasting the mean hourly wind speed time series using GMDH-based abductive networks.",
Renewable Energy, 2009.
[14] Nikolaev, Nikolay Y., and Hitoshi Iba. "Polynomial harmonic GMDH learning networks for time series
modeling.", Neural Networks, 2003
[15] Dag, Osman, and Ceylan Yozgatligil. "Gmdh: An R package for short term forecasting via gmdh-type neural
network algorithms.", The R Journal, 2016.
[16] Bergmeir, Christoph, Rob J. Hyndman, and Bonsoo Koo. "A note on the validity of cross-validation for
evaluating autoregressive time series
prediction.", Computational Statistics & Data Analysis, 2018.
AUTHORS’ BACKGROUND
Your Name Title* Research Field Personal website
Nezmin
Kayedpour
PhD Student
Control and Optimization, Machine learning, Offshore
wind farms, Grid integration https://telefoonboek.ugent.be/en/people/802002973286
Arash E. Samani
Student PhDWind energy, Structural analysis, Control and
Optimization, Machine learning, Grid
integration https://telefoonboek.ugent.be/en/people/802002522642
Jeroen De
Kooning
Assistant ProfessorWind energy, Solar energy, Brushless machines, Mechatronics, Power electronics, Measurement techniques, Power systems
https://telefoonboek.ugent.be/en/people/802000856262
Lieven
Vandevelde
Full Professor
Electric power systems, Renewable energy and its integration in electric power
systems, Energy transition, Grid flexibility https://users.ugent.be/~lvdveld/
Guillaume
Crevecoeur
Full ProfessorSignals and systems, Sensing, estimation and actuating,
Automation and control systems, Automation, feedback
control and robotics, Systems theory, modelling and identification , Kinematics and
dynamics, Physical system modelling