Spatial Knowledge Discovery through an
Integration of Visual Data Exploration with Data Mining
Cristiano Giovando* and Tong ZhangDepartment of Geography, San Diego State University 5500 Campanile Dr. San Diego, CA 92182-4493
Telephone: 6195945619 Fax: 619 594 4938 * Email: [email protected]
Abstract
The use of multi-dimensional abductive inference has been a challenge for geographers who are interested in discovering research hypotheses from data. This and other exploratory data mining techniques have attracted much attention and hype as spatial analysis tools for scouring large databases in search of interesting spatial data patterns. Progress in data mining, spatial statistics, and visualization algorithms has also created a challenge in choosing the right set of techniques and tools for data analysis.
In this paper we describe one approach to choosing abductive inference techniques dealing with the real-world problem of discovering transboundary migration patterns. The approach is based on the integration of visual data exploration with data mining algorithms. Data visualization leads to clues about data patterns, and the clues guide data mining searches.
The results of data mining are then visualized, leading to additional clues and more tangible research hypotheses. We present the application of the approach and discuss its potential for guiding the selection of data mining and visualization techniques for effective spatial knowledge discovery.
Keywords: visualization, data mining, visual data exploration, migration
1. INTRODUCTION
Currently, geographers are at a point where they are no longer desperate for geo-referenced data. Rather, geographers have urgent needs for new methods and tools to deal with the increasing amount of geo-referenced data due to the development of data collection techniques (i.e. remote sensing, mobile GIS, GPS devices, and other sensors) (Miller and Han 2000, 2001). Data mining has proven its capabilities to outperform traditional spatial analysis and statistical methods with better scalability (scale well to large database), strong fault tolerance (accommodate uncertainty of datasets), and more importantly, the capability of inference/reasoning tasks (Miller and Han 2001; Eklund et al. 1998). Therefore, over the last decade, increasing efforts have been put into applying data mining techniques to handle the complexity of geo-spatial problems. The early pilot studies were conducted in the computer science community (Koperski and Han 1995; Ester et al. 1995, 1996, 1997, 1998, 1999; Koperski et al. 1996; Han et al. 1997; Ankerst 1999; Zhou et al.
data.
These efforts covered a range of spatial classification, association rule extraction, clustering analysis, outlier analysis and trend detection opening new possibilities for inductive spatial reasoning in the process of exploring both spatial and non-spatial attribute spaces. These possibilities, as well as potential theoretical issues, were illustrated by Mille and Han (2001), Yuan et al. (2001), and Gehegan (2001) within the geography community. Geographers also realized potential advantages resulting from integrating data mining methods with
geovisualization tools to support human pattern-identifying abilities (Mill and Han 2001). Research on the integration of geovisualization and data mining to facilitate both theoretical and applied problem explorations was reported by MacEachren et al. 1999 andGahegan et al. 2001. So far, these efforts have shown that the integration of visualization with data mining paradigm can be an effective approach to exploring geo-spatial problems, in addition to algorithm-driven data-mining techniques developed by computer science community.
This paper discusses the role that geovisualization plays to assist data mining in the real-world problem of discovering transboundary migration patterns. Geovisualization reveals clues about data patterns, which then guide data mining searches. The results of data mining are then visualized, leading to additional clues and more tangible research hypotheses. This evolving and interactive data pattern-searching approach has been proven effective in our applications. The US-Mexico border enforcement case study is described in Section 2 and it is followed by an overview of our approach in Section 3. In Section 4, we present and evaluate the analysis results of the approach, and close with the discussion of its potential for guiding the selection of data mining and visualization techniques for effective spatial knowledge discovery.
2. Problem Background
Undocumented immigration is a major concern for government agencies both in the US and Mexico. Using data from Mexico and the United States, Massey et al (2001) define Mexican migration to the US as an example of “remarkable continuity” over time. This phenomenon has direct implications not only for social and security issues, but also for local and national
economics (Hanson 2001). US government agencies, together with the Border Patrol (BP), enforce the patrolling of the border region to prevent undocumented migrant crossing and smuggling activity. In recent years,fences, infrared cameras, and increased border patrol units, along with lights have been added under the programs of Operation Gatekeeper, Operation Hold the Line and Operation Rio Grande (Stoddard 2001). The result has been to drive many
undocumented border crossers to more difficult terrain, increasing the death rates of illegal immigrants (Burr 2001).
The objective of our research, within the NASA-funded REASoN (Research, Education and Applications Solution Network) project has been to assist in the development a Border Spatial Decision Support System (BSDSS) for allocating and deploying resources to secure the US borders. Building an effective BSDSS means to utilize existing information to predict future trends and to discover patterns in transboundary migration dynamics. So far, the questions addressed by this research are about possible trends in migrations patterns. For example, what type of association exists between the origin in Mexico and the apprehension locations in the US? Or, how do migrants and smugglers change their behavior in space and time? And finally, do data mining techniques, together with spatial analysis, provide a sufficient way to discover these
patterns?
Large datasets of apprehension events have been collected by BP agents during the last three years (2002-2004). Every record has forty different variables and geographic coordinates
collected with GPS units. The challenge in our project has been to apply selected data mining techniques and spatial visualization methods in the analysis of datasets, and obtain asnwers for the questions stated above.
To answer research questions, it is critical to break them down to sub-questions and formulate hypotheses based on the data available.
The formulation of hypotheses requires early knowledge construction of the problems at hand. In order to gain necessary knowledge for hypotheses formulation it is of central importance to focus on the exploratory analysis of data to begin knowledge construction leading to the formulation of hypotheses.
Exploratory data analysis in our study included the following steps:
Data cleaning and preprocessing;
Variable encoding and derivation;
Descriptive and comparative statistics analysis;
Creating spatial data based on apprehension attribute data and geographic coordinates;
Initialanalysis including density analysis, time series analysis, origin tracking, role and recidivism analysis, movement simulation, disposition analysis, and environmental factor analysis.
In nearly every analysis task, the visual exploratory data analysis has to be used in
combination with spatial statistical analysis and data mining. We found that visualizing maps in concert with graphs has been particularly helpful to comprehend the situation and generate new hypotheses in light of observed patterns.
With the experiences gained from data exploration, hypotheses falling into six categories (why, where, who, how, changes, other) were formulated:
A. WHY
What motivates immigrants to move across the border and try to enter US territory?
Where do they come from in Mexico? Are there any particular situations in those areas that drive people out of their hometowns?
B. WHERE
Where have they been apprehended in the US? Are there hot spots where immigrants are more likely to cross the border or to be caught?
Are there any correlations between the apprehension locations and the infrastructure/environment in those areas?
C. WHO
What attributes could be used to better describe the offenders? (age, origin, role, etc. ) Is it possible to cluster these border crossers with some criterion?
Can we trace down and identify the smuggling organizers behind the seemingly random data?
D. HOW
How do people cross the border? Is there a correlation between the origin in Mexico and the apprehension location in the US? Can we simulate some routes?
Is there any environmental influence on the routes?
Is there any rule for paying smuggling fees and does it vary with different times, locations, or organizations?
E. CHANGES
How does the flow of immigrants change over time and space?
Do the smugglers change their behavior to avoid the enforcement by the BP or other agencies (arrest methods)?
What are the underlying factors that cause the changes in movements? Are the changes of the patterns reflected by political/social/economic events in Mexico?
F. OTHER
Which variables are useful for the analysis and improvement of a BSDSS?
Based on our investigation, which additional information may be useful for the BP to collect during apprehensions?
3. METHODOLOGY
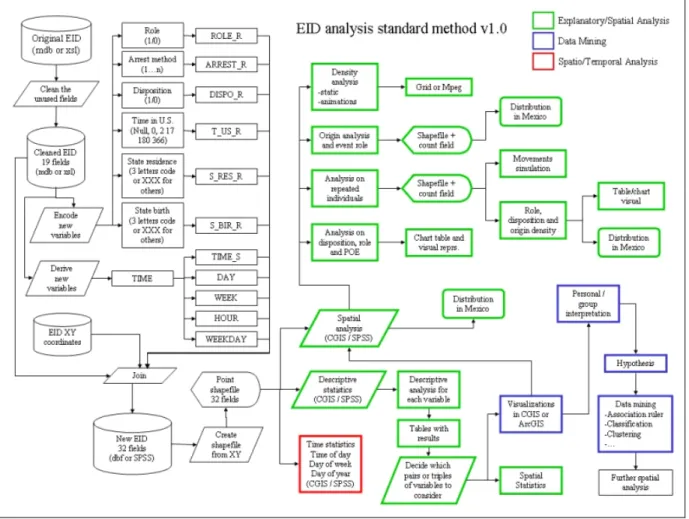
3.1 A Standard Data Analysis Procedure
In order to follow a methodological approach in our analyses of the datasets received from the BP, we defined a standard procedure, which can be adopted for a preliminary report on the basic trends of the period analyzed. First of all, some fields that are considered not useful are deleted and many records cleaned to make the dataset consistent. The process of cleaning includes removing those cases of individuals without a fingerprint record, which is considered as unique identifier for avoiding ambiguity in further analysis. The following steps regard the derivation of other variables (“time of day” and “day of the week”) and the recoding of some of the nominal variables into ordinal or dual values. Restructuring the datasets to accomplish the specific needs of our analysis is fundamental to perform correct and rigorous investigation.
The following steps include typical spatial analysis and statistical preliminary investigations. Descriptive statistical tools available with the software, SPSS, allow us to understand the
consistency and the range of the considered numerical variables. Specifically, only the variables related to age, the cost paid to the smugglers, the time spent in US, and the distance form the border have numerical attributes. In this case we consider the mean, the range, and the minimum/maximum values to assess the variable.
Most of the other attributes are nominal and have been described using general count and percent indexes, as well as a cross-tabulation comparison to discover significant association values. Finally, the time variables have been plotted and subset into smaller frames of three months to reduce the whole dataset into smaller but significant units of analysis.
The dataset is then georeferenced, meaning that two additional fields with the geographic coordinates of apprehension events are added. This provides the ability to display the data within a GIS environment and perform more interesting analyses including the “spatial” factor.
Figure 1: EID Analysis Standard Procedure
3.2 Visualization Methods
Visualization plays a fundamental role in our analysis. Several tools have been tested to determine their suitability for the type of data used. Tables are easily handled in SPSS and can be described with a well-known set of indexes such as mean, variance, range, etc. In the case of large and multivariate datasets, which is the case in our study, it is important to be able to describe the possible relationships between the values and eventually discover clusters of data.
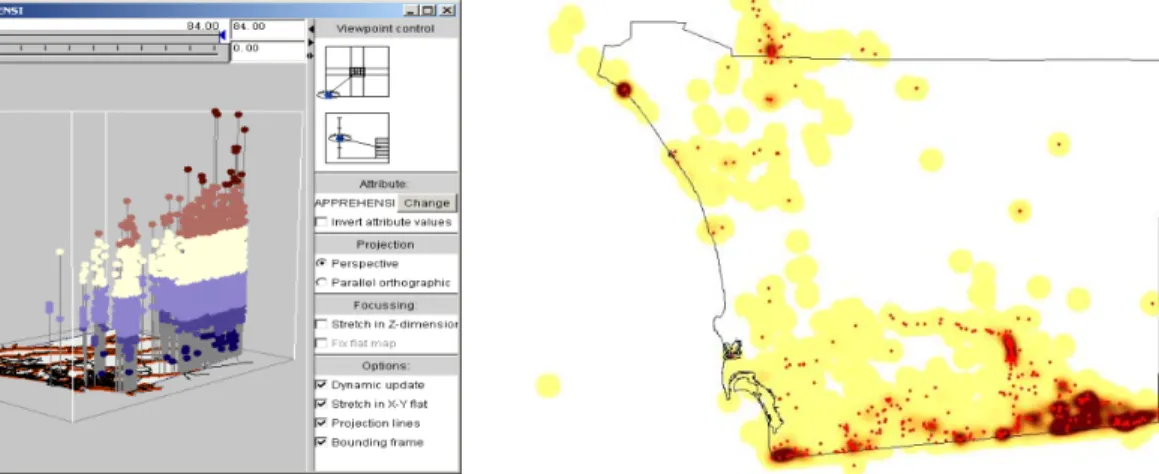
Within CommonGIS, a freely available Java software for geographic and geo-statistical analysis, it is possible to plot multivariable GIS datasets into 3D views, overlaying the results with other layers and information. This has revealed, for example, the tendency of undocumented immigrants to enter the US in more interior areas, when they are between the ages of 18 and 27 years old. Most older and younger individuals are usually stopped closer to the border.
One other interesting combination of GIS tools with statistical analysis exists in the
representation of the spatial distribution of the density of apprehension events over a time frame. Moreover, by combining different periods together, it is possible to create animations of change of density over a longer period of time, using weekly or monthly data as units for the frames.
Figure 2: 3D Visualization of Apprehension Age Figure 3: Animations of Density Change (Snapshot)
To display the change and variability in time of the total number of apprehensions or of repeated individuals, some common graph tools have been used to create bar charts, line graphs, pie charts, etc. The results can be combined with GIS tools and the following results can be assigned to a spatial sector of the field of study. For example, a series of bar charts can be displayed over a map of Mexican states to describe the change in migration patterns over each state.
3.3 Data Mining Methods
Due to the large amount of apprehension data used in this study, the data reduction method of classification might help reveal patterns otherwise hidden by noise data. The typical classification technique is decision tree algorithm. The trained modal can identify minimum variables to explain some phenomena. It also helps to focus on smaller areas and identify dependencies between variables. The following figure shows a portion of a trained classifier modal.
Figure 4: Decision Tree Classifier Modal Figure 5: Clustering Analysis of “Apprehension age”
high-smuggling cost subjects (APPREHENDI = CHU/S --- SMUGGLED-C>1100).
Clustering and outlier analysis can find clusters of points with similar value magnitude, and outlier points, which are unlike points in clusters. Local Moran’I (Anselin 1995) can be used to test local spatial autocorrelations, which reveal local clusters and outliers. For example, for variable “Apprehension age”, Figure 5 indicates that regarding apprehension age, the several low right points have relatively low index values. This means that the apprehension ages of these subjects are very different (negative index values). On the other hand, if the index value is positive, then that subject should have values similar to neighboring subjects’ values.
There are more than 30 variables existing in the dataset. The high dimensionality complicates the analysis task by introducing more associations between variables, more casual-effect relations, and more computational burdens when doing visualization or data mining. Finding associations between these seemingly unrelated variables thus requires more intelligent and automatic strategies. The “association rules” data mining method is targeted at extracting underlying relations from datasets.
These are typical rules mined:
1. APPREHENDI=CAO/S 2708 ==> DIR_FROM_P=E 2698 conf:(1)
2. GENDER=Male APPREHENDI=CAO/S 2318 ==> DIR_FROM_P=E 2309 conf:(1) 3. GENDER=Male APPREHENDI=BLV/S 1706 ==> DIR_FROM_P=E 1663 conf:(0.97) 4. APPREHENDI=BLV/S 2051 ==> DIR_FROM_P=E 1997 conf:(0.97)
The rules show that there are strong relations between “apprehending sites” and “direction from the POE”.
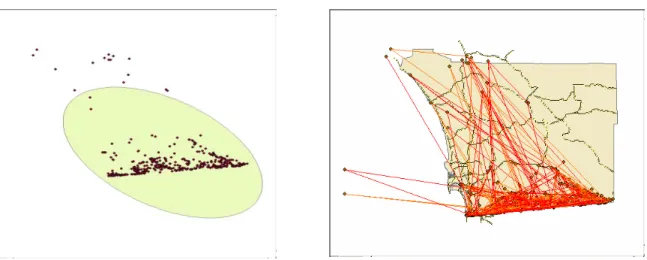
Bayesian statistics provide a framework for combining relative values of being right or wrong (subjective probabilities) with the probabilities of being right of wrong (conditional probabilities). It relies upon state-conditional probability density functions, the a priori probability of a state, and the a posteriori probability of each state, given certain conditions. The independent dataset, consisting of the geographic locations of apprehensions of undocumented immigrants, is a set of points collected with GPS devices by the BP agents. This dataset includes points of known locations, but does not provide any information regarding absence of apprehensions (because they evidently did not happen). Yet this does not mean that undocumented immigrants would not be using other paths or disperse over locations not included in the available dataset. For this reason, a Bayesian method of “presence and random sample” is used to generate a harmonized set of apprehension locations.
Figure 6: Trend Detection Figure 7: Movements Simulation
In Figure 6, the map shows an ellipse (standard deviational ellipse) which presents the point distribution pattern. The axes of this ellipse are derived from the calculation of the standard deviation of the x-coordinates and y-coordinates from the mean center.
In Figure 7, the simulated route map is produced by summarizing the recidivists’ movement history.
3.4 Using Visualization to Guide Data Mining and Abductive Inference
During multi-dimensional abductive inference, visualization is of central importance to help build hypotheses. Geovisualization reveals clues about data patterns which then guide data mining searches. The results of data mining are then visualized, leading to additional clues and more tangible research hypotheses. This evolving and interactive data pattern-searching approach has been proven effective in our applications. In our case, there are more than 140,000 records in the enforcement database for the 2002-2004 fiscal years.
The dataset is also high-dimensional, including more than 40 variables. These variables describe all kinds of personal information as well as apprehension information for every single subject. From the very beginning of the data analysis, very few patterns and structures underlying these data can be known.
Our goals are to generalize human behavior in these transboundary events, track the moving trend of undocumented immigration, and then find out how criminals operate. For achieving these goals, visualization is appropriate, for pre-screening unnecessary noise and for providing an overview of the dataset from specific perspectives.
After data cleaning and variable derivation (for better visualization), we conducted a series of descriptive analysis for as many individual variables as possible. In this stage, only one or two variables were included in visualization. Generally, visualization is good for processing low-dimensional datasets, while data mining can extract patterns from relatively
high-dimensional datasets. Thus, we adopted the strategy of starting from visualizing the single variable to getting basic facts about the analysis scenario. Then, based on the preliminary picture gained in our mind, some hypotheses can be generated between a specific subset of variables.
hypotheses and derive more information from them. Usually, the rules derived by classification algorithms (such as decision tree) are too detailed and include many noises (statistically
insignificant). Visualization methods are again employed to eliminate anomalies and guide the analysis to focus on specific data subsets within smaller areas or time frames. If necessary, the previous general patterns uncovered by visualizing single or subset variables can be reviewed to verify newly found patterns. Combining the general and detailed patterns together, we have some clues to lead us into new hypotheses.
After successfully identifying much smaller datasets by focusing on some specific areas and time frames, we turned our attention to review the immigration studies carried out by sociologists. This effort brings domain knowledge into our data exploration task. Since more than 96% of apprehended subjects came from Mexico, we primarily concentrated on Mexico-US migration studies. At this stage, we not only assimilated new pieces of information, which helped us have a better understanding of Mexican-US immigration history, enforcement policy and impact on society, but we also looked into the problems from the Mexican perspective. The push factors of this immigration trend are absolutely worth studying. We have collected demographic data down to the Municipios level. These data, when integrated with the patterns extracted from the
enforcement dataset, can help generate more hypotheses about the linkages of the origins in Mexico with the destinations in the US. In our case, we formulated a series of research questions (see Section 3), as well as new hypotheses based on our prior analysis and Mexican immigration studies. For example, when reading “Controlling 'Unwanted' Immigration: Lessons from the United States” (Cornelius 2004), the author introduced the following facts: “Steel fences were set up in San Diego and other urban areas, though professional smugglers are still trying to break through them by digging tunnels. Some immigrants even climbed over the fences. Some just tried their luck in undeveloped areas.
The Border patrol thus continues to improve and enhance their equipment (border fencing extensions, lights and surveillance videos, as well as helicopter patrols or even unmanned plans)”. This leads us to another hypothesis: can we judge which subjects are more professionally
organized by the analysis of their border crossing methods? A suggested solution can be: there are “arrest methods” and “apprehension status” variables that may help us differentiate sporadic and professional immigrant groups.
With new generated hypotheses, we can proceed to iterative data exploration by combining data mining and visualization methods. Data mining methods are used to analyze data subsets given certain hypotheses. The intermediate results are fed into visualization methods for verification purposes. The analysts can meet once a set of hypotheses are generated and tested. They will determine how to proceed with alternative data mining or visualization methods on alternative data/variable subsets, or reach a consensus that new knowledge construction is finished. In this interactive and iterative process, the prior patterns can always be integrated for reference. New constructed knowledge can be added into domain knowledge as final analysis results. The interpretation of intermediate results can be exploited for postulating new hypotheses.
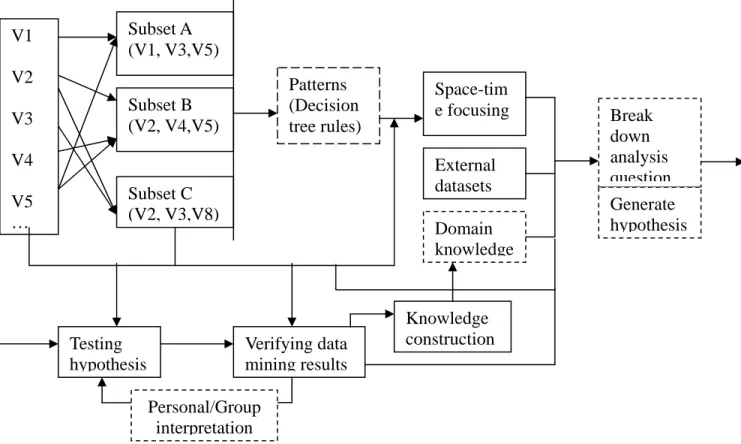
Based on our experiences, we propose the following framework for integrating visualization and data mining in the abductive inference stage of multi-dimensional data analysis.
Figure 8: Analysis Framework Integrating Visualization and Data Mining
4. CONCLUSIONS
In this paper, we describe the integration of visualization and data mining for data analysis in a transboundary migration scenario. Visualization functions as a front-end tool for subsequent data mining. Also, visualization can validate intermediate results of previous data mining. The entire process of spatial knowledge discovery is evolving, due to the incorporation of more patterns and the elimination of errors and anomalies.
Abductive inference is always a challenge when facing an ill-structured problem. We derive a framework for abductive inference by integrating visualization and data mining methods. This framework proves to be effective in our data analysis. We will proceed to verify current hypotheses using visualization and data mining methods.
REFERENCES
Anselin, L. 1995. Local indicators of spatial association — LISA. Geographical Analysis 27: 93–115.
Ankerst M., M. M. Breunig, H.-P. Kriegel, and J. Sander. 1999. OPTICS: Ordering points to identify the clustering structure. In Proceedings of ACM SIGMOD International Conference on Management of Data (SIGMOD'99), Philadelphia, PA: 49-60.
Burr, C. 2001. Deaths on the border, illegal immigration and operation gatekeeper. Journal of Empirical Economic Perspectives to Encourage Research by Students, fall 2001: 1–19
Subset A (V1, V3,V5) V1 V2 V3 V4 V5 … Subset B (V2, V4,V5) Subset C (V2, V3,V8) Patterns (Decision tree rules) Space-tim e focusing Domain knowledge External datasets Break down analysis question Generate hypothesis Testing hypothesis Verifying data mining results Knowledge construction Personal/Group interpretation
[On-line]. Available: www.sandiego.edu/JEEPERS.
Cornelius, W. A. 2004. Controlling “Unwanted” Immigration: Lessons from the United States. CCIS Working Paper 92.
Eklund, P. W., S.D. Kirkby, and A. Salim. 1998. Data mining and soil salinity analysis. International Journal of Geographical Information Science 12: 247-268.
Ester M., H.-P. Kriegel, and X. Xu. 1995. Knowledge discovery in large spatial databases: focusing techniques for efficient class identification. In Proceedings of 4th International Symposium on Large Spatial Databases (SSD'95), Portland, ME, 1995, in: Lecture Notes in Computer Science 591: 67-82.
Ester M., H.-P. Kriegel, J. Sander, and X. Xu. 1996. A density-based algorithm for discovering clusters in large spatial databases with noise. In Proceedings of 2nd International Conference on Knowledge Discovery and Data Mining (KDD'96), Portland, OR: 226-231.
Ester M., H.-P. Kriegel, and J. Sander. 1997. Spatial data mining: A database approach. In Proceedings of 5th International Symposium on Large Spatial Databases (SSD'97), Berlin, Germany: 47-66.
Ester M., H.-P. Kriegel, J. Sander, and X. Xu. 1997. Density-connected sets and their application for trend detection in spatial databases. In Proceedings of 3rd International Conference on Knowledge Discovery and Data Mining (KDD'97), Newport Beach, CA: 10-15.
Ester M., H.-P. Kriegel, J. Sander and X. Xu. 1998. Clustering for mining in large spatial databases. KI-Journal (Special Issue on Data Mining) 1: 18-24.
Ester M., S. Gundlach, H.-P. Kriegel, and J. Sander. 1999. Database primitives for spatial data mining. In Proceedings of International Conference on Databases in Office, Engineering and Science, Freiburg, Germany: 137-150.
Gahegan, M., M. Wachowicz, M. Harrower, and T.-M. Rhyne. 2001. The integration of geographic visualization with knowledge discovery in databases and geocomputation.
Cartography and Geographic Information Systems (special issue on the ICA research agenda) 28(1): 29-44.
Gahegan, M. 2001. Data mining and knowledge discovery in the geographical domain. White Paper: National Academies - Computer Science and Telecommunications Board. Intersection of Geospatial Information and Information Technology: Content and Knowledge Distillation. Gordon, H. H. 2001. U.S.– Mexico integration and regional economies: Evidence from
border-city pairs. Journal of Urban Economics 50: 259-287.
Han, J., K. Koperski, and N. Stefanovic. 1997. GeoMiner: A system prototype for spatial data mining. In Proceedings of 1997 ACM-SIGMOD International Conference On Management of Data (SIGMOD’97), Tucson, Arizona, (System prototype demonstration).
Koperski, K., and J. Han. 1995. Discovery of spatial association rules in geographic information databases. In Proceedings of 4th International Symposium on Large Spatial Databases, SSD95, Maine: 47-66.
Koperski, K., J. Adhikary, and J. Han. 1996. Spatial data mining: progress and challenges - survey paper. SIGMOD'96 Workshop on Research Issues on Data Mining and Knowledge Discovery (DMKD'96), Montreal, Canada.
MacEachren, A. M., M. Wachowicz, R. Edsall, D. Haug, and R. Masters. 1999. Constructing knowledge from multivariate spatio-temporal data: integrating geographical visualization with knowledge discovery in database methods. International Journal of Geographic Information Science, 13(4): 311- 334.
empirical, and policy analysis. American Journal of Sociology 102(4): 939-999.
Miller, H.J., and J. Han. 2001. Geographic data mining and knowledge discovery: an overview. In Miller, HJ and Han, J. (eds.) Geographic data mining and knowledge discovery. London, New York: Taylor & Francis, 3-32.
Miller, H. J. and J. Han. 2000. Discovering geographic knowledge in data rich environments: A report on a specialist meeting. SIGKDD Explorations: Newsletter of the Association for Computing Machinery, Special Interest Group on Knowledge Discovery and Data Mining 1(2): 105-108;
Stoddard, E. R. 2001. U.S.-Mexico borderlands issues: The bi-national boundary, immigration and economic policies. El Paso, Tex: The Promotory.
Tung, A., J. Hou, and J. Han. 2000. COE: clustering with obstacles entities, a preliminary study. In Proceedings of 2000 Pacific-Asia Conference on Knowledge Discovery and Data Mining (PAKDD'00), Kyoto, Japan.
Takatsuka, M, and M. Gahegan. 2001. Sharing exploratory geospatial analysis and decision making using GeoVISTA Studio: from a desktop to the web. Journal of Geographical Information and Decision Analysis, 5(2): 129-139.
Yuan, M., B. Buttenfield, M. Gahegan, and H. Miller. 2001. Geospatial data mining and knowledge discovery. A UCGIS White Paper on Emergent Research Themes.
Zhou, X., D. Truffet, and J. Han. 1999. Efficient polygon amalgamation methods for spatial OLAP and
spatial data mining. In 6th International Symposium on Spatial Databases (SSD’ 99). Hong Kong, China. In Lecture Notes in Computer Science 1651: 167-187.