Exploiting Renewable sources: when Green SLA
becomes a possible reality in Cloud computing
Md Sabbir Hasan, Yousri Kouki, Thomas Ledoux, Jean-Louis Pazat
To cite this version:
Md Sabbir Hasan, Yousri Kouki, Thomas Ledoux, Jean-Louis Pazat. Exploiting Renewable
sources: when Green SLA becomes a possible reality in Cloud computing. IEEE Transactions
on Cloud Computing, 2015, PP (99), pp.1.
<
10.1109/TCC.2015.2459710
>
.
<
hal-01187907
>
HAL Id: hal-01187907
https://hal.archives-ouvertes.fr/hal-01187907
Submitted on 15 Mar 2016
HAL
is a multi-disciplinary open access
archive for the deposit and dissemination of
sci-entific research documents, whether they are
pub-lished or not.
The documents may come from
teaching and research institutions in France or
abroad, or from public or private research centers.
L’archive ouverte pluridisciplinaire
HAL
, est
destin´
ee au d´
epˆ
ot et `
a la diffusion de documents
scientifiques de niveau recherche, publi´
es ou non,
´
emanant des ´
etablissements d’enseignement et de
recherche fran¸cais ou ´
etrangers, des laboratoires
publics ou priv´
es.
Exploiting Renewable sources: when Green SLA
becomes a possible reality in Cloud computing
Md Sabbir Hasan, Yousri Kouki, Thomas Ledoux, and Jean Louis Pazat
Abstract—While the proliferation of Cloud services have greatly impacted our society, how green are these services is yet to be answered. Although, demand escalation for green services has grown due to societal awareness, the approaches to provide green services and establish Green SLAs remain oblivious for cloud or infrastructure providers. The main challenge for cloud provider is to manage Green SLAs with their customers while satisfying their business objectives, such as maximizing profits by lowering
expenditure for green energy. Since,Green SLAneeds to be proposed based on the presence of green energy, the intermittent nature of renewable sources makes it difficult to be achieved. In response, this paper presents a scheme for green energy management in the presence of explicit and implicit integration of renewable energy in data center. More specifically we propose three contributions: i) we introduce the concept of virtualization of green energy to address the uncertainty of green energy availability, ii) we extend the Cloud Service Level Agreement (CSLA) language to supportGreen SLAby introducing two new threshold parameters and iii) we introduce
greenSLAalgorithm which leverages the concept of virtualization of green energy to provide per interval specificGreen SLA.
Experiments were conducted with real workload profile from PlanetLab and server power model from SPECpower to demonstrate that,
Green SLAcan be successfully established and satisfied without incurring higher cost.
Index Terms—Cloud Computing, Sustainable Computing, Renewable Energy, Green Service Level Agreement, Cross-layer SLA
F
1
I
ntroduction
I
n 2007, data centers in Western Europe consumed awhopping 56 terawatt-hours (TWh) of power per year. According to the EU, this figure is likely to almost double to
104TWh by 20201. This translates into high carbon emissions
as most of the electricity comes from fossil fuel or coals, only exception in France where 85% electricity is produced by nuclear plants, causing relatively lower carbon footprint than any other country. Still, the amount of carbon footprint is nowhere near to zero.
Subsequently, similar to other large consumers of power, data centers find themselves increasingly pressured either by legislation or by public opinion to find options to reduce their carbon footprint. Therefore, demands for green prod-ucts and services are ever increasing as social awareness for being green is hiking. In response, the service providers have started to set sustainability goals and create initiatives to reduce carbon emissions by using renewable sources to
their services. Although several research efforts have been
made to reduce energy consumption by designing/imple-menting server consolidation, hardware with better
pow-er/performance tradeoffs, workload migration and software
• S. Hasan is with ASCOLA (EMN-INRIA, LINA) and MYRIADS
(IRISA-INRIA) Research Groups. INSA de Rennes, France. E-mail: [email protected]
• Y. Kouki and T. Ledoux are with ASCOLA Research Group EMN-INRIA,
LINA. Ecole des Mines de Nantes, France. E-mail: [email protected]
• J. L. Pazat is with the MYRIADS Research Group, INSA, INRIA, IRISA.
Rennes, France.
E-mail: [email protected]
1. European Commission, Code of Conduct on Data centers Energy
Efficiency- Version 1.0, October 30, 2008
technique for energy aware scheduling, still the goal for al-leviating carbon footprint is being underachieved. Given the circumstances, explicit or implicit integration of renewable energy to the data center can be the only way to reduce carbon footprint at an acceptable level. Besides that, demand for green services is ever increasing, thus integrating renew-able sources to the data center left no choice. Few smaller
green cloud providers, e.g., GreenQloud2, Green House
Data3 and academic researchers [1] integrated renewable
sources to the data center explicitly which offers green
com-puting services. However, renewable sources are known to be very intermittent in nature, thus providing Green services or running Servers and Virtual machines (VMs) only by on-site renewable energy becomes very unrealistic. Moreover, some research efforts have also explored how to incorporate
off-site renewable energy to data center, as the best location
for producing renewable energy does not always have the best potential to build a data center. Transporting the off-site energy is arduous as wheeling charge imposed by the Grid might be more than the expectation and power losses through transmission lines are inevitable. Besides the above explicit involvement, some implicit options for reducing carbon footprint also exist through renewable energy cer-tificate (REC) and power purchasing agreement (PPA). As example, tech giant companies like Google and Apple are investing to nearby big wind and solar plants through PPA to reduce their carbon footprint. On the other hand, REC is a tradable commodity proving that, electricity was generated using renewable sources. Therefore, purchasing of a green certificate equals to purchasing a claim that the certificate owner consumed energy from the renewable portion of the
2. https://www.greenqloud.com/
whole energy grid [2].
Considering all the above implicit and explicit green energy integration option to data center, any service providers are yet to propose Service Level Agreement (SLA) based on green energy availability with their infrastructure. Haque
et al. [1] first proposed Green SLA based on green energy
availability from on-site renewable plant where
environ-mental conscious clients can ask for differentiated green
services with varied green energy requirement. However, providing green service can be terminated or no additional green service request will be entertained when green energy is not available, which quantifies that, there is no evidence of having formal contracts establishment between
Software-as-a-Service (SaaS) providers/clients and
Infrastructure-as-a-Service (IaaS) providers.
To address this problem, we investigatedCloud Energy
Brokerin our previous work [4] and now are extending our
research to proposeGreen SLAbased on the availability of
green energy by introducing the concept of Virtualization of green energy. The energy can be virtually green for a specific period of time if abundance of green energy is available aperiodically in shorter time interval along with the deficit of green energy in rest of the time frame. Therefore, the virtualization concept can increase the greenness of energy, rather increasing the amount of green energy. Concretely, when the availability of green energy is more than demand, we use the whole portion of available green energy but characterize the interval as surplus interval. When green
energy is insufficient to meet the demand, we nullify the
degraded interval with the surplus interval. We use the
term virtualization because we nullify a degraded interval
(lack of green energy) with a surplus interval (excessive green energy than demand), but from the client’s or SaaS provider’s perspective, they realize both the interval as ideal interval (when supply meet the demand), though the green energy was not present instantaneously rather present virtually. Figure 1 shows the visualization of our approach.
In our proposed approach,Green SLAcan be monitored and
evaluated per interval (time slot) rather per-request or appli-cation. Furthermore, we extend CSLA [3], the Cloud Service Level Agreement language allowing to define SLA in any
language for any Cloud service (XaaS) to supportGreen SLA
based on the concept of virtualization of green energy. The proposed new version expresses a Service Level Objective (SLO) using two thresholds and supports a new class:’the surplus’ that is characterized to nullify degraded interval. Besides, the nullification process reflects the instability of
green energy as well. Furthermore, we introduce greenSLA
algorithm which leverages the concept of virtualization of green energy and CSLA extension to validate our proposal. For experiment purpose, real workload profile from
Planet-Lab and server power model from SPECpower benchmark4
were traced for conducting experiments. Results
demon-strate that, Green SLA can be successfully established and
satisfied without incurring higher cost for total energy ex-penditure.
The rest of this paper is organized as follows. Section 2 illustrates the background and motivation, which is used to ease the understanding of our approach. Section 3 describes
4. https://www.spec.org/power ssj2008/ Surplus Degraded Ideal Ideal SaaS Provider IaaS Provider t Energy (kwh) Total energy demand Green energy demand
Energy is virtually green
Fig. 1: Concept of Virtualize green energy
the system model and the algorithmic solution. The results obtained from experimental evaluation are presented and discussed in Section 4. Section 5 provides a selection of rele-vant work related to this paper. Finally, Section 6 concludes this paper and provides some discussion on future work.
2
B
ackground and motivation
The Cloud architecture is usually composed of several XaaS layers and SLAs are characterized at various levels in this
stack to ensure the expected QoS for different
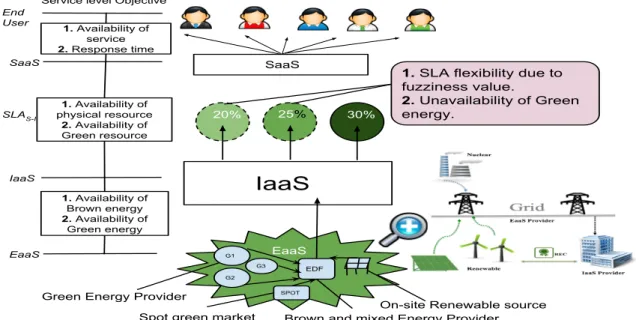
stakehold-ers. As shown in Figure 2, an end-user is a client of the SaaS provider, which is itself a client of the IaaS provider and as well as for Energy-as-a-Service (EaaS) provider. We investigated Service level objective (SLO) for every layer and presented in the Figure 2. Availability of resource and response time are treated as the basic SLO between end client and SaaS provider. On the other hand, availability of physical resources were the only objective so far in between the SaaS and IaaS layer, but we proclaim to create a new class of SLO, which should be treated based on green energy availability. Depending on the requirement from the upper layer, IaaS provider can have a formal contract with EaaS providers to have a portion of brown and green energy to fulfill its contracted SLA to the upper layers e.g., SaaS provider, end client. Therefore, we discuss how SLA can be established based on green energy, what are the green energy sources we can exploit and how we can take leverage the concept of virtualization of green energy to satisfy the
Green SLA.
2.1 Green power-driven SLA
Due to the dynamic nature of the Cloud, SLA between consumers and providers emerge as a key aspect and SLA enforcement becomes an important challenge. Today’s re-search is more concentrated on Workload-driven SLA rather
than Power-driven SLA andGreenpower-driven SLA.
Usu-ally, Workload-driven SLA depends on end-users criteria such as availability, response time, throughput, etc. In con-trast, Power-driven approach implies, shifting or scheduling the deferrable workloads to the time period when the price of electricity is lower or migrating workloads to the different region (data center) where the electricity price is cheaper than the origin with respecting the deadline. On the con-trary, Green power-driven SLA can be realized as: end-users
or SaaS providers shift their workloads in a renewable/green energy powered data center having an agreement with IaaS provider that some portion of their workload should run in a greener environment. Existing literature does not provide a clear idea about the advantages and disadvantages of different integration option of renewable energy sources in data centers. Although some research [5][6][7][8] have explored the opportunity of integrating renewable sources in data center, but lacks the explanation of how SLA should be established between IaaS and SaaS providers based on the green energy availability.
To address this problem, we propose a green power driven SLA framework established between SaaS and IaaS provider stating that, IaaS provider provides infrastructure with proportional e.g., 30% green energy availability. For instance, IaaS provider will have a formal contract with SaaS provider to provide green infrastructure based on a business
model. In Figure 2,SLAS−I contract used for showing two
SLO of this layer, namely availability of physical resource and availability of green resource. Point to be noted that, a substantial amount of research [9][10][11][12][17][18] has been already done both in industry and academia about efficient dynamic consolidation of PM, migration of VM and scalability issues in Cloud infrastructure. In position to these existing research, our work can be seen as complemen-tary to their research since reducing energy consumption in infrastructure level and associating green sources can reduce carboon footprint in data center from the global point of view. Therefore, we are concerned about how to make a data center green and what are the options to make it possible by penetrating available green energy sources
based onGreen SLA, i.e., service level objectives about green
resource/energy. Indeed, we argue that Green SLA should
be established by taking into account the presence of green energy rather just reducing the energy consumption in the infrastructure level.
2.2 Green energy sources
From Figure 2, it can be shown that, the energy layer of the Cloud computing infrastructure consists of a single Grid
where several Green Energy-as-a-Service (GEaaS) providers
from REC market and green energy provider from spot market are connected. Additionally, on-site renewable en-ergy plant can be associated to the data center internally or externally through the same Grid.
• REC market: We exploit the REC market where
mul-tiple GEaaS providers produce energy and feed to the Grid. Considering the Cloud infrastructure as a stack of XaaS layers, a IaaS provider will buy a portion of green energy dynamically from those GEaaS providers to supply green computing services to the SaaS providers or their clients. As renewable energy sources are very intermittent in nature, the renewable energy-feeding price would be very differ-ent from one to another provider depending on the location of site, availability of sources (wind speed, solar irradiation, etc.) and capacity factor of the plant. Committing to a single provider might result un-availability of required green energy requirement for certain time frame thus ensuring certain percentage
of green energy availability in data center can not be met. Moreover, in deregulated electricity market, prices vary significantly during the day depend-ing on the energy generation and demand in the wholesale market [20]. As a consequence, most of the energy distribution company introduce different non-flat tariffs. Day-ahead pricing (DAP) is one of the many pricing methodology, which is widely used in deregulated electricity pricing market. In our previ-ous work [4], we consider different GEaaS providers, which update DAP with information including prob-able generation of Green energy, price and availabil-ity. Usually, GEaaS provider add their green energy production to the Grid and IaaS provider consume the purchased energy from the same Grid, since there is only a single Global Grid in European electricity market. How IaaS and GEaaS provider can have a formal contract regarding energy procurement, is elaborately discussed in our previous work [4] as well. Therefore, we purchased green energy before hand by forecasting the green energy demand of SaaS providers.
• Spot green energy market: Usually spot market posses
lesser amount of energy than regular energy or elec-tricity market and price tends to be higher than traditional or different non-flat tariffs. Spot market is very important for consumer (IaaS provider), if
the real-time energy/power demand is excessive than
the forecasted demand. Moreover, the actual demand cannot be known accurately in advance and any fore-casting technique provides at least some error
statis-tics. So, for fulfillment of Green SLA, IaaS provider
needs to purchase green energy from spot market if it is required.
• On-site renewable energy: Due to the growing demand
of green services, most of today’s green data centers adopted on-site renewable energy plant e.g., wind turbine, solar panel to meet the green energy de-mand. Nevertheless, the perfect place for construct-ing a renewable energy plant might not have the true potential to build a data center due the intermittent nature of the renewable sources. But having a small-scale renewable plant always gives the advantage to incorporate green energy to data center to fulfill at least the partial green energy demand if there is not
sufficient amount of energy in the REC or Spot green
energy market.
2.3 From energy storage to green energy virtualization
As renewable power sources are very intermittent in nature, hence predicting the amount of renewable energy produc-tion ahead of real time might demonstrate greater error statistics in data center. Nonetheless, excessive production of renewable energy can go to waste and sometimes might imbalance the Grid if the production becomes greater than the capacity. The later case doesn’t apply if the data cen-ter has a small-scale renewable source e.g., wind turbine, solar plant. One way to overcome the challenge is to use energy storage or battery to store this superfluous green energy which can be discharged later for peak shaving of
IaaS
30% SaaS G1 G2 G3 EDF EaaSGreen Energy Provider
Brown and mixed Energy Provider On-site Renewable source
Service level Objective
1. Availability of service 2. Response time 1. Availability of physical resource 2. Availability of Green resource 1. Availability of Brown energy 2. Availability of Green energy 25% 20% SLAS-I End User SaaS IaaS EaaS SPOT
Spot green market
1. SLA flexibility due to fuzziness value.
2. Unavailability of Green energy.
Fig. 2: Cross layer SLA
data center power demand or for fulfillment Green SLA
between IaaS and SaaS providers when renewable energy is needed but not available. Energy storage incurs additional costs to data centers cap-ex and op-ex, hence it is not an attractive solution for small-scale data centers. Moreover, storages have finite capacities to recharge energy and their
lifetime is a decreasing function of depth-of-discharge(DoD)
and charge/discharge cycles [22]. Usually DoD refers, how
much energy the battery has delivered.5 Therefore, if the
production of renewable energy is above the capacity of storage, remaining energy goes to waste. Even the state of
the art batteries have 80-85% [35] efficiency on charging
and discharging capabilities, which implies 28-36% loss of energy.
Then, how to manage unavailability of green resources at run-time if the storage approach has several drawbacks, if the on-site renewable energy or spot market productions are
insufficient? Our proposal is to smooth out the differences
between deficit and surplus of green energy production during a certain time window with the objective to obtain an summation superior to a certain threshold, which we refer
as Virtualization of green energy. Interestingly, this concept
does not increase the total energy consumption rather
in-creases the greenness of energy used in data center. In this
way real energy storage is not needed and neither of the
portion of renewable energy is wasted. Furthermore, total expenditure for energy purchasing can be reduced as no energy goes to waste and additional cost for using storage
is not needed. Obviously,Green SLAbetween IaaS and SaaS
providers can be fulfilled if the time-slot length is adapted. For example, if IaaS provider has established a SLA to SaaS provider to have some portion of green energy available for
each time slot e.g., T=30/60 minutes, it is possible to satisfy
the contract by using virtualization concept of green energy, which is elaborately explained in the next section.
5. It is not recommended to fully discharge batteries to 100%, other-wise it would shorten the life-cycle of batteries.
3
G
reen
SLA
enforcement
In this section, we first summarize our previous work and then sketch out the Cloud Service Level Agreement language (CSLA)[3] to show how it has been extended to
supportGreen SLAand the concept of virtual energy. Then,
we describe the model parameters and investigate the goal for cost reduction of spot green market as well as total energy expenditure by proposed algorithmic solution based
onGreen SLA.
3.1 Previous work
Due to two time-scale green energy market (REC and Spot) and aperiodic spikes of workload we have divided our proposed work in two phase named planning and
run-time phase. In planning phase [4], we proposed a Cloud
energy broker, which can adjust the availability and price
combination to buy green energy dynamically 24 hours before from the REC market to make data center green for a specific (as a example 30%) portion. We investigated a simplified power model from where we could formulated and predicted power demand of a data center for next 24 hours by evaluating 7 days of real data, traced from PlanetLab [21]. Our monitoring window length was one hour that provided almost accurate predicted information with fewer error statistics. We also have taken a realistic consideration that Green energy providers can publish a day ahead green energy generation and price per hour, which is a common practice at European electricity and energy market along with smart-grid environment. Our energy broker tried to maximize of using renewable energy under strict budget constraint whereas it also tries to minimize the use of brown energy by capping the limit of overall energy consumption of data center. Furthermore, how we manage the energy procurement and management in the
run-time phase based on our proposedGreen SLAapproach,
Fig. 3: SLO evaluation in CSLA
3.2 CSLA language
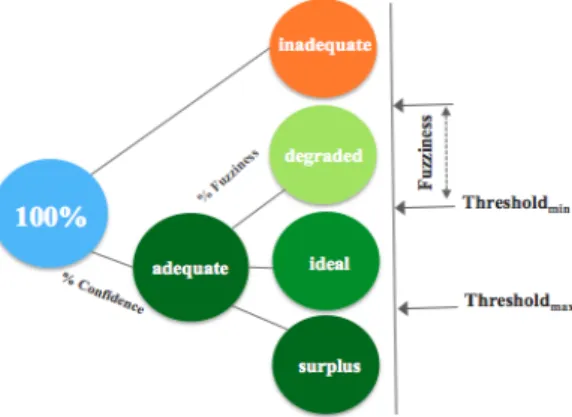
CSLA[3], the Cloud Service Level Agreement language, allows to define SLA in any language for any Cloud service (XaaS). CSLA addresses intrinsically (i) QoS uncertainty in unpredictable and dynamic environment; (ii) the cost model of Cloud computing. Indeed, CSLA allows the expression of sophisticated Service Level Objectives (SLOs) with new features such as confidence and fuzziness to deal with QoS uncertainty: (i) the fuzziness defines the acceptable margin degree around the threshold of an expression; (ii) the confidence defines the percentage of compliance of clauses. In order to evaluate an objective (SLO), an initial evalu-ation enables to classify the interval as ideal (i.e., threshold is respected), degraded (i.e., threshold is respected using fuzziness margin) or inadequate (i.e., threshold is not re-spected even with fuzziness margin). We distinguish two concepts: (i) per-interval evaluation, in which the evaluation is performed at the end of each interval; (ii) per-request evaluation, in which the objective is evaluated for each request. A final evaluation, at the end of the time window, allows one to verify an objective (SLO) by applying the fuzziness and confidence percentages to the initial evalu-ation. The final evaluation enables the identification of
non-accepted/accepted degradation and inadequate cases, that
is, that will/will not result penalties. In other words, the final evaluation absorbs or notifies the violations.
In this paper, in order to allow energy virtualization (since this concept is based on a certain time frame), we consider per-interval evaluation. Further, we extend CSLA
language to support theGreen SLAby taking the advantage
of the concept of virtualization of green energy. First, we
define an SLO by using two thresholds thresholdmin and
thresholdmax(see Figure 3). Secondly, beyond thethresholdmax,
we consider the intervals as surplus meaning that, excessive green energy was present in that interval. Finally, we add an intermediate step in the evaluation process. This step con-sists to update the intervals classes using the nullification of degraded intervals by surplus intervals i.e., for each surplus interval we translate a degraded interval to ideal interval.
Listing 1: CSLA example.
1 <csla:terms>
2 <csla:objective id=”GreenResourceSLO”actor=”IaasProvider”> 3 <csla:expression metric=”Gr”comparator=”in”threshold−min=”25”
threshold−max=”30”unit=”\%”monitoring=”Mon−1”Confidence=
”91,66”fuzziness−value=”5”fuzziness−percentage=”18,18”/>
4 </csla:objective>
5 </csla:terms>
6 <csla:penalties>
7 <csla:Penalty id=”p−Gr”objective=”GreenResourceSLO”condition=”
violation”obligation=”provider”>
8 ...
9 </csla:Penalty>
10 </csla:penalties>
In the example (see Listing 1), we focus on only one SLO about the percentage of green resources (lines 1-4). The SLO states that the percentage of green resources should be guaranteed between 25 and 30, with confidence, fuzziness
and percentage fuzziness of 91,66%, 5% and 18,18%,
re-spectively. In concrete terms, it means that the percentage of green resource measured within an observation period may
be i) lower then 20% in 8.34% of the observation periods, ii)
between 20% and 25% in 16,66% (91.66% of 18,18%) of the
observation periods and iii) greater or equal to 25% in 75%.
A violation of the GreenResourceSLOimplies a penalty that
depends on the green percentage not respected (lines 7-9). Using this objective for an evaluation window of 24 intervals, we accept 22 adequates intervals (18 ideal and surplus, 4 degraded) and 2 inadequates.
3.3 Supply side characteristics
We consider our system operates in discrete time model. From day ahead REC market, IaaS provider purchase green energy for next suitable time period e.g., 12 hours or 24 hours. Furthermore, for evaluation and validation of SLA by CSLA language we divide before mentioned time frame
int(t=12 or 24 hours time period). Moreover, the total time
is divided into J(J ∈ N+) coarse-grained time slots of each
length of T, accordance with the length of the day-ahead
REC market, e.g., minutes, hours in Figure 4. In addition,
each fine-grained time slotsτ, (τ=30 minutes) are treated
as monitoring window andtwhere, t= jT(j =1,2, ...,J),
can be defined as evaluation window for SLA validation in our model. IaaS provider purchase green energy from single or multiple REC providers (discussed in our prior work) in day ahead REC market for next 12 to 24 hours. So, for each
fine-grained time slot, we defined(τ) where,τ∈(t,t+T−1)
is purchased withPmax upper bound price. As we integrate
on-site renewable power source in our model, we consider
r(τ) amount of renewable energy is produced and added to
each fine-grained time slot. As renewable energy sources are
very intermittent in nature, we suggestr(τ) to ber(τ)≥0 for
each fine-grained slot meaning, renewable energy will not be available in some slots due to the sporadic nature of the source. Hence, the supply side consists of two independent
parts, e.g.,U(τ)=d(τ)+r(τ). As we consider, two time scale
renewable energy market, if the demand of renewable/green energy is greater than the supply, IaaS provider has to buy additional energy in real-time from REC market which tends to have higher price on average than day-ahead or long-term ahead market similar to real-time electricity market. This additional energy is regarded as spot energy. We define
s(τ) amount of renewable energy needs to be purchased
from real-time spot renewable energy REC market at price
β(τ)(O < β(τ) ≤ βmax) in each fine-grained time slot if required.
Class Class Class s d r t(jT) T Power supply at time slot to meet demand = T/2 =30 mn T = 60 mn j = (1,2,3,...,J)
Fig. 4: Supply side characteristics
3.4 Virtual energy model
At each fine-grained time slot, workload arrives with the requirement of green energy percentage e.g., 30%, that needed to be served and we define the request process
as e(τ). We assume, non renewable energy can be drawn
anytime from Grid if there is deficit of renewable energy in spot renewable energy market. Discussing about energy drawing from Grid market is out of the scope of this paper. Considering the demand and supply side, the ideal condi-tion would be meeting exact demand from the supply side :
U(τ)+s(τ) = e(τ) orU(τ)+s(τ) ≥ e(τ) suggesting, supply
might exceed the actual green energy demand in some slots. In our model, this superfluous energy will neither be stored in a storage nor be wasted, rather will be used as virtual energy in the data center. This additional energy will increase the percentage of green energy of the total
energy. Hence, we characterizeb(t) as the summation of all
available green energy [U(t)+s(t)] present in the slot and
define superfluous or virtual energyv(τ) as:
v(τ)= v ifb(τ)≥thrmax 0 otherwise (1)
3.5 Cost Minimization Problem of Spot Energy
As described in previous sub section, we consider, green energy demand, available green energy purchased from day-ahead renewable energy market and on-site plant,
mar-ket price of spot energy from a vector (e(τ),U(τ), β(τ)) and
e(τ),β(τ) isi.i.d over slots with some unknown probability
distribution. Furthermore,U(τ),e(τ) andβ(τ) are
determin-istically bounded by finite constraintsUmax,emaxandβmax, so
that: 0≤U(τ)<Umax,0≤e(τ)≤emax, and 0< β(τ)≤βmax,∀t
Now lettingQ(t) represent the total green energy request
in the queue on slot t, we will have following update
equation,
Q(t+1)=max[Q(t)−U(t)−s(t),0]+e(t) (2)
Heres(t) is a decision variable chosen in every slottto
stabilize theQ(t) depending on the current state of the queue
and vector(e(t),U(t), β(t)). We define a upper boundsmaxfor
s(t) as 0 ≤ s(t) ≤ smax. Hence, our objective is to design a
flexible and robust control policy for time varying systems to formalize the stochastic cost optimization problem for spot energy is mentioned below:
minimize Costav=lim
t→∞ 1 t t−1 X τ=0 E{β(τ)s(τ)} (3) subject to Q<∞, (4) 0≤s(τ)≤s max, ∀τ (5)
where,Q is the time average expected queue backlog,
defined as: Q=lim sup t→∞ 1 t t−1 X τ=0 E{Q(τ)}
Since the virtual energy can not be present in every slot, the current control decision is coupled with the future decisions. As example, the deficit of green energy in some slots may be larger and hence IaaS provider has to pay penalty to SaaS provider or to the end client. We pre-ferred Lyapunov optimization over dynamic programming to solve this optimization problem as dynamic program-ming requires significant statistics of demand and supply probabilities [23]. In contrast,Lyapunov framework has been
proven to be efficient to design control algorithms for before
mentioned constrained optimization without requiring a priori knowledge of demand and cost statistics.
We define a energy degraded aware virtual queueX(t)
and energy inadequacy aware virtual queueY(t) to measure
the backlog of energy deficits in the queue by tracking the number of slots when energy deficiency and virtual energy
is present. Moreover, forX(t), having energy deficiency and
presence of virtual energy can not occur simultaneously in a
slot. We propose two threshold parameterthrminandthrmax,
where thrmin < e(t) and e(t) < thrmax. For instance, in our
framework,thrminandthrmaxare 25% and 30% respectively.
The idea behind introducing the threshold parameters is to analyze whether any of the two events have occurred or not in the slot. When the supply side has lesser amount of
energy thanthrminvalue to meet green energy demand in a
slot, the slot is considered as a energy deficit slot. Hence, we
characterizeb(t) such a way that, it can be either in between
the value ofthrminandthrmin−f uzzinessValueor lower than
thrmin−f uzzinessValueor above the value ofthrminandthrmax
. Furthermore, in case of energy inadequacy aware virtual
queue, the maximum allowable slots when the value ofb(t)
lies onb(t)<(thrmin−f uzzinessValue), can be defined asNmax.
Therefore, the functionality of b(t) will depend on thrmin,
thrmaxandfuzziness valuewhich is constructed as:
f(b(t))= surplus(v(t)) when b(t)≥thr max
ideal when thrmin≤(b(t)≤thrmax
degraded if (thrmin−b(t))≤ f uzziness value
inadequate otherwise
(6) So, the functionality of b(t) indicates that when there is excessive green energy available in a slot that demanded en-ergy, we characterize those superflous energy slot as surplus energy slot. Furthermore, the update equation for energy degradation and energy adequacy aware virtual queue will be:
Y(t+1)=max[Y(t)−Nmax,0]+γb(t) (8)
where,γis a counter, which adds values to
correspond-ing parameter e.g., v(t),b(t) whenever it is present in the
queue. So, γ can be represent as γ{0,1}. In other sense,
γV(t+1)=[γV(t)+(V(t)>0)] andγb(t+1)=[γb(t)+(b(t)>
0)], which explains broadly the construction of equation (7) and equation (8).
3.6 Lyapunov Optimization
We define, Θ(t) = [Q(t),X(t)] as the concatenated vector
of actual and virtual queues. Moreover, the quadratic
Lya-punov function isL(Θ(t))=12[Q2(t)+X2(t)+Y2(t)]. So, theT
slot conditional Lyapunov drift is interpreted as:
∆(Θ(t))=E[L(Θ(t+T))−L(Θ(t))|Θ(t)] (9)
Following the Lyapunov framework of drift-plus-penalty algorithm [37], our algorithm designed to observe
the current queue states Q(t), X(t), Y(t) and the current
vector (e(τ),U(τ), β(τ)) and to make a decision ons(t) where
0≤s(t)≤smax, to minimize an upper bound on the following
expression in every T slots:
∆(Θ(t))+VE{
Xt+T−1
τ=t β(τ)s(τ) }
where, V is defined as a control variable as V > 0
which is chosen accordingly to IaaS providers goal to give different weights that affect operational cost and energy
deficiency trade-off. A large deficit of energy can reduce
the operational cost, but can have negative effects on green
energy requirement in data center resulting high percentage of SLA violation contracted between IaaS and SaaS provider. So, our approach consider to minimize a weighted sum of drift and penalty.
Theorem 1 (drift-plus-penalty bound). Let V > 0, T ≥ 1
andt= jT,τ∈[t,t+T−1]. For any control policy that
satisfies 0≤s(t)≤smaxfor alltand the demand backlog
isQ(t)<Qmax, the drift-plus-penalty satisfies:
∆(Θ(t))+VE{ Xt+T−1 τ=t β(τ)s(τ) |Θ(t)} ≤BT+VE{Xt+T −1 τ=t β(τ)s(τ) |Θ(t)} +E{ Xt+T−1 τ=t Q(τ)[e(τ) −U(τ)−s(τ)]|Θ(t)} +E{ Xt+T−1 τ=t X(τ)[γb(τ) −γv(τ)]|Θ(t)} +E{ Xt+T−1 τ=t Y(τ)[γb(τ) −Nmax]|Θ(t)} (10)
where,Bis a finite constant and compute the bound on
above drift-plus-penalty expression which is defined as:
B=1
2max[(bmax−Vmax)
2+(b
max−Nmax)2+(Umax−smax)2+e2max]
3.6.1 Dynamic Algorithm
We minimize the right hand side of drift-plus-penalty at
each fine-grained time slot τ ∈ [t,t+T−1] by observing
queue statisticsQ(τ),X(τ),Y(τ), green energy demande(τ),
renewable energy productionr(τ), spot green energy price
β(τ) and choosings(τ) according to the following
optimiza-tion: minimize t+T−1 X τ=t s(τ)[Vβ(τ)−Q(τ)] + t+T−1 X τ=t [(X(τ)+Y(τ))(γb(τ)−γv(τ))] subject to 0≤s(τ)≤smax, ∀τ t+T−1 X τ=t γb(τ)≤Nmax 3.6.2 Algorithmic solution
The proposed Lyapunov framework runs Algorithm 1 in
the background in a repetitive manner to ensureGreen SLA
according to the runtime context, namely the demand, the budget, the spot market and SLA. The Algorithm 1 triggers the purchasing method. More importantly, it indicates the real situation to purchase energy from spot green market. It
gives an edge over only choosingVparameter by procuring
energy only when it is necessary to fulfill the contracted SLA.
• interval class==inadequate: Line 2 of Algorithm 1
de-scribes theinterval.classfor being at ((thrmin−b(t)) >
f uzziness value) and if (γb(t) < Nmax), we update
the slot as green energy inadequate slot. Otherwise, we purchase energy referring to line 6 by triggering Algorithm 2.
• interval class==degraded: Line 9 of Algorithm 1
in-dicates interval.class for being at ((thrmin −b(t)) ≤
f uzziness value) and if any previous slot posses
vir-tual energyv(t), we nullify one degraded slot.
Con-trarily, line 17 triggers to Algorithm 2 for purchasing green energy if it is feasible.
• interval class==ideal: The interval.class in the line 20
indicates, if the value of b(t) lies between thrmin
and thrmax, no procurement is needed. But if
previ-ous degraded slots exceeded the threshold number
(degmax), we need to move to Algorithm 2 to purchase
green energy. The number of degraded slots might
be greater than the targeted degmax, only if there
is unavailability of green energy in the spot green market.
At the end, the algorithm updates the current intervals/
s-lots status to either inadequate/degraded/ideal or surplus.
We propose one method to purchase green energy from
the spot green energy market named buySpotMinCost (see
Algorithm 2). As the label suggests, the buySpotMinCost
insists to minimize the cost by purchasing green energy to switch from one class to the next in the order (inadequate, degraded, ideal, surplus). In addition, the purchasing de-cision is based on the penalty model, cost and available
quantity of energy in the spot green energy market. It can be observed from Algorithm 3 that, we support only static penalty model in this work. We buy only if the available green energy in the sport market is able to switch to the demanded class. Since it is a linear time algorithm, the average-case complexity and worst-case time complexity is O(n).
Algorithm 1:greenSla
Input:
interval.class, β(τ),Pspot,Avspot,Nmax,inacurr,degcurr,idlcurr,surcurr
Output: s(τ),inacurr,degcurr,idlcurr,surcurr
1 s(τ)=0;
2 if interval.class==inadequatethen
3 ifinacurr<Nmaxthen
4 inacurr+ +;
5 else
6 s(τ)=buy(β(τ),Pspot,Avspot);
7 interval.class=updateClass(s(τ));
8 (inacurr,degcurr,idlcurr,surcurr)=update(interval.class)
9 else if interval.class==degradedthen
10 if surcurr>0then
11 idlcurr+ =2 ;
12 surcurr− −;
13 else
14 if degcurr<degmaxthen
15 degcurr+ +;
16 else
17 s(τ)=buy(β(τ),Pspot,Avspot);
18 interval.class=updateClass(s(τ));
19 (inacurr,degcurr,idlcurr,surcurr)=update(interval.class)
20 else ifinterval.class==idealthen
21 if degcurr>degmaxthen
22 s(τ)=buy(β(τ),Pspot,Avspot);
23 interval.class=updateClass(s(τ));
24 (inacurr,degcurr,idlcurr,surcurr)=update(interval.class)
25 else
26 idlcurr+ +;
27 else ifinterval.class==surplusthen
28 surcurr+ +;
29 return s(τ),inacurr,degcurr,idlcurr,surcurr
Algorithm 2:buySpotMinCost
Input: interval.class,interval.val, β(τ),Pspot,Avspot,penaltyModel
Output: class,cost
1 if interval.class==inadequatethen
2 if degcurr<degmaxthen
3 b=buySpot(Degraded,penaltyModel);
4 else if degcurr>degmaxthen
5 b=buySpot(Surplus,penaltyModel);
6 else
7 b=buySpot(Ideal,penaltyModel);
8 else if interval.class==degradedthen
9 if degcurr>degmaxthen
10 b=buySpot(Surplus,penaltyModel);
11 else
12 b=buySpot(Ideal,penaltyModel);
13 else if interval.class==idealthen
14 b=buySpot(Surplus,penaltyModel);
15 class, cost=update(b);
16 return class,cost
Algorithm 3:buySpot
Input: class,penaltyModel
Output: buy
1 buy=f alse;
2 if penaltyModel==staticthen
3 if demandedClass(class).isPossible()then
4 if cost(class)<Penalty(class)then
5 buy=true;
6 return buy
4
E
valuation
This section presents the results obtained from some ex-periments. In order to evaluate the proposed approach, we first describe our experimental environment. Then, we present cost analysis, SLA validation and how penalty model can influence the purchase decision and reduction of total expenditure in results section. Furthermore, insights and critical analysis are presented in discussion section.
4.1 Experimental Testbed
4.1.1 Real world power and workload traces
For a datacenter, Power usage effectiveness (PUE) is defined as the ratio of the data centers total power consumption to the data centers power consumption at the computer servers [20]. Therefore, we consider a data center which has an average PUE of 1.77. Though some of the state-of-the-art techniques claim to have reduced this value closer to 1.20, still most of today’s data center have higher PUE values than 1.7 [24]. Therefore, in the planning phase [4], for transforming CPU utilization to power consumption, we traced CPU utilization for 7 days of 30 servers from PlanetLab [21] where CPU utilization has been traced for
500 different servers from across the world. As, building
precise analytical models for modeling power consumption by modern multi-core CPUs makes a complex research problem, instead of using an analytical model of power consumption by a server, we utilize real data on power consumption provided by the results of the SPECpower benchmark.
We have selected two server configurations with multi-core CPUs published in November 2013: Dell Inc. Pow-erEdge M620 (Intel Xeon E5-2660 8coresX2.2 GHz,64 GB), and IBM NeXtScale nx360 M4 (2 Intel Xeon E5-2600,10 coresX2.2 GHz,256 GB). The configuration and power con-sumption characteristics of the selected servers are shown in
Table 1. So, we modeltotal data center power(t)=Server power
consumption(t)×PUE value.In addition, we use
OpenFore-cast6 to forecast power demand for next 24 hours based on
last 7 days power consumption which was traced. As our goal is to make data center 30% green, we scale down the power requirement demand to 30% and dynamically buy the required green energy from day-ahead REC market from multiple providers. Furthermore, power requirements were transformed to energy requirement (power integrated over time), as energy is purchasable in Grid and REC market but not the power (at which rate energy is transmitted).
TABLE 1: Power consumption by the selected servers at different load levels in Watt
Servers 0% 10% 20% 30% 40% 50% 60% 70% 80% 90% 100%
Dell Inc PowerEdge M620 688 1151 1322 1494 1671 1848 2061 2289 2499 2765 3239
IBM NeXtScale nx360 M4 550 873 999 1123 1251 1380 1525 1673 1887 2116 2404
We have presented 3 kinds of workload in Figure 9(a). The first workload is a real workload traced from Planetlab for 30 servers, which can be seen as interactive jobs (e.g., airline booking, e-commerce site), the second workload is
more characterized as an on/offpattern (e.g., scientific
ap-plication or batch jobs for same modeled server). However, the third workload is created with greater forecasting error statistics comparing to our predicted power workload in the planning phase by OpenForecast to evaluate how we can still propose a solution to fulfill green energy requirement
based on Green SLA. The predicted green workload and
above mentioned workload’s characteristics is presented in Table 2. Furthermore, we take advantage of the local solar irradiation data to calculate the amount of on-site green energy presented in the Figure 9(b). As the spot market data is not available, we produce synthetic data to validate our experiment presented in Figure 9(c). There could be multiple energy consumers who might need green energy from the spot market, hence all the energy present in the spot market will not be available for a single consumer, which makes a realistic assumption.
TABLE 2: Workload characteristics
Workload Mean Standard deviation Variance
Predicted Green workload 17.75 0.93 0.86
Experimental workload 1 20.26 2.98 8.89
Experimental workload 2 19.15 3.47 12.05
Experimental workload 3 23.95 4.24 18.01
4.1.2 Cost function and algorithms for comparison
Finding market prices of each kWh produced by green
sources are extremely difficult as most of the today’s wind
or solar power infrastructure or plants receive enormous
in-centives either from government or different policy making
organizations. Hence, to model a realistic price for energy in the day-ahead REC market, we investigate information of cap-ex, op-ex, levelized cost, fixed O&M cost, variable O&M
cost of different sources of energy (e.g., Nuclear, Wind, Solar,
Hydro etc)7and find that the ratio of energy consumption
cost between nuclear/brown and green energy is 1:1.68
approximately [4]. Since renewable sources are intermittent in nature, we consider the price of green energy sold at REC
market will be in the range of 0.19 - 0.25cents/kWh, which
is 31.57%in price variation, while the price of Nuclear or
mixed energy provided by EDF8is 0.14 cents/kWh. As prices
tend to be higher in the spot market, we have made an
as-sumption that green spot market price can be30-35%higher
than the normal or day-ahead REC market. We compare
ourgreenSLAalgorithm with purchase at deadline approach
and an energy storage approach that stores excessive on-site renewable and other abundant energy. Recent empirical
7. http://www.eia.gov/forecasts/aeo/pdf/electricity generation.pdf
8. http://entreprises.edf.com/entreprises-45638.html
studies shows that, the charging/discharging efficiency of
a storage is η = 80% and cost per cycle is approximately
0.1 euro [35]. In addition, we use fixed penalty value 1.5
eu-ro/interval for IaaS provider ifGreen SLAis violated. We will
analyze why do we choose this value and how it affects to
the total energy cost in the result section. So, we define total
energy cost asCg,Cp,Csrespectively forgreenSLA, ”purchase
at deadline” and ”using energy storage” as follows:
1) Cg = grid energy cost + REC energy cost + spot
green energy cost+penalty if violated SLA.
2) Cp = grid energy cost + REC energy cost + spot
green energy cost
3) Cs = grid energy cost + REC energy cost + spot
green energy cost+storage charging and
discharg-ing cost.
4.2 Results
In this section we describe cost analysis, SLA evaluation
based on our proposedgreenSLAalgorithm, impact of
con-trol parameter V, impact of penalty to the total energy
expenditure and robustness of our approach in detail.
4.2.1 Cost analysis
In Figure 6, we compare the cost for 24 hours between
our proposedgreenSLAalgorithm and other two approaches
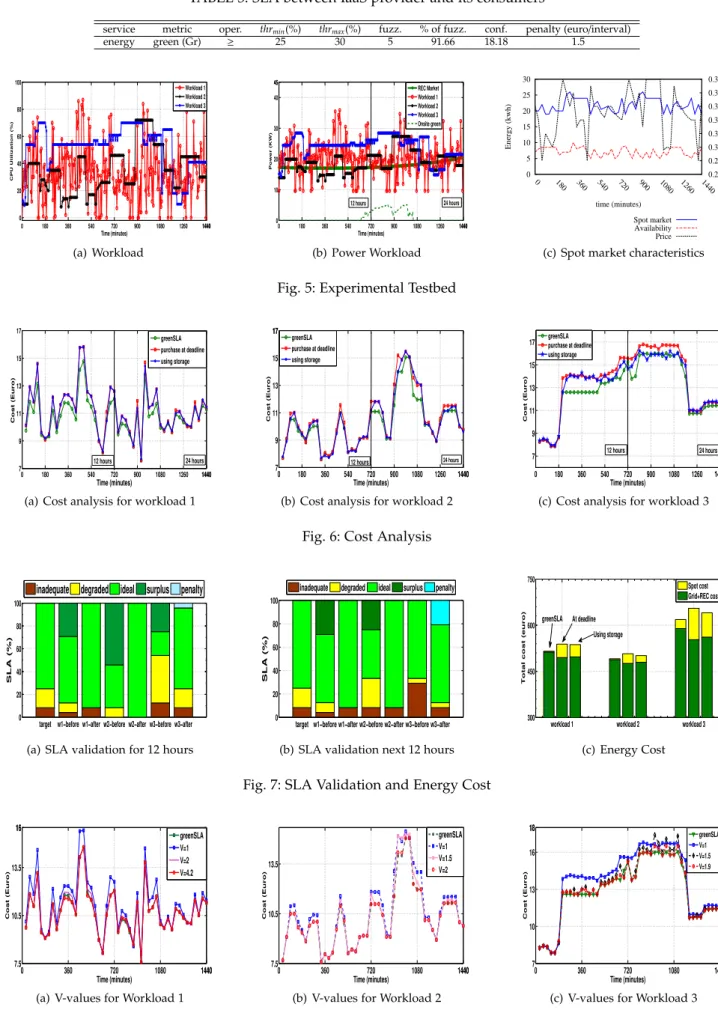
namely ”purchase at deadline” and ”using energy storage”. It is rationale that, purchasing green energy in every slot when it is needed incurs higher cost for purchase at deadline approach. Furthermore, the storage incurs additional costs due to charging the excessive energy and discharging the remaining energy in some slots. Besides, the storage does not discharge the exact amount of energy that has been charged earlier. From Figure 6(a) and 6(b), we calculate
that,greenSLAachieves 4.47% and 4.17% cost reduction for
workload 1 and 3.29% and 2.1% for workload 2 comparing to other two approaches. For workload 3, it has been noticed that (shown in Figure 6(c)), some time slots experience
greater green energy inadequacy, hencegreenSLAalgorithm
was forced to choose penalty for few slots. In some other
slots, greenSLA choose penalty over buying green energy
from spot market, as the cost for buying green energy was slightly higher in terms of total expenditure. Since purchasing green energy option is limited in spot market for a single consumer, other two approaches cannot meet
the exact demand. Nevertheless, greenSLAperforms better
by reducing 5.9% and 3.54% cost comparing to other ap-proaches for workload 3. In terms of buying spot energy, Figure 7(c) shows, purchase at deadline approach incurs 8.17%, 6.26%, 15.62% expenditure of total energy cost for workload 1,2 and 3, the storage performs better by incur-ring 7.48%, 4.35% and 12.45% for respective workloads. In
contrast, greenSLAsignificantly reduce the expenditure for
TABLE 3: SLA between IaaS provider and its consumers
service metric oper. thrmin(%) thrmax(%) fuzz. % of fuzz. conf. penalty (euro/interval)
energy green (Gr) ≥ 25 30 5 91.66 18.18 1.5 0 180 360 540 720 900 1080 1260 14401440 0 20 40 60 80 100 Time (minutes) CPU Utilization (%) Workload 1 Workload 2 Workload 3 (a) Workload 0 180 360 540 720 900 1080 1260 14401440 0 10 20 30 40 45 45 Time (minutes) Power (KW) REC Market Workload 1 Workload 2 Workload 3 Onsite green 12 hours 24 hours (b) Power Workload 0 5 10 15 20 25 30 0 180 360 540 720 900 1080 1260 1440 0.28 0.29 0.3 0.31 0.32 0.33 0.34 0.35 Energy (kwh) Price (€/kwh) time (minutes) Spot market Availability Price
(c) Spot market characteristics Fig. 5: Experimental Testbed
0 180 360 540 720 900 1080 1260 14401440 7 9 11 13 15 17 Time (minutes) Cost (Euro) greenSLA purchase at deadline using storage 24 hours 12 hours
(a) Cost analysis for workload 1
0 180 360 540 720 900 1080 1260 14401440 7 9 11 13 15 17 17 Time (minutes) Cost (Euro) greenSLA purchase at deadline using storage 24 hours 12 hours
(b) Cost analysis for workload 2
0 180 360 540 720 900 1080 1260 14401440 7 9 11 13 15 17 Time (minutes) Cost (Euro) greenSLA purchase at deadline using storage 12 hours 24 hours
(c) Cost analysis for workload 3 Fig. 6: Cost Analysis
target w1−before w1−after w2−before w2−after w3−before w3−after 0 20 40 60 80 100 SLA (%)
inadequate degraded ideal surplus penalty
(a) SLA validation for 12 hours
target w1−before w1−after w2−before w2−after w3−before w3−after 0 20 40 60 80 100 SLA (%)
inadequate degraded ideal surplus penalty
(b) SLA validation next 12 hours
workload 1 workload 2 workload 3 300
450 600 750
Total cost (euro)
Spot cost Grid+REC cost At deadline Using storage greenSLA (c) Energy Cost Fig. 7: SLA Validation and Energy Cost
0 360 720 1080 14401440 7.5 10.5 13.5 16 16 Time (minutes) Cost (Euro) greenSLA V=1 V=2 V=4.2
(a) V-values for Workload 1
0 360 720 1080 14401440 7.5 10.5 13.5 Time (minutes) Cost (Euro) greenSLA V=1 V=1.5 V=2
(b) V-values for Workload 2
0 360 720 1080 14401440 7 10 13 16 18 18 Time (minutes) Cost (Euro) greenSLA V=1 V=1.5 V=1.9
(c) V-values for Workload 3 Fig. 8: Impact of parameter V
of total expenditure for above mentioned workloads. In our understanding, the concept of virtualizing the green energy leverages the process of reduction the total green energy expenditure by our algorithm than other two approaches.
4.2.2 SLA validation
Figure 7(a) and 7(b) show the comparison of targeted and
achieved SLA based ongreenSLAalgorithm, which is
evalu-ated and validevalu-ated through CSLA. For our experiment, we
fix observation windowτ=30 minutes and evaluate every
12 hours as evaluation window suggesting, we evaluate 24 intervals at a time. We present a example of CSLA in section 3.2 having a SLA contract to provide 18 ideal intervals, 4 degraded intervals and 2 inadequate intervals out of 24 intervals or slots of green energy. The Table 3 summarizes the SLA between the IaaS provider and its consumers (SaaS providers). When SaaS provider establishes a SLA with IaaS provider for having 30% green energy to run their workload, the Ideal intervals ranges from 25% to 30% for green energy in CSLA framework. We argue on the fact that, it is not possible to provide or measure exactly 30% green energy in each timeframe. Besides, running same workload over and over again in a server shows slightly different power
consumption profile. For workload 1, greenSLA achieves
exactly the target for first 12 hours, but shows better perfor-mance attaining 91.67% of ideal and 0% of degraded interval comparing to the goal of providing 75% and 16.66% of ideal and degraded interval respectively. The algorithm performs even better for batch jobs type workload 2, by providing 91.67% and 100% of ideal interval for first 12 hours and later 12 hours. Although the mean green energy demand for workload 1 and workload 2 deviates by 14.14% and
7.88% comparing to our predicted demand, greenSLAstill
managed to fulfill SLA by greater percentage, thus our algo-rithm is robust to inaccurate prediction information in terms of SLA validation. Due to the insufficient amount of green
energy in the green spot market, greenSLA fails by 4.17%
and 8.33% to meet SLA for workload 3 in two timeframe but still managed to incur lower cost than other two approaches, even though the algorithm chose to provide penalties in 6 intervals.
4.2.3 Impact of control parameter V
As shown in Figure 8, to simulate 3 kinds of workload,
we fix t to be 24 hours and each fine grained timeslot
as τ=30 minutes. We conduct experiments with different
V values ranging from 1 to 5 and realized that, as the V
value increases, it reduces the total energy cost. However,
fixing larger value ofVcan violate contracted SLA. We see
that, for workload 1, when V =4.2, the control parameter
performs well by reducing cost close to greenSLAand can
satisfy the targeted SLA shown in 8(a). Nevertheless, if the value is increased by fraction, reduction of cost becomes larger but violates SLA. So this quantitatively indicates that, our proposed Lyapunov framework can approach very close
togreenSLAwithin a diminishing gap ofO(1/V). Moreover
we perceive that, the value ofVcan not be fixed ahead since
it depends on the characteristics of the workload and SLA parameters. Figure 8(b) and 8(c) shows that, the same value
ofVcan incur different level of costs. So, choosing the
ap-propriate value is essential to make a trade-offbetween cost
reduction and maintainingGreen SLA. From our experiment,
we find that the value ofV=2 andV =1.9 can incur costs
near togreenSLAfor workload 2 and workload 3.
4.2.4 Impact of penalty
For our experiment, we choose static penalty per inter-val meaning, if IaaS provider fails to meet the demand of providing green energy beyond the SLA, the provider pay a fixed amount per interval. It is well understandable
that, choosing a penalty value is extremely difficult and it
depends on the business model of IaaS provider. Though we fixed the value of penalty as 1.5 euro/interval, Figure
9(c) shows that how the other penalty value affects the
total expenditure for workload 3. In case of workload 1
and 2, greenSLAdoes not incur any penalty as it achieves
the targeted SLA. We consider penalty value ranges from
1 euro/interval to 1.75 euro/interval by a factor of 0.25.
We realize that, even increasing the penalty value by 0.25
euro/interval, the total expenditure increases only by 0.48%,
0.93%, 1.05% for 1.25, 1.50, 1.75 euro/interval. Hence, we
choose 1.5 euro/interval penalty value which affects below 1% to the total green energy expenditure and certainly gives the flexibility to the IaaS provider.
4.3 Discussion
In this paper, we provide a greenSLA approach to show
how SLA can be established and validated based on Green energy. Due to the intermittent nature of green sources and price diversity in electricity market, we consider that, the REC and Spot market energy price variation fluctuates in a range in section 4.1.2. We observe that, with 31.57%
(.19-.25 cents/kwh) price variation in REC market; the maximum
cost difference fluctuates within [-4.13%, 6.63%] for 3 kinds
of workload, whose mean and standard deviation (see Table 2) varies significantly than the predicted workload. Figure
9(a) shows the total cost curve in respect to different REC
market energy price and energy demand variation. So, with the increase of energy price in REC market, the total expen-diture increases slightly but expenexpen-diture can be increased significantly if the energy demand variation is large. The rationale is that, the cost reduction through using greenSLA depends on the application workload. If the workload is more predictable, the cost reduction could be larger. Further-more, Figure 9(b) indicates, the maximum cost difference fluctuates within [-1.43%, 1.30%] in respect to our proposed
solution, while spot market has 25% (.28-.35 cents/kwh)
price variation. Section 4.2.2 shows that,greenSLAmanaged
to fulfill SLA with greater percentage, even workload 1 and 2 has significant deviation of mean in terms of green energy
demand. Therefore, greenSLA is robust and reliable to the
energy prices in two time-scale market and energy demand, even though they have certain turbulence in variation. Furthermore, we only present one method to buy green
energy from the green spot market based on proposedGreen
SLA. Our idea can be easily extendable to other methods
required by IaaS provider to meet different goals and
es-tablishment for different SLA based on availability of green energy. Furthermore, this paper only proposes static penalty in case of SLA violation, but dynamic penalty can be inte-grated into the model as CSLA supports dynamic penalty
2.98 (w1) 3.47 (w2) 4.24 (w3) 0.19 0.2 0.21 0.22 0.23 0.24 0.25 450 500 550 600 650
Standard deviation of workload REC market price (euro)
Total cost (euro)
(a) Total cost at various level of REC market price and energy demand variation
2.98 (w1) 3.47 (w2) 4.24 (w3) 0.28 0.29 0.3 0.31 0.32 0.33 0.34 0.35 500 550 600 650
Standard deviation of workload Spot market price (euro)
Total cost (euro)
(b) Total cost at various level of spot market price and energy demand variation
0 360 720 1080 1440 1 1.25 1.5 1.75 5 8 11 14 17 Time (minutes) Penalty (euro) Cost (euro)
(c) Penalty vs cost over time
Fig. 9: Impact of different energy prices and penalty to total cost
modeling. Moreover, we do not propose an optimal solution as optimal solution for reducing cost of green energy can be varied depending on the workload pattern, on-site green energy generation and green spot market characteristics. From our experiments we observe that, it is possible to
val-idateGreen SLAwith proposed spot market characteristics.
Nonetheless, providing penalty in most of the intervals/slots
when green energy is not available seems a little unrealistic. In case of low availability of green energy, we recommend
that, efficient VM migration framework in IaaS level [36]
and dynamic resource scaling and functionality degradation of services [3] can reduce energy consumption as well as green energy requirement in data center.
5
R
elated
W
ork
In recent years, a plethora of work has addressed the prob-lem of reducing carbon footprint and energy procurement cost by integrating different renewable options in Cloud data centers. In the following, we first survey the literature
on Green SLA and then focus on proposals on reducing
energy procurement or management cost.
5.1 Green SLA
Laszewski et al. [13] investigated different green IT
met-rics that considered environmental impacts as part of the SLA for building GreenIT-as-a-Service (GaaS) which can be reused as part of a SaaS and IaaS framework. The frame-work provides how green metrics (i.e., DCiE, PUE, DCeP, SWaP) can be taken into consideration to reduce energy
consumption in different layer of Cloud computing to
pro-vide greener services. Later, Wang et al [14] proposed green SLA based on energy aware scheduling of resources by exploiting dynamic voltage and frequency scaling (DVFS) technique. Their green SLA contract definition phase creates some green SLA templates where user might accept some performance or QoS degradation in order to reduce power consumption for their task completion. While these
specifi-cations are ought to build green services, Green SLAmust
be established using green energy sources to reduce carbon
footprint. Klingert et al. [25] introduced the notion ofGreen
SLA, focusing more on optimizing energy per job based
on known hardware and software techniques. Furthermore,
how applications might specify preferences/requirements
for these techniques were discussed. However, their work neither provides specification of SLA nor proposes valida-tion process based on available green energy. Generally,
Green SLA should be able to guarantee that the leased
resources to SaaS providers or end clients via IaaS provider are environmental friendly. To this point, Haque et al. [1] considered an SLA that specifies the proportion of green power that the IaaS provider should use to run the job (e.g., x% of the job should run on green power). However,
their proposed Green SLA approach is per application/job
specific, where every job can have different green energy
requirement. In contrast, we advocate the Green SLA as
per interval specific, which is not dependent to the
ap-plication/job. Moreover, their approach is more based on
power distribution and control infrastructure. We try to ensure that, a data center can be proportionally green for the whole day by exploiting available green energy sources and markets for establishing a formal contract between SaaS
provider/end client and we explained how the Green SLA
can be formulated and validated through CSLA language. Ahmed et al. [26] addressed green SLAs for geographically distributed data center by shifting workloads towards most
green energy efficient data center (following renewable) by
penetrating VM migration. Their goal was to reduce carbon emission per job by finding most green data center among the virtual data center owned by the same provider while maximizing revenue. Again their work, including [27], lacks
proper definition ofGreen SLAand its real use case in any
business model.
While above researchers focused on addressingGreen SLA,
substantial amount of research has been done in coordinated multi-level power management [15], energy-efficient
re-source management [9][16], energy-efficient network-aware
scheduling [19] and prominent green architecture [17] for Green data center. Recently, Basmadjian et al. [38] summa-rized the existing proposals and solutions that deal with the energy consumption and its reduction possibilities in every aspect of a Cloud data center. In position to above works, our research exploits incorporating green energy to establish