978-1-7281-2138-3/19/$31.00 ©2019 IEEE
Context-Aware Driver Distraction Severity
Classification using LSTM Network
Adebamigbe Fasanmade Faculty of Computing, Engineering and
Media
De Montfort University Leicester, UK [email protected]
Ali H. Al-Bayatti
Faculty of Computing, Engineering and Media
De Montfort University Leicester, UK [email protected]
Suleiman Aliyu
Faculty of Computing, Engineering and Media De Montfort University Leicester, UK [email protected] Mhd Saeed Sharif
School of Architecture, Computing and Engineering, College of Arts, Technology and Innovation, UEL
University Way, Dockland Campus London, E16 2RD, UK.
Ying He
Faculty of Computing, Engineering and Media
De Montfort University Leicester, UK [email protected] Ahmed S. Alfakeeh Faculty of Computing and Information
Technology King Abdulaziz University
Jeddah, KSA [email protected] Abstract—Advanced Driving Assistance Systems (ADAS)
has been a critical component in vehicles and vital to the safety of vehicle drivers and public road transportation systems. In this paper, we present a deep learning technique that classifies drivers’ distraction behaviour using three contextual awareness parameters: speed, manoeuver and event type. Using a video coding taxonomy, we study drivers’ distractions based on events information from Regions of Interest (RoI) such as hand gestures, facial orientation and eye gaze estimation. Furthermore, a novel probabilistic (Bayesian) model based on the Long short-term memory (LSTM) network is developed for classifying driver’s distraction severity. This paper also proposes the use of frame-based contextual data from the multi-view TeleFOT naturalistic driving study (NDS) data monitoring to classify the severity of driver distractions. Our proposed methodology entails recurrent deep neural network layers trained to predict driver distraction severity from time series data.
Keywords— Context awareness, Driver Distraction, Severity prediction, dynamic Bayesian networks (DBN), LSTM networks, time series.
I. INTRODUCTION
Intelligent Transportation Systems is highly utilized in sharing drivers behaviour and vehicle safety information such as collision warning, weather condition, accident occurrence, emergency brake light and blind spot warning [1]. In addition, vehicle information such as direction, speed, acceleration, signal intersections also shared to prevent the occurrence of accidents. However, drivers do react to contextual information while driving thus, there is a need for real-time context-aware systems to prevent accidents.
According to (NHTSA) driver distraction is a key contribution to a lot of road traffic accidents. National Highway Traffic Safety Administration (NHTSA) identified an increase in distraction from in-vehicle electronic devices and published guidelines to discourage excessive distraction by electronic devices in vehicles [2]. Furthermore, the vehicle user interface presents information overload to drivers, leading to distractions and causing accidents. Infotainment
Systems are highly automated and requires complex operation thus, diversion of visual attention of the driver away from observing his driving environment is crucial [3]. The task of driving is predominantly visual and manually by the hands (steering wheel and gear shift) and by feet (acceleration, braking). However, the driver inputs(eye gaze, hands) are often position in different states and sometimes performs tasks simultaneously [4]. Thus, a limitation is that the drivers input that constitutes distraction can have different level of severity.
It has been estimated that 94% of accidents are as a result of drivers error and about 75% is from drivers decision errors [5]. Furthermore, in research and survey conducted about the causes of deaths in a road accident, 55% were as a result of careless driving.
Critically, driver distractions could possibly be influenced by in-vehicle component (In-vehicle devices) thus making driver perform an act that leads to a careless driving behaviour thereby, breaching driving laws. For example, infotainment system operation while driving could result in driver distraction. Drivers distractions detection is vital for many different applications in the domain of intelligent vehicles and autonomous driving.
Driving Context influences the behaviour and reaction of drivers. Also, contextual environment changes affects the driver’s perceptions and risk levels. These challenges needs an adaptive contextual aware system that can be applied in the detection and learning of driver’s behaviour in real time. To implement such a system there is a need to define what a context is and the components of a context-aware application. In Advanced Driver Assistance Systems (ADAS), capturing drivers distraction in scenarios such as in-vehicle monitoring can be used to alert humans inside the vehicle when dangerous situations arise. Distraction is part of people’s everyday lives and it reduces reaction time, concentration and alertness in a driving environment. Drivers distractions have led to the development of Advanced Driver Assistance Systems (ADAS) to improve driving safety and reduce accidents. Prevention of traffic accident using ADAS can be categorised into driver monitoring or vehicle oriented approach. According to Braunagel 2017 [6], stated ADAS system can aid the vehicle to take-over in a longitude and control situations which has led to our proposed systems for a severity
model for drivers distractions to aid vehicle situation most
especially in Semi-autonomous vehicles. Brauagel, further stated that driver is responsible for vehicle in semi-autonomous vehicles all the time. The driver's responsibility is transferred to an automated vehicle in some scenarios thus, enabling driver perform secondary tasks (reading, watching movies, sleeping) [6], [7]. Performing secondary tasks at the moment is still being regulated and not fully authorized; even in fully autonomous vehicles. Furthermore, ADAS in autonomous vehicles have been designed to alert the driver when hands are not on the steering. This led to drivers taking-over situations whereby the vehicle forces driver to take-taking-over driving tasks. Bruanagel, resolved the aforementioned of the readiness of the driver in easing the transition of the driver taking over control without reducing the driver’s take-over readiness [6]. The approach used entail driver monitoring through features such as gaze guidance or increased decelerations. Nevertheless, there can be scenarios where the vehicle needs to take-over from the driver, this probably due to the driver being distracted and not giving utmost concentration to driving activity thus, having a degree of driving distraction according to severity level is crucial. A major gap is the risk assessment of road accident using severity prediction of traffic accidents with Recurrent Neural Network (RNN) [8]–[11]. We proposed a prevention system rather than detection approach thus, leading to a proposed system to prevent distraction that can lead to occurrence of accidents.
In this paper, we utilized secondary naturalistic driving study(NDS) data TeleFOT with 27 subjects and explore some of the usage of the TeleFOT data in order to determine the events that exist in the TeleFOT data.
The main contributions of this paper are: Proposed a frame-based severity metric of Drivers distractions using linear transformation. Proposed architecture for classification of drivers distractions into severity level using Long Short Term Memory (LSTM). Validation of frame-based severity model using experiment. An approach towards an adaptive classification system of vehicle take-over from driver according to driver’s distraction severity level will be developed and tested on naturalistic driving study data. In addition, having such a system can be useful in ADAS systems. In this paper, the focus is on driver distraction monitoring using Contextual Aware drivers distraction and analysed with LSTM a Recurrent Neural Network (RNN). The proposed systems can be further applied in adaptation to drivers behaviour thus, leading to a preventive and corrective system for drivers distractions based on the severity of the distractions. Though, this can be subjective to frequency and duration in which the event occurred. The proposed severity classifier considers the driver's distractions and considers context-aware information.
The remainder of this paper driver's as follows: Section II gives the summary of related work the various ways in which driver distraction is monitored and collected. In addition, Justification of why severity level of drivers distractions needs to be measured and vehicle take over in semi-autonomous vehicle. In section III the secondary NDS data used in carrying out the experiment is explained. Section IV the over architecture of the drivers distraction severity model is described. The LSTM based drivers distractions severity architecture is presented. Section V presents the results of the experiment and evaluations. Section VI conclusion will
involve limitations of the present system and discussion of the future work.
II. RELATED WORK
A. Safety In-vehicle monitoring, external monitoring
Driver drowsiness results in 20% of accidents on monotonous roads due to sleep deprivation relating to road accidents. Drivers behaviour in the prediction of unsafe driving behaviour in advance will ensure safe driving. The detection of drivers behaviour can be classified into visual and non-visual features. The visual features entails facial expression and eye movement tracking while the non-visual features are grip pressures, heart rate variability(HRV), galvanic skin response[16]. Chakraborty and Nakano 2016 [17], detected drivers distraction due to cognitive distraction using a driving simulator. The experiment entailed different driving situations with detection of normal driving and secondary cognitive tasks under different road condition. Time series data from vehicle sensors such as brake stroke, accelerator stroke, speed were analysed using data mining algorithms.
B. Distractions and Methodologies (LSTM,etc)
Yan et al [18] recognized driver’s inattention using Convolutional neural network to learn and predict driver state features such as the eyes, mouth and ear. The detection of the aforementioned features was done by training dataset that consists of four activities normal driving, cell phone usage, eating and falling asleep. Detection was achieved using a Face++ Research toolkit that localizes the facial landmarks on drivers. Results yielded a 95.56% accuracy in classification of the driver’s mouth, ear and eye[18]. Le et al, 2016 [19], used an advanced deep learning approach that detects objects such as hands, cell-phone usage. Le et al, 2016, proposed deep learning technique features a Multiple Scale Faster-RCNN integrated with a standard Region Proposal Network(RPN) which features maps from that entails a convolution feature maps such as ROI pooling, conv4 and con3. The data adopted is from SHRP-2 databases and results yielded a reduce testing cost, better accuracy and independent facial landmarking. The deep learning based MS-FRCNN achieved a higher accuracy than similar Faster R-CNN. Donahue et al 2016 [20] stated Recurrent Neural network has gained recognition in the image interpretation for recurrent models for tasks with sequences (time series data) and visual representation. They also proposed a Long-term Recurrent Convolutional Networks (LRCNs) architectures for visual recognition that combines convolutional layers(CNN) and long-range temporal recursion. The architecture considers three vision difficulties (activity recognition, image description, and video description) and instantiates the following sequential learning
task namely Sequential input, static output (
( , ,.... )
x x
1 2x
t
( , ,.... )
y y
1 2y
t ), Static input sequentialoutput (
x
( , ,.... )
y y
1 2y
t ) Sequential input and output(
( , ,.... )
x x
1 2x
t
( , ,.... )
y y
1 2y
t ). The aforementionedsequential input approach can be applied in time series data such as speed, acceleration in the Naturalistic driving study (NDS).
C. Video Coding Taxonomy Justification
Naturalistic driving study (NDS) in the development of a drivers distraction video coding taxonomy has been here for a decade now and a major study is the study of 100-Car Naturalistic Driving Study by VTTI designed to capture real-world driving behaviours constituting of 109 primary drivers and 132 secondary drivers [21]. Results of the analysis aided in the creation of driving events database. The events were further classified into crashes, near-crashes and other incidents. Further classification into pre-event manoeuvre, event type, contributing factors and avoidance manoeuvre exhibited. In addition, parameters such as vehicle headway, vehicle speed, time-to-collision and driver reaction time recorded. This led to the creation of a standard video coding taxonomy for drivers distraction.
VTTI coding standard has been used in the development of event classification for classification of incidents such as 01, Crash Tire Strike-02, Near-03, Crash-Relevant Conflict-04 However, some of the variable is extremely subjective and is determined using the best judgement of analyst.
Franzen E. R et al 2012, investigates impact of functions induced on drivers using a Field Operational Test. The function induced are, Navigation Support, Speed Alert, Speed Limit, eCall and Green Driving Support. The impact of the nomadic devices for traffic, transport and travel related applications was conducted thus leading to the development of distraction coding taxonomy as seen in Table 1 and 2. An example of instance would be “Does having a Forward collision warning system improve safety in driving?” [15].
D. Justification of Contextual-Aware drivers distractions Measurements
Realistically, there will be the justification of the minimum severity threshold required for an event to be classified to be low, medium and high severity respectively. For example, a detection of an event instance such as hand gesture event (seat belt adjustment, wave to passers, panel adjustment) for a period of 10 seconds could be classified to be medium severity.
Wierwille et al 2015, measured the response time in braking to measure the drivers behaviour. Smith A P 2016 [21], [22], examined associations between driving when fatigued (DF) and poor driving behaviour (DB), risk taking (RT) and road traffic accidents (RTAs). Cross-sectional online survey of clients of an insurance company was adopted. The survey measured driving behaviour (speed, distractions, attention lapses and aggression), and frequency of driving when fatigued. Speed Metrics using maximum speed (speed limit) and mean speed standard deviations. The use of driving speed and speed violations. This entails monitoring drivers behaviour data and in correlation braking events during course of driving can be used. Incidents can be used to measure driver’s behaviour and drivers aggression. However, the application area of this research is to prevent events that can lead to accidents.
Simmons-Morton et al, 2011 [23], stated gravitation force (g-force) elevation as a result of sudden deceleration or acceleration and hard turn event are important measure of risky driving. The response time to perceived and increase loss of vehicle control. Risky driving associated with elevated g -force events were analyzed. A collision avoidance rule is
meant to manoeuvre by giving 3 to 4 seconds distance between vehicle in front in instance of braking events. However, this is suitable under good weather conditions and normal traffic condition.
III. TELEFOTDATAANALYSIS
TeleFOT NDS comprises of the largest European Field Operation Test (FOT) regarding the functionality by in-vehicle aftermarket and nomadic devices. The main purpose of the project was to improve Autonomous systems and cooperative systems in Intelligent Transportation Systems environment [11], [23]. The FOT conducted involved vehicle collecting and recording driving data such as speed measuring, vehicle dynamics and vehicle positions. In this paper we considered the TeleFOT NDS study in the UK jurisdiction, which was launched in 2011 to collect naturalistic driver behaviour without any predefined condition in United Kingdom. The test location was mainly in East Midlands (Leicester, Coventry, Nottingham) area of the UK and partnership with Loughborough University [25].
The TeleFOT NDS study involved 27 different participants(subjects) with some participants repeated over different conditions. The trial type conditions are Baseline, Experienced and Novice.
The route for all the drivers are predominantly urban with a range of junction and traffic types. The vehicle (2008MY Ford Sedan) used is consistent for all participants with approximately 1 hour of driving for each data. In addition, with the exception of route information no driving conditions were applied thus, naturalistic driving is achieved. Video data was obtained via 4 video channels with 100Hz GPS and accelerometer data. The tiled video channel providing data for both in-vehicle and out-vehicle (external vehicle) monitoring with driving data variables that will the are time, acceleration, speed, video frame, GPS longitude and latitude. Deducing from the TeleFOT data available, the events to be measured can be further narrowed down. For example, severity level of a single event (eye glances on distraction sources) can be analysed. Another possible approach could be the severity level amongst multiple events (hands gesture, hand distractions, mouth events, head movements, eye glances).
IV. DRIVER DISTRACTION SEVERITY MODEL
This section will include the classification of driver’s distraction and context-aware information into a severity model.
A. Context-Aware Driver Distraction Severity
The Table I below contains driving distractions identified in participant BL_001 drawn from the VTTI standard distraction taxonomy [21]. The distraction event (ID) has been coded with unique numbers and events. Minimum required attention (MIRA) theory has been developed to address the limitations of understanding driver distraction.
TABLE I. DRIVER DISTRACTIONS [21] Distraction type Distrac tion Type ID Description MIRA #
Left Mirror 2 Any Left-hand side mirror glance Left Window 3 Any left side glance at the window
Right Mirror 4 Any glance at the mirror on the right side
7 Right
Window 5 Any glance to the right-side window. (looking at junctions- else 40)
Rearview Mirror
6 Any glance at the rear view mirror 8 Instrument
Cluster
7 Any glance at the instrument cluster located underneath the dashboard. E.g. glances at the speedometer, control stalks, and steering wheel.
Interior Object
8 Any glance at an object in the vehicle different from a mobile phone. Objects may include personal items brought in by the participant.
2
look at
Passenger 12 Driver looking at (and talking to) passenger. 3 Look outside
vehicle either through windscreen or side window
40 The driver looks at another vehicle, person, animal, undetermined object outside the vehicle. (Not checking at junctions else 3 or 5)
The coding taxonomy system were based on the previous Naturalistic driving study (NDS) mentioned above. The code section in the table are not sequential in the video coding data (contextual data) of participant BL_001 only distractions code presents are logged which has been analysed. The table depicted below has been drawn from a standard video coding taxonomy as justified above. We considered the following contextual-aware variables for drivers distractions severity classification namely Speed
Source: ON‐BOARD CAMERAS Multi‐level Distraction Detection(FastRCNN) Frames LSTM – Severity prediction Dynamic Bayesian/DAG for severity Classification 2‐D Distraction Detection Vehicle Takeover Control Control Signals Implementation Contextual Information(Speed Acceleration etc.)
Fig.1a. The Context-Aware Driver Distraction Severity Classification Architecture.
Distraction Type: The driver’s distraction event/occurrences identified in the Distraction depicted in Table I.
Speed: The Speed is Recorded in miles per hour and calculated from the GPS signal. Unlike other systems, this is the vehicle speed over the ground and not wheel speed or road speed.
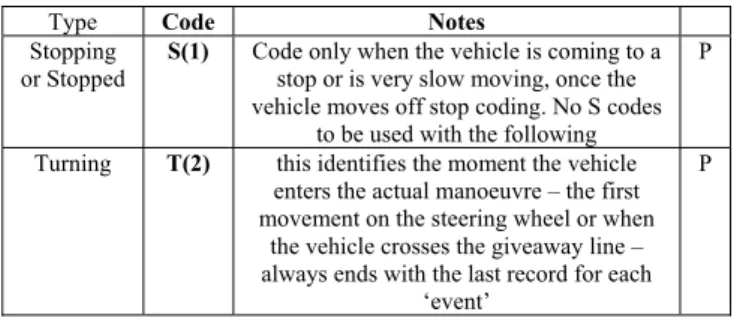
Manoeuvres: This indicated whether the vehicle was stopped (‘S’) or turning (‘T’) or otherwise.
TABLE II. MANOUVERS Manoeuvre (Column 9)
Type Code Notes
Stopping or Stopped
S(1) Code only when the vehicle is coming to a stop or is very slow moving, once the vehicle moves off stop coding. No S codes
to be used with the following
P
Turning T(2) this identifies the moment the vehicle enters the actual manoeuvre – the first movement on the steering wheel or when
the vehicle crosses the giveaway line – always ends with the last record for each
‘event’
P
Dynamic Bayesian Network (DBN). We compute the frame-based severity metric denoted S for classifying driver distraction using the direct acyclic graph (DAG) shown in Fig.2 below, Speed/ Accel. Distraction Ty pes Consecutive Frame‐ based Occurences Distraction prob. (t) Manoevres Contextual Prob. (t‐1) Severity Probability (t) Severity Probability (t‐1)
Fig. 1b. The dynamic Bayesian network (DBN) for severity classification.
𝑃𝑟 𝑆 𝑃𝑟 𝑆 ,𝐷𝑡 𝑃𝑟 𝑆 |𝐷 Pr 𝐷 (1)
Where 𝑆 , 𝑆 , 𝐷 are severity probability at time t, severity probability at t-1 and the distraction probability at t.
B. The LSTM-Based Driver Distraction Severity Classification
An LSTM layer is a recurrent neural network (RNN) layer that provides support for time series and sequence data in a network. The layer does summative interactions, which fosters gradient flow over long sequences during training. LSTM layers are most appropriate for learning patterns or dependencies from distant frame (time) steps.
The learnable weights of the LSTM network for driver distraction severity are input weights 𝑊, recurrent weights 𝑅, and the bias 𝑏.
The sequenced input layer inputs time-series data to the LSTM network for driver distraction severity. The sequence input layer of the LSTM network is created using sequenceInputLayer. 𝑊 ⎣ ⎢ ⎢ ⎡𝑊𝑊 𝑊 𝑊 ⎦⎥ ⎥ ⎤ 𝑅 ⎣ ⎢ ⎢ ⎡𝑅𝑅 𝑅 𝑅 ⎦⎥ ⎥ ⎤ 𝑏 𝑏 𝑏 𝑏 𝑏
Where i, f, g, and o denote the input gate, forget gate, layer input, and output gate.
The frame cell state at time step t is given by, 𝑐𝑡 𝑓𝑡⨀𝑐𝑡 1 𝑖𝑡⨀𝑔𝑡
Where ⨀ denotes the element-wise multiplication of vector (Hadamard product).
The hidden output state at time (frame) step t is given by, ℎ𝑡 𝑜𝑡⨀tanh 𝑐𝑡
𝑖𝑡 𝜎 𝑊𝑖𝑥𝑡 𝑅𝑖ℎ𝑡 1 𝑏𝑖 𝑓𝑡 𝜎 𝑊𝑓𝑥𝑡 𝑅𝑓ℎ𝑡 1 𝑏𝑓 𝑔𝑡 𝑡𝑎𝑛ℎ 𝑊𝑔𝑥𝑡 𝑅𝑔ℎ𝑡 1 𝑏𝑔 𝑜𝑡 𝜎 𝑊𝑜𝑥𝑡 𝑅𝑜ℎ𝑡 1 𝑏𝑜 𝜎 𝑖𝑠 𝑡ℎ𝑒 𝑠𝑖𝑔𝑚𝑜𝑖𝑑 𝑓𝑢𝑛𝑐𝑡𝑖𝑜𝑛 𝑤ℎ𝑒𝑟𝑒𝜎 𝑥 1 𝑒
Fig. 2. Frame-based flow at time t (LSTM Layer)
V. EXPERIMENT RESULTS
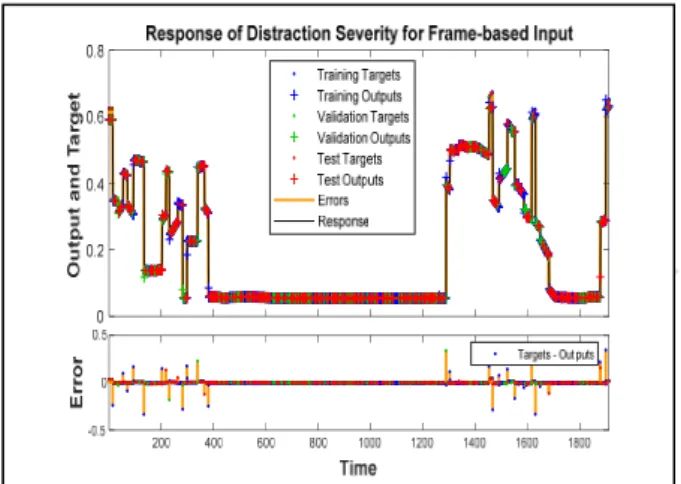
In experiments using MATLAB 2019a, we create the severity prediction model using the non-linear autoregressive with exogenous input (NARX) Neural Network (as shown in Fig.3). The recurrent neural network (RNN) is designed with 10 Hidden Neurons with a delay of 2. Fig.4 show the response of the deep recurrent neural network (LSTM network) created for distraction severity classification using the distraction taxonomy applied to participant 001 naturalistic data. Table III: LSTM design and implementation
A. TeleFOT Data Selection
The Inputs (training data) is a 1912x4 matrix, representing dynamic data: 1912 timesteps of 4 elements. This data selection comprises contextual data: Speed/acceleration and, manoeuvres, distraction type and event information. The Targets 'Severity' is a 1912 x 1 matrix, representing computed probabilities representing the severity classification: 1912 timesteps of 1 element.
Fig. 3. The LSTM Network Implementation
B. Validation & Testing of TeleFoT Data
Training: Data presented to the network during training is described in Table III, and the network is adjusted according to its mean square error (MSE). For better results, we choose 75% of the frame-based training data for LSTM training purposes.
Validation: These are used to measure network
generalization, and to halt training when generalization stops improving. For validation purposes, 15% of the data is used.
Testing: These were selected to have no effect on training
and so provide an independent measure of network performance during and after training. Again, 15% of the data is used for testing, as shown in Table III.
Fig.4. Time series response of LSTM network for distraction severity
C. Results & Discussion
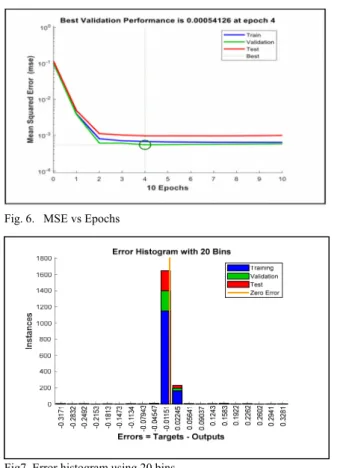
Performance/Response: the performance (MSE) of the network started at 0.0327 and stopped at 0.000541 after 10 iterations or epochs. In Fig.4, the response of the severity distraction model is depicted graphically whereby the targets (training, validation and testing) of the time series (frame-based) data is compared with the actual outputs.
Training/Validation: The training algorithm (Levenberg-Marquardt) required less time to train but needed more memory. The algorithm applies the gradient-descent method to improve performance. In training, the gradient starts at 0.141 and stopped at 0.000219. Training automatically stops when the generalization stops improving, as indicated by an increase in the mean square error of the validation samples, this happened at epoch 10 (validation check time was 6secs) as seen in Fig.5. Fig. 6 show the plot of MSE against the epochs showing the improvement in performance at every iteration from 1 to 4. However, the performance does not improve based on the MSE from iterations 5 to 10. Finally, the error histogram is presented in Fig. 7 describing the zero error and training validation and testing errors.
Fig. 5. LSTM Training using the Gradient descent method.
Target
Values Mean Square Error (MSE) Regression R Training 1338 6.67462e-4 9.90168e-1 Validation 287 5.41263e-4 9.92007e-1 Testing 287 9.62103e-4 9.86073e-1
Fig. 6. MSE vs Epochs
Fig7. Error histogram using 20 bins
VI. CONCLUSIONS AND RECOMMENDATION
The driver’s distraction severity prediction system implemented in this paper significantly improves upon the utilization of a deep learning algorithm for the classification of the driver’s distraction. The LSTM based system not only achieves mean square error on the testing dataset, it also exhibits efficient classification. The evaluation of the approach was carried out on a sample of testing data which is 25% of the images for a single participant. Future work will consider developing a multi-level CNN-based driver detection model and combine this with contextual data to automate the detection of the driver’s distraction and classify severity using a hybrid CNN-LSTM architecture. Furthermore, more contextual environment information will be integrated into the algorithm. In addition, the algorithm can be integrated into ADAS systems in a semi-autonomous vehicle in the future in driver’s take-over or vehicle take-over situations. Furthermore, there will be an improved model that adapts to the driver behaviour in real and corrects the driver’s behaviour thus, application in insurance companies.
REFERENCES
[1] A. Buchenscheit, F. Schaub, F. Kargl, and M. Weber, “A VANET-based emergency vehicle warning system,” in 2009 IEEE Vehicular Networking Conference (VNC), 2009, pp. 1–8.
[2] D. R. Large, E. van Loon, G. Burnett, and S. Pournami, “Applying NHTSA task acceptance criteria to different simulated driving scenarios,” 2015, pp. 117–124.
[3] G. Shakeri, A. Ng, J. H. Williamson, and S. A. Brewster, “Evaluation of Haptic Patterns on a Steering Wheel,” 2016, pp. 129–136. [4] S. Ramm, J. Giacomin, D. Robertson, and A. Malizia, “A First
Approach to Understanding and Measuring Naturalness in Driver-Car Interaction,” 2014, pp. 1–10.
[5] S. Singh, “Critical Reasons for Crashes Investigated in the National Motor Vehicle Crash Causation Survey,” Traffic Safety Facts - Crash Stats, Feb. 2015.
[6] C. Braunagel, W. Rosenstiel, and E. Kasneci, “Ready for Take-Over? A New Driver Assistance System for an Automated Classification of Driver Take-Over Readiness,” IEEE Intelligent Transportation Systems Magazine, vol. 9, no. 4, pp. 10–22, 2017. [7] C. Braunagel, D. Geisler, W. Rosenstiel, and E. Kasneci, “Online
Recognition of Driver-Activity Based on Visual Scanpath Classification,” IEEE Intelligent Transportation Systems Magazine, vol. 9, no. 4, pp. 23–36, 2017.
[8] M. Sameen and B. Pradhan, “Severity Prediction of Traffic Accidents with Recurrent Neural Networks,” Applied Sciences, vol. 7, no. 6, p. 476, Jun. 2017.
[9] S. Alkheder, M. Taamneh, and S. Taamneh, “Severity Prediction of Traffic Accident Using an Artificial Neural Network: Traffic Accident Severity Prediction Using Artificial Neural Network,” J. Forecast., vol. 36, no. 1, pp. 100–108, Jan. 2017.
[10] C. Wang, M. A. Quddus, and S. G. Ison, “Predicting accident frequency at their severity levels and its application in site ranking using a two-stage mixed multivariate model,” Accident Analysis & Prevention, vol. 43, no. 6, pp. 1979–1990, Nov. 2011.
[11] M. M. Kunt, I. Aghayan, and N. Noii, “Prediction For Traffic Accident Severity: Comparing The Artificial Neural Network, Genetic Algorithm, Combined Genetic Algorithm And Pattern Search Methods,” TRANSPORT, vol. 26, no. 4, pp. 353–366, Jan. 2012.
[12] K. Ekambaram, J. Lenard, and S. Reed, “Digital and video analysis of eye-glance movements during naturalistic driving from the ADSEAT and TeleFOT field operational trials-results and challenges,” 2016.
[13] W. Ciscal-Terry, M. Dell’Amico, N. S. Hadjidimitriou, and M. Iori, “An analysis of drivers route choice behaviour using GPS data and optimal alternatives,” Journal of Transport Geography, vol. 51, pp. 119–129, Feb. 2016.
[14] A. Morris et al., “Summary of final results from WP4. 3 through to WP4. 7 as at M54: TeleFOT [Field Operational Tests of Aftermarket and Nomadic Devices in Vehicles] D4. 2.3 b,” 2011.
[15] S. E. R. Franzén, M. Karlsson, A. P. Morris, and R. Welsh, “Widening the Use of the FOT Methodology Development Based on Experiences from the TeleFOT Project,” Procedia - Social and Behavioral Sciences, vol. 48, pp. 1826–1836, 2012.
[16] H. B. Kang, “Various Approaches for Driver and Driving Behavior Monitoring: A Review,” in 2013 IEEE International Conference on Computer Vision Workshops, 2013, pp. 616–623.
[17] B. Chakraborty and K. Nakano, “Automatic detection of driver’s awareness with cognitive task from driving behavior,” 2016, pp. 003630–003633.
[18] C. Yan, H. Jiang, B. Zhang, and F. Coenen, “Recognizing driver inattention by convolutional neural networks,” 2015, pp. 680–685. [19] T. H. N. Le, Y. Zheng, C. Zhu, K. Luu, and M. Savvides, “Multiple
Scale Faster-RCNN Approach to Driver’s Cell-Phone Usage and Hands on Steering Wheel Detection,” 2016, pp. 46–53.
[20] J. Donahue et al., “Long-term Recurrent Convolutional Networks for Visual Recognition and Description,” arXiv:1411.4389 [cs], Nov. 2014.
[21] V. Neale, S. Klauer, T. Dingus, J. Sudweeks, and M. Goodman, “An Overview of the 100-Car Naturalistic Study and Findings,” p. 10. [22] A. P. Smith, “A UK survey of driving behaviour, fatigue, risk taking
and road traffic accidents,” BMJ Open, vol. 6, no. 8, p. e011461, Aug. 2016.
[23] B. G. Simons-Morton et al., “The Effect of Passengers and Risk-Taking Friends on Risky Driving and Crashes/Near Crashes Among Novice Teenagers,” J Adolesc Health, vol. 49, no. 6, pp. 587–593, Dec. 2011.
[24] “TeleFOT - FOT-Net WIKI.” [Online]. Available: http://wiki.fot-net.eu/index.php/TeleFOT. [Accessed: 04-Jan-2017].
[25] “TeleFOT - UK DFOT3 - FOT-Net WIKI.” [Online]. Available: http://wiki.fot-net.eu/index.php/TeleFOT_-_UK_DFOT3. [Accessed: 04-Jan-2017].