A technology-agnostic long-read analysis pipeline for transcriptome
discovery and quantification
Dana Wyman1,2*, Gabriela Balderrama-Gutierrez1,2*, Fairlie Reese1,2, Shan Jiang1,2, Sorena Rahmanian1,2, Weihua Zeng1,2, Brian Williams3, Diane Trout3, Whitney England4, Sophie Chu5, Robert C. Spitale4, Andrea Tenner5, Barbara Wold3, Ali Mortazavi1,2
* These authors contributed equally to this work
1University of California, Irvine, Department of Developmental and Cell Biology, Irvine, CA 92697, USA
2University of California, Irvine, Center for Complex Biological Systems, Irvine, CA
92697, USA
3California Institute of Technology, Division of Biology, Pasadena, CA 91125, USA
4University of California, Irvine, Department of Pharmaceutical Sciences, Irvine, CA 92697, USA
5University of California, Irvine, Department of Molecular Biology and Biochemistry, Irvine, CA 92697, USA
Dana Wyman: [email protected]
Gabriela Balderrama-Gutierrez: [email protected] Fairlie Reese: [email protected]
Shan Jiang: [email protected]
Sorena Rahmanian: [email protected] Weihua Zeng: [email protected]
Brian Williams: [email protected] Diane Trout: [email protected] Whitney England: [email protected] Sophie Chu: [email protected]
Robert Spitale: [email protected] Andrea Tenner: [email protected] Barbara Wold: [email protected] Ali Mortazavi: [email protected]
ABSTRACT
Alternative splicing is widely acknowledged to be a crucial regulator of gene expression and is a key contributor to both normal developmental processes and disease states. While cost-effective and accurate for quantification, short-read RNA-seq lacks the ability to resolve full-length transcript isoforms despite increasingly sophisticated computational methods. Long-read sequencing platforms such as Pacific Biosciences (PacBio) and Oxford Nanopore (ONT) bypass the transcript reconstruction challenges of short-reads. Here we describe TALON, the ENCODE4 pipeline for analyzing PacBio cDNA and ONT direct-RNA transcriptomes. We apply TALON to three human ENCODE Tier 1 cell lines and show that while both technologies perform well at full-transcript discovery and quantification, each technology has its distinct artifacts. We further apply TALON to mouse cortical and hippocampal transcriptomes and find that a substantial proportion of neuronal genes have more reads associated with novel isoforms than annotated ones. The TALON pipeline for technology-agnostic, long-read transcriptome discovery and quantification tracks both known and novel transcript models as well as expression levels across datasets for both simple studies and larger projects such as ENCODE that seek to decode transcriptional regulation in the human and mouse genomes to predict more accurate expression levels of genes and transcripts than possible with short-reads alone.
INTRODUCTION
Differences in gene expression are essential for shaping the wide variety of cell phenotypes present in an organism, both during development and in later life. While humans have around 20,000 protein coding genes, these are thought to produce over 100,000 splice isoforms through alternative splicing, and potentially many more1. Alternative splicing controls which exons are included in the mature mRNA, thus expanding the number of possible transcripts that a single gene can code for. These isoforms can have vastly different functions and may be very specific to a particular tissue or temporal stage2–4. For instance, alternative splicing of the transcription factor erbAα in rats gives rise to one isoform which acts as a transcriptional activator, while a second isoform acts as a repressor5. Furthermore, isoforms of the Mapt gene are known to be differentially expressed in various human neural lineages, and their relative proportions change during progression of Alzheimer’s disease, ultimately leading to the formation of the tangles that kill neurons6.
Alternative splicing is tightly regulated, relying on highly conserved splicing motifs and complex networks of RNA binding protein interactions to function properly7. Disruptions to the splicing process frequently lead to disease, whether in the form of genetic mutations that directly affect splice sites and splicing factors, or more subtle changes that alter the balance between different isoforms6,7. As a result, alternative splicing and exon usage in RNA transcripts have long been the subject of great interest in the context of development and disease. In early studies, the preferred methods for characterizing and measuring isoforms were RT-PCR, Sanger sequencing of expressed
sequence tags (ESTs), and isoform-specific microarrays8. This changed with the availability of next-generation short-read RNA sequencing, which revolutionized genomics by allowing gene expression to be profiled quantitatively in a high-throughput manner9. The ENCODE consortium has been a leader in this field, releasing hundreds of RNA-seq datasets from a variety of human and mouse cell types along with other projects such as GTEx and FANTOM10–12. In the cancer community, the Cancer Genome Atlas (TCGA) serves as a massive source of RNA-seq data from patient samples13.
With the widespread availability of RNA-seq, efforts in the alternative splicing field have focused on studying isoforms using short read data14. However, this is intrinsically challenging, as short-read protocols require cDNA transcripts to be sheared into 50-300 bp pieces prior to sequencing. These pieces are far smaller than typical mammalian transcripts, which can be multiple kilobases in length15. This means that it is not possible to know the exact combination of exons originally present in each transcript molecule. To get around this, computational methods have been developed to reconstruct the transcript models present in a sample and to quantify their abundance. Here, we use the term ‘transcript model’ to describe a distinct set of splice junctions paired with variable 5’ and 3’ ends. Bioinformatics software packages such as Kallisto use expectation-maximization to pseudo-align short reads to a transcriptome reference, generating abundance estimates for transcript and gene models16. These algorithms are effective in broadly identifying which transcripts the reads are compatible with, but they cannot tell exactly which ones were present. An additional drawback is that these methods depend heavily on the choice of reference annotation and, as such, cannot identify novel transcript
models. Another widely used approach to quantifying alternative splicing is to compute short read coverage of specific splice junctions or exons, and compare the resulting counts across samples using statistical tests17,18. While these methods are useful for detecting alternative exon usage, they do not overcome the fundamental limitations of short-read data with respect to assembling and assigning exactly which exons made up the source transcript.
Since 2012, third-generation sequencing platforms such as PacBio and Oxford Nanopore (ONT) have pioneered the use of long reads in genomics19,20. With read lengths of up to 60 kb for PacBio and up to 1 Mb for Oxford Nanopore, these reads can capture entire transcripts from end to end. They also offer the advantage of representing single molecules rather than amplified clusters, making them ideal for sequencing isoforms. Historically, the major drawbacks of long read technologies have been their relatively low throughput and high indel and mismatch error rates ranging up to 15-20%19. In the case of PacBio, the stochastic error rate is mitigated by using circular consensus sequencing, in which multiple sequencing passes over the same molecule are used for error correction21. The exact error rate depands largely on the number of passes that a molecule receives. Computational methods have also been developed to correct errors in long reads, including hybrid approaches that incorporate short reads, and other methods that make use of reference annotations22–25.
Due to the low throughput of the original platforms, the conventional long-read transcriptome sequencing approach was to first catalog isoforms using the long reads
and then map short reads to the resulting transcriptome references for the purpose of quantification26–28. PacBio popularized this method in mammals, plants, and beyond under the name “Iso-seq”. Recently, PacBio yields have increased substantially, producing up to 8 million reads per SMRT cell on the Sequel 2 compared to 150,000 on the older RSII machines. Similar yield increases have been reported for Oxford Nanopore. This increased throughput means that long-read quantification of gene and transcript expression is increasingly practical. Unfortunately, most existing tools for analyzing long-read transcriptome data were not explicitly designed for this purpose. PacBio-affiliated software packages such as ICE-Quiver/Arrow and Cupcake ToFU generate de novo
transcript models by clustering long reads and then merging them to generate one transcript model per cluster26,29. This is a particularly useful approach in species that lack a reference genome; however, it comes with disadvantages. ICE-Quiver has been known to merge together transcripts from highly similar genes and to smooth over real sequence differences such as variants and RNA editing events30. In addition, the algorithm is stochastic by nature, and cluster assignments for individual reads can vary substantially across different runs. All existing programs for transcriptome-wide PacBio annotation and quantification rely on the ICE-Quiver or Cupcake ToFU outputs. For instance, SQANTI uses post-ToFU transcript models and their estimated abundances as the input to its annotation, quantification, and quality control pipeline23. This means that SQANTI cannot currently be applied to long read data from other platforms such as Oxford Nanopore.
Here, we present TALON, the official ENCODE4 pipeline for simultaneous transcript discovery and quantification of long-read RNA-seq data regardless of platform.
This pipeline is designed to explicitly track known and novel transcripts across different bio-samples to allow for annotation and use of new isoforms. The full TALON pipeline is available on GitHub through the ENCODE4 Data Coordinating Center (DCC) at ENCODE-DCC/long-read-rna-pipeline. We first analyze the transcriptomes of three different human ENCODE Tier 1 cell lines using the PacBio and ONT platforms to quantify the relative performance of both platforms. The TALON pipeline allows us to process PacBio and ONT data in a uniform fashion and make direct comparisons between the two. We evaluate the resulting transcriptomes relative to available CAGE, poly(A), and RNA-PET annotations in these cells and find that each long-read technology is affected by different artifacts. We then sequence the transcriptomes of adult mouse hippocampus and cortex to show the applicability of our pipeline for the analysis of complex tissues. Overall, we demonstrate that current long-read platforms are suitable for quantifying and characterizing isoform-level expression of genes.
RESULTS
Tracking transcript novelty and quantification using TALON
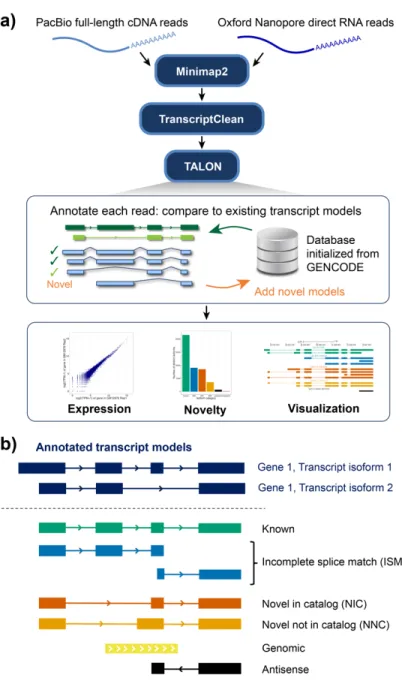
To compare long read platforms side by side and to track isoforms consistently across multiple datasets, we developed a technology-agnostic long read pipeline called TALON (Figure 1A). This pipeline is designed to annotate full-length reads as known or novel transcripts and also to report abundance for these transcripts in a technology agnostic way. Starting from reads mapped to the reference genome, reference-based error correction is performed using TranscriptClean as a pre-processing step to remove microindels, mismatches, and noncanonical splice junctions in a variant-aware manner25.
Noncanonical splice junctions are permitted in the final output only if they are supported by the annotation. Corrected reads are passed into the TALON program, which is built around an SQLite database initialized to contain known genes, transcripts, and exon models from a GTF transcriptome annotation. In a TALON run, each input SAM transcript is compared to the existing transcript models in the database on the basis of its splice junctions, start, and end points. This allows us to not only assign a novel gene or transcript identity where appropriate, but to incorporate new transcript models in the TALON database while characterizing how they differ from known transcript models.
Figure 1. Overview of TALON.a) Full-length reads are mapped to the reference genome using Minimap2. Reference-based error correction is performed using TranscriptClean. Corrected reads are passed into TALON, where they are assigned a gene and transcript label based on comparisons with existing gene and transcript models. If no transcript match is found, a novel model is created to be used in future comparisons. The TALON output can be used for visualization and further analyses.
We adopted the nomenclature introduced by SQANTI to characterize the different types of transcript novelty in our datasets23. Query transcripts with splice junctions that perfectly match an existing model are deemed ‘full splice matches’ (FSMs) and are simply referred to as ‘known’ (Figure 1B). In cases where a transcript matches a subsection of a known transcript model and has a novel putative start or endpoint, it is considered an ‘incomplete splice match’ (ISM). This category is useful as a means of quality control as libraries with a higher proportion of ISMs relative to known transcripts tend to be less than complete in terms of length. We further subdivide the ISM category into prefix ISMs and suffix ISMs. The former refers to ISMs that match along the 5’ end of an existing transcript model, and the latter describes ISMs that match to the 3’ end. It is possible for a transcript to belong to more than one ISM category if it matches to different parts of several existing transcript models.
The next category, novel in catalog (NIC), encompasses transcripts that have known splice donors and acceptors, but new connections between them. This category also includes transcripts that were ISMs with respect to their splice junction use, but had start and endpoints supported by the annotation. Novel not in catalog (NNC) transcripts contain at least one novel splice donor or acceptor. Genomic transcripts overlap an existing gene, but they do not contain any of its splice donors or acceptors. We typically classify genomic transcripts as artifacts. The antisense category consists of transcripts that overlap an existing gene, but are oriented in the opposite direction. If a transcript lacks any overlap with a known gene, then it is deemed intergenic. Taken together, the
novelty categories allow us to examine the types of transcripts that we detect in our long-read datasets, to perform quality control, and to stratify or filter by category.
Biological replicates serve as an important means of verifying novel transcript discoveries. TALON streamlines this process by tracking transcript annotations and abundance across different datasets in one place, where the information can be easily accessed and compared. Our filtering process uses the novelty labels assigned to each observed transcript model in order to remove likely artifacts. Observed transcripts that fully match counterparts in the GENCODE annotation are accepted immediately, but we require that novel transcripts must be reproducibly detected in at least two biological replicate samples in order to be included in the downstream analysis. If additional cell types have been sequenced, it is also possible to cross-reference novel transcripts across these datasets.
Some novel categories are more likely to harbor artifacts than others. For instance, genomic transcripts mostly come from DNA contamination in the samples, and are therefore discarded by the filter, reproducible or not. Incomplete splice match (ISM) transcripts are more ambiguous. Since ISMs are shorter versions of existing transcript models, it is possible that they are the product of RNA degradation or incomplete reverse transcription, particularly if they match the 3’ end of one or more long transcript models. However, this is not always the case. To differentiate between a truly novel ISM transcript and one that is artifactual, it is useful to test against additional genomics data such as
CAGE, RNA-PET, or poly(A) annotations. This can provide external validation to support or reject a new 5’ or 3’ end seen in an ISM transcript.
The TALON approach to quantification relies on the premise that each long read represents an individual transcript molecule sequenced. That allows us to quantify expression by simply counting the number of individual reads that were assigned to a particular transcript or gene and then converting these values into units of transcripts per million (TPM). For gene-level expression values, we then include all reads assigned to a locus except for genomic transcripts, since even incomplete transcripts (ISMs) that did not meet the threshold to become a new transcript model are informative for the overall gene expression level. On the transcript level, however, we apply our TALON filters in order to avoid quantifying transcript models with insufficient evidence.
Performance of TALON on human ENCODE Tier 1 PacBio data
We first applied our long-read analysis pipeline to cDNA from ENCODE Consortium Tier 1 human cell lines sequenced on the PacBio Sequel platform (Table S1). These included lymphoblastoid cell line GM12878, chronic myelogenous leukemia cell line K562, and hepatocellular carcinoma cell line HepG2. A minimum of two biological replicates were sequenced for each, consisting of at least 1 million raw reads per replicate. After running the TALON pipeline, we obtained gene and transcript counts for each sample. The TALON N50 read lengths for the datasets ranged from 1,556 bp at the lowest (HepG2 Rep1) to 1,776 bp at the highest (GM12878 Rep2) (Fig S1a-f). Overall, 13,742 known GENCODE genes and 19,072 GENCODE transcripts were detected in
GM12878 (Table S2-S4). In HepG2, 14,968 known genes and 21,557 transcripts were detected (Table S5-S7). Finally, 13,913 known genes and 20,586 transcripts were detected in K562 (Table S8-S10). The analysis also called 1,993 unknown gene models, the majority of which consisted of monoexonic transcripts mapped as antisense within a known gene locus (Figure S2a). A much smaller set of 183 unknown gene models were reproducible across all three cell lines. Some of these are supported by other high-throughput genomics data tracks, and so are unlikely to be artifacts (Figure S2b).
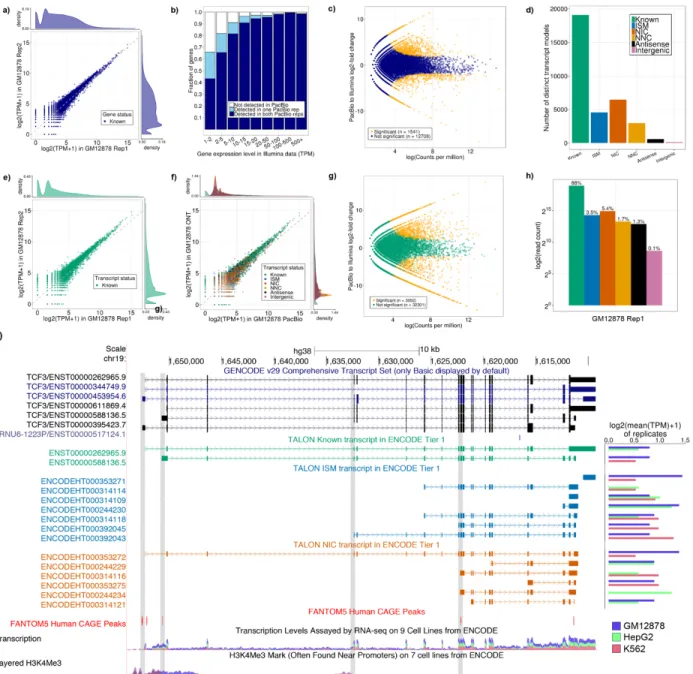
We next computed the expression level of known GENCODE genes across the PacBio data. We included all long reads assigned to a locus in these counts (except genomic transcripts) because even incomplete transcripts are informative for the overall gene expression level. We found gene expression levels to be highly correlated across biological PacBio replicates of each cell line (Pearson r = 0.92) (Figure 2a, S3a, S3b). This shows that our PacBio primary data coupled with the TALON pipeline produces reproducible quantifications of gene expression.
We next compared our PacBio results with short-read RNA-seq data from the same cell lines. First, we examined how often PacBio was able to detect known genes as a function of their short-read expression level (Figure 2b, S3c, S3d). As expected, genes at the lower range of expression (1-5 TPM from short reads) were less likely to be
Figure 2. Performance of TALON on PacBio transcripts from ENCODE human tier 1 cell lines. a) Expression level of known genes (GENCODE v29) in each biological replicate of GM12878 (Pearson r = 0.92). b) Proportion of genes expressed in Illumina RNA-seq data of GM12878 that are also detected in the PacBio GM12878 data, binned by Illumina expression level (TPM). c) Comparison of gene expression levels for known genes in the PacBio and Illumina RNA-seq platforms (GM12878). d) Number of distinct transcript isoforms observed in each novelty category (GM12878) e) Expression level of known transcript models in each biological replicate of GM12878 (Pearson r = 0.86). f) Expression of transcript models in each biological replicate of GM12878, labeled by their novelty assignments. g) Comparison of known transcript expression levels in the PacBio and Illumina RNA-seq platforms (GM12878 Rep 1 and 2). h) Log2 of the total number of PacBio reads assigned to each novelty category after transcript filtering (GM12878 Rep 1). i) Visualization of PacBio-derived custom GTF annotations in the UCSC genome browser for ENCODE tier 1 cell lines. Known transcript models are displayed with the GENCODE-issued 5’ and 3’ ends.
detected by PacBio, but 80% or more of genes expressed above 5 TPM were reproducibly detected. Genes not detected by PacBio tended to be similar to or shorter in length than those that were detected, suggesting that the platform differences were not attributable to a length bias on the part of PacBio (Figure S4a). To examine the effect of increasing read depth on gene detection, we analyzed two additional PacBio replicates of GM12878. At a depth of ~1.5 million reads (about 1 biological replicate), PacBio detected up to 84% of the known genes expressed in the short read data (Figure S4b). Increasing the read depth to 2.5 million (pooling 2 biological replicates) raised this figure to 88%, and 5.5 million reads raised it to 91%. We observed no difference in GC content between the genes that were detected in PacBio versus those that were not (Figure S4c). We conducted a differential expression analysis to ask how much the gene expression levels vary between the platforms. The log fold change between PacBio and Illumina was computed using the exact test method in EdgeR, and Bonferroni correction for multiple testing was performed on the resulting p-values. This analysis revealed that there was no significant difference in expression levels for most genes (Figure 2c, S5a, S5b).
Having established that our pipeline can robustly quantify gene-level expression on the basis of long reads, we moved on to transcript-level quantification. As expected, most of the transcript models identified in our analysis of the extensively-studied
ENCODE tier 1 cell lines were known matches to the GENCODE annotation (Figure 2d, S6a, S6b). The expression levels of these known transcripts were highly correlated across PacBio biological replicates (Pearson r = 0.86) (Figure 2e, S7a, S7b). Novel transcript models that passed the TALON filters also displayed strong expression
correlations (Pearson r ≥ 0.80) (Figure 2f, S7c, S7d). While transcript expression levels were not significantly different for 90% of the transcripts when compared to short-read expression levels, they were about equally higher and lower compared to Illumina for the remaining 10% (Figure 2g, S7e, S7f). About 95% of PacBio reads are full splice matches to known transcript models in GENCODE (88%) or come from NIC and NNC isoforms (Figure 2h, S7g, S7h). In the three cell lines, NIC and NNC transcripts contained a larger number of exons on average than the other novelty categories (Figure S8). Overall, these results indicate that we can reliably quantify transcript models using our long-read pipeline.
GM12878 is an Epstein-Barr Virus (EBV) transformed lymphoblastoid cell line (LCL). We therefore used the GM12878 PacBio transcriptome to characterize the expression of EBV genes. We found that EBV transcripts are detectable using long-read sequencing, and that these transcripts can be quantified, annotated, and assessed for their novelty using TALON (Table S11-13). Overall, 5 known and 18 novel EBV transcript isoforms were detected and 10 known EBV genes were detected (Figure S9a-b). Many detected transcripts belong to the EBNA gene family (Figure S9c), which encode for proteins that are essential to the virus’ ability to transform infected cells into LCLs such as GM1287831, and are typically among the most highly expressed genes from the EBV chromosome in LCLs.32 Consistent with the many detected novel EBNA transcript models, the EBNA transcripts have previously identified as heavily alternatively spliced33.
After verifying TALON’s performance on biological replicates, we analyzed all three ENCODE tier 1 cell lines together, applying the TALON transcript filters and visualizing the resulting transcript models in the UCSC genome browser (Figure 2i, Table S14-16). Overall, we detected two known isoforms of the TCF3 gene and thirteen reproducible novel transcript models. Six of these belonged to the NIC category, and accordingly, most of them had 5’ end support from a FANTOM5 human CAGE peak. The remaining seven novel transcript models were suffix ISMs. None of these
transcripts were supported by a CAGE peak, but one of them, ENCODEHT000314121, had H3K4Me3 5’ end support in the K562 cell line. In particular, the most highly
expressed isoform of TCF3 in GM12878 was the NIC transcript
ENCODEHT000353272, which we also detect in K562 but not HepG2. The short-read RNA-seq reads displayed in the track indicate which exons are present in the three cell lines, but cannot recapitulate full-length transcripts the way that the long reads do, suggesting that there is still a substantial benefit to revisiting well-studied cell-lines using PacBio transcriptomes.
Performance of TALON on Oxford Nanopore data and comparison with PacBio
Oxford Nanopore represents the other major long-read sequencing platform, and has the added advantage of directly sequencing RNA rather than cDNA34. While the protocol involves one reverse-transcription step, it is primarily for the purpose of removing secondary RNA structure and only the RNA-strand is sequenced. In order to demonstrate the applicability of TALON to the Nanopore platform, we directly sequenced RNA from a minimum of two replicates of each ENCODE Tier 1 cell line to an average depth of at
470,000 raw reads per MinION flow cell, which corresponds to our usable throughput on the first generation of MinION RNA flow cell. After basecalling and alignment with Minimap235, each replicate was processed through the TALON long read pipeline as described for PacBio. The TALON N50 read lengths for the datasets ranged from 1,159 bp at the lowest (HepG2 Rep3) to 1,305 bp at the highest (GM12878 Rep1) (Fig S10a-h). Although the starting number of reads was lower than in our PacBio transcriptomes, we detected 12,086 known GENCODE genes and 10,926 known isoforms in GM12878. Gene and transcript expression levels across the two most deeply sequenced GM12878 ONT replicates were correlated (Pearson r = 0.68 and 0.38, respectively), but far less so than their PacBio counterparts (Figure 3a, 3b compared to Figure 2a, 2b; Table S17-19). When we labeled the transcripts by their novelty type, it became apparent that differences in isoform-level expression between ONT replicates are largely driven by overrepresentation of novel ISM transcript models (Figure 3c, 3d). This leads us to believe that ONT is more sensitive to degradation events or is prone to stopping mid-transcript during sequencing, which may explain the high ISM numbers in our data (Figure S11a). The ONT-ONT gene and transcript correlations were similar in K562 and HepG2 (Figure S11b-e; Table S20-25).
Next, we compared gene and transcript expression levels across the PacBio and ONT platforms in each cell line (Figure 3e, S12a-d; Table S26-28). These were correlated overall, but there were some interesting differences. For instance, a number of unannotated antisense transcripts that were called in PacBio transcriptomes were not detected at all in ONT (Figure 3f). This likely means that the antisense transcripts were
in fact artifacts of the reverse transcription steps required for PacBio, demonstrating a drawback of conversion to cDNA before sequencing, at least by the standard methods used for PacBio. However, the ONT direct-RNA sequencing was prone to a different set of issues. As an example of a gene measured differently by the two technologies, we looked at XRCC5, which is involved in DNA repair (Figure 3g; Table S29-31). More novel transcripts models were detected for XRCC5 than known ones. While most of these transcripts met the reproducibility requirement, many of the novel ISM and NIC isoforms captured are consistent with incomplete sequencing of highly expressed genes between replicates (Figure S13). In support of this, our matching PacBio transcriptome, which is sequenced deeper, does not detect as many ISMs as ONT (including some that have CAGE support for the TSS) and detects substantially more known transcripts of the same gene.
Figure 3. Comparison of Oxford Nanopore direct RNA-seq transcriptome with Pacbio transcriptome in GM12878. a-b) 2 GM12878 replicates were sequenced using the MinIon platform and analyzed using TALON pipeline with a) gene expression (Pearson r = 0.68). and
b) transcript expression (Pearson r = 0.38). c) Log2 of the total of read count per novelty category. There is a substantially larger fraction of ISM reads than full-length known compared to PacBio (Fig 2h). d) Number of distinct isoforms by novelty category. e-f) Correlations
between ONT direct RNA-seq and PacBio with e) gene expression (Pearson r = 0.62) and f)
transcript expression (Pearson r = 0.44). g) Isoform annotation and visualization for XRCC5. Transcript models and TPM expression is representative of 3 different cell lines (GM12878, HepG2, and K562). Novel transcripts that pass the TALON filtering criteria are starred. While FANTOM 5 peaks support shorter isoforms detected by ONT direct RNA-seq, TPMs for PacBio detection of the same isoforms is included for reference. The full-length isoform is substantially more highly expressed in the PacBio transcriptome.
Assessing completeness of TALON transcript models using CAGE, poly(A) motifs, and RNA-PET
The exonuclease treatment of our samples at the RNA stage and the full-length classification step in silico are intended to ensure that the transcripts at the end of our pipeline have intact 5’ and 3’ ends. To verify completeness, we performed an integrative analysis comparing our TALON transcript models with data from the CAGE and RNA-PET assays, as well as computationally identified poly(A) motifs. For known transcript models, the annotated GENCODE 5’ and 3’ sites were used.
Figure 4.5’ and 3’ completeness by novelty category. a) Percentage of TALON transcript models with CAGE support for their 5’ end by novelty category (GM12878 PacBio). b
Percentage of TALON transcript models with a poly(A) motif identified at their 3’ end (GM12878 PacBio). c) Percentage of TALON transcript models with RNA-PET support for their 5’-3’ end pair (GM12878 PacBio). d) Percentage of TALON transcript models with CAGE support for their 5’ end by novelty category (GM12878 ONT). e) Percentage of TALON transcript models with a poly(A) motif identified at their 3’ end (GM12878 ONT). f)
Percentage of TALON transcript models with RNA-PET support for their 5’-3’ end pair (GM12878 ONT).
CAGE is a genome-wide method of annotating transcription start sites that works by trapping the 5’ end cap of a mature mRNA transcript and then sequencing its 5’ end. To validate the 5’ ends of our long-read transcript models, we compared them to CAGE-derived TSSs from the FANTOM5 project. 84% of known GENCODE transcripts had CAGE support in our GM12878 PacBio transcriptome, and the results were similar in the other cell lines (Figure 4a, S14a-b). Transcripts in the prefix ISM category were overwhelmingly supported (97%), whereas suffix ISMs were not (24%). 84% of NIC and 91% of NNC transcripts were supported by CAGE, indicating that their 5’ ends were at least as reliable as those of the known transcripts. However, the antisense PacBio transcripts had scant support, lending credence to the idea that they are largely reverse-transcription artifacts. We observed similar CAGE trends in our ONT transcriptome (Figure 4b, S14c-d), although notably, most transcript categories tended to have lower rates of support than in the corresponding PacBio transcriptome.
To examine transcript completeness at the 3’ end, we conducted a computational poly(A) motif analysis of our long-read transcript models. This entailed scanning the last 35 bases of each transcript sequence to look for the presence of a known poly(A) motif. In PacBio, 71% of known transcripts contained such a motif (Figure 4c, S15a-b). Rates of support were also high in the suffix ISM, other ISM, NIC, and NNC categories (83%, 73%, 79%, and 84% respectively). As expected, only 40% of the prefix ISMs contained a poly(A) motif, indicating that many of these transcripts may be the product of internal priming. Overall, the results were similar for the ONT transcripts (Figure 4d, S15c-d).
Finally, we sought to validate the 5’-3’ pairings in our transcript models using publicly available RNA-PET data from the ENCODE consortium for our PacBio and ONT transcriptomes (Figure 4e-f, S16a-d). This assay marks the start and endpoints of individual cDNA transcripts by circularizing and sequencing them with paired-end tags. This data is lower-throughput in nature than the more recently generated CAGE data, which helps explain the lower rates of RNA-PET support for known transcripts. We nevertheless observed strong RNA-PET support for NIC and NNC transcripts in both PacBio and Oxford Nanopore. Of the three ISM categories, prefix ISMs were the most likely to have RNA-PET support for their 5’-3’ end pairing. Antisense transcripts had extremely high rates of RNA-PET support. Again, this is likely an artifact of reverse transcription early in the protocol.
Taken together, the results of our CAGE, poly(A), and RNA-PET analyses indicated that most NIC and NNC transcript models derived from long reads have intact 5’ and 3’ ends, indicating that they are full-length. This was true for both human transcripts and EBV (Figure S17a-b). However, transcripts in the ISM novelty category require more scrutiny. As expected based on the category definition, prefix ISMs had reliable 5’ sites, but their 3’ ends were potentially incomplete in many cases. The reverse was true of suffix ISMs, suggesting that many are artifacts. In general, the PacBio platform did a better job of capturing complete transcripts than direct-RNA ONT, and offered the additional benefit of higher throughput.
Comparison of PacBio transcriptomes of mouse cortex and hippocampus
After demonstrating TALON’s reproducibility and robustness on PacBio data from homogeneous cell lines, we decided to apply the pipeline to study isoforms in the complex tissues of mouse cortex and hippocampus. The cortex and hippocampus are critical regions of the brain for learning because of their functions of neural integration and
memory, respectively36. Therefore, these regions have been characterized exhaustively
under different conditions and models in order to understand the cell subtypes involved37. Regulation of cell diversity is key during processes such as development, aging and disease and it is carefully orchestrated by multiple factors that generate changes in gene and isoform-level expression37.
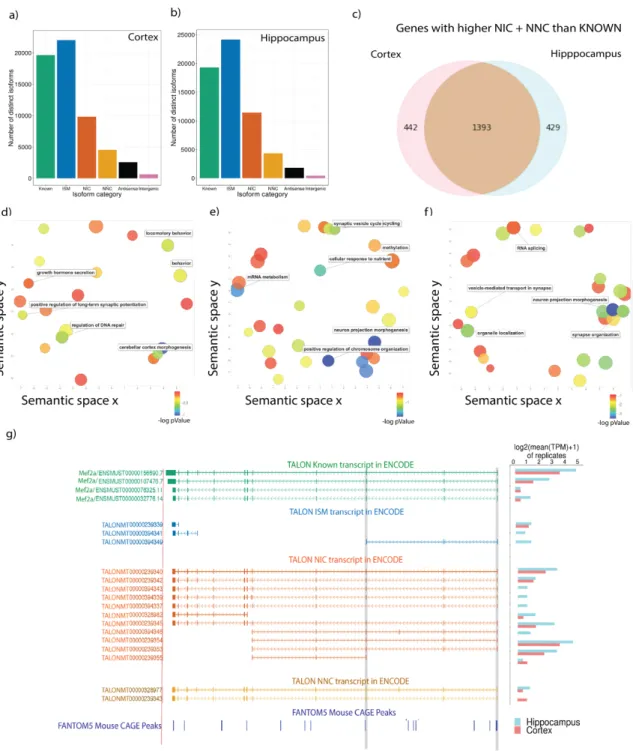
We sequenced two PacBio replicates each of cortex and hippocampus to a minimum depth of 2.5 million reads per replicate and ran TALON on them (Table S32-38). Gene expression was highly correlated across biological replicates (Pearson r > 0.9) (Figure S18a-d) and on average, we detected 10,000 known genes and 14,000 known transcripts for each tissue. The diversity of the isoform categories was similar between cortex and hippocampus (Figure 5a, 5b). We focused our analysis on genes that had more reads assigned to NIC and NNC novel isoforms than known transcript models for both areas and found a shared set of 1,393 genes with an additional 442 and 429 being specific to cortex and hippocampus, respectively (Figure 5c; Table S34-36). In order to understand the gene categories that had more novel than known transcripts in our transcriptomes, we performed a GO analysis using Metascape38 and REVIGO39 for visualization and semantically arranged the terminology. We found that key genes
involved in locomotor behavior, long-term synaptic potentiation, and behavior are enriched in the cortex-specific set, which is the main center of knowledge integration and movement (Figure 5d; Table S37). The hippocampus was enriched for terms associated with synaptic vesicles and neuron projection (Figure 5e; Table S38). Not surprisingly, the shared terms for cortex and hippocampus are related to synaptic terms, mostly because there is significant set of ATPase and GTPase metabolism genes as well as cell to cell adhesion molecules (Figure 5f; Table S39). Interestingly, RNA splicing GO terms are associated with this group of under-annotated transcript models. Since the brain is known to have a high alternative splicing ratio when compared to other tissues, this is unsurprising, but it may also suggest that alternative splicing of these particular RNA-splicing factors play a role in increasing transcript diversity in these tissues40.
Mef2a is a widely expressed transcription factor that is most highly expressed in muscle and brain tissues. In particular, Mef2a plays a crucial role in the differentiation and maturation of neural cells41. In regions such as the hippocampus, the Mef2 family can control the number of synapses and dendrite remodeling42. We find 13 novel isoforms that pass platform-specific filtering from a total of 20 isoforms, all of which contain the DNA binding domain (Figure 5g). We then predicted protein sequences for these novel transcripts using TransDecoder43 and performed protein domain analysis searches on the resultant sequences using Hmmer44 and Pfam45. This analysis revealed that all but 3 of the novel transcript isoforms are predicted to include the DNA binding domain, and those that lack the DNA binding domain have incomplete predicted ORFs. Other notable protein domain changes in predicted ORFs from novel Mef2a transcripts include a protein isoform
predicted to lack the beta-sandwich domain (ENCODEM00000394337) that is present in all known Mef2a protein isoforms except one. Overall, the diversity of novel isoforms that we detect even in well-studied tissues such as cortex and hippocampus suggest that we will detect even more novel isoforms in less well-studied samples using long reads.
Figure 5. PacBio transcriptomes of 6-month male adult mouse cortex and hippocampus.a-b) Isoform diversity isoform for one representative dataset of cortex and hippocampus. c) 2262 genes with higher novelty read counts (NIC + NNC) than known of which 442 are only higher in cortex and 428 higher in hippocampus. d-f) GO semantic maps for d) cortex genes, e) hippocampus, and f) shared. g) Example of Mef2a isoforms expression in cortex and hippocampus.
DISCUSSION
Here, we demonstrate that with sufficient sequencing depth (> 1 million reads), long reads are able to reproducibly quantify gene and transcript expression in
homogeneous cell lines and in complex tissues. We introduce a technology-agnostic long-read pipeline, TALON, that simplifies the process of comparing long-read transcriptomes across different datasets and that allows PacBio and ONT transcriptomes to be directly compared. We find that PacBio is reasonably
well-correlated with Illumina, particularly for gene expression levels above 5 TPM. We further found that current PacBio captures more complete transcript models than current direct-RNA ONT, but that the former is prone to antisense transcript artifacts that apparently stem from the reverse transcription step to cDNA. It is likely that many of the ISM transcripts that we detect more prominently in ONT are false positives due to a pore ceasing to sequence midway through. While most of the transcript models we detect in the well-studied human ENCODE tier 1 cell lines are already known, we nonetheless found evidence of a number of new transcripts with 5’ and 3’ ends that are
independently supported by other genomics assays. In contrast to the much-measured and homogeneous cell lines, we found that a substantial number of genes in mouse cortex and hippocampus had more reads from novel (NIC and NNC) isoforms than known ones. Not surprisingly, this suggests that we are still underestimating the overall contributions of alternative-splicing for tissues that are both more complex in terms of cell composition and also less-comprehensively assessed. At this time, the goal of producing a reference-level annotation transcriptome for any given cell type or tissue, is well served by the PacBio platform, our results also make it clear that any platform that
provides RNA modification data by direct RNA sequencing, as the RNA ONT platform now does, is very important. As iterative advances are made on these platforms, and as possible new long-read systems are added to the mix, the ability to process and compare the outputs from all versions of all systems in a platform agnostic way will be increasingly important.
In addition to the technology-specific challenges of each platforms, there are some shared issues. While both technologies could sequence most of the transcripts expressed in the cells, some very long transcripts were conspicuously missing or under-represented in our data. In particular, both GM12878 and K562 are female cell lines, but we only detected the highly expressed XIST transcript as a “full splice match” in a single PacBio GM12878 replicate. Even this one match lacked several kb from the 5’ end of the GENCODE model. More generally, while NIC and NNC transcript models looked identical or better than known transcripts in terms of CAGE, poly(A), and RNA-PET validation, ISMs represent a challenge for both technologies. This is particularly
pressing as we detect more such ISMs in our brain tissue biosamples than in cell lines. We expect that ISMs will be a challenge in the human post-mortem tissue samples, including reference collection efforts for ENCODE4, because RNA quality is typically lower than what can be obtained from cell lines and fresh mouse tissue sources.The “Iso-seq” approach to this has been to collapse ISM reads onto known transcripts. However our results show that a subset of ISMs have CAGE and 3’ end support. They are currently difficult to distinguish from truncated reads without at least CAGE support. Interestingly, the XIST locus is crowded with CAGE peaks throughout its longest
transcript model, potentially suggesting that there are many “shorter” isoforms produced than previously appreciated, with evidence of them ignored due to the lack of resolution using short-reads alone. ISMs are in any case useful as we incorporate them in our gene quantification. With additional datasets and evidence, we anticipate that machine learning techniques will allow us to distinguish real ISMs from artifacts. Until then, it seems prudent to ignore ISMs for transcript discovery in the absence of CAGE (or similar) support.
A large and compelling biological question about RNA splicing, still unanswered, is brought to the fore as more long-read RNA data accumulate and produce evidence for more isoforms: is it that the ever-increasing number of novel isoforms that we detect are simply the natural consequence of the underlying combinatorial nature of alternative splicing? If a “typical” gene has 10 independent alt-splicing locations and we observed every combination, we would expect 1024 models. While there might be one (or even a few) dominant isoform in a given cell type or tissue, it is possible that the dominant isoform could switch based on the cell-type specific expression of RNA splicing factors. From a bioinformatics perspective, this presents a challenge as to whether we should represent the full set of 1024 possible isoform entries in a GTF file or as graphical model such as a Hidden Markov Model is an issue that the field will have to face sooner or later. These models may be particularly useful for capturing the 5’ and 3’ differences that are clearly there but can lead to a different type of functional novelty than changes to ORFs. Last but not least, there is the issue of what downstream consequences arise from novel isoforms, particularly for protein-coding genes. Once again, this is
challenging for ISMs as they would predict truncated ORFs, whereas NIC and NNC transcripts are more likely to produce a functional product.
While challenges remain to generating perfect long-read transcriptomes from imperfect RNA and still relatively noisy sequencing, there is no longer a good
justification for doing “pooled” short-read RNA-seq for reference-annotation-level transcriptomics using high-quality (i.e. not degraded) mRNA other than the cost of a study. While the cost of sequencing using long reads is about an order of magnitude higher than using short reads, they are now comparable to the cost of short-read RNA-seq 10 years ago and we can expect this to continue dropping. The field of single-cell RNA-seq is currently thriving on techniques that use short-read single-read for molecule counting, but even here, switching to long reads will have a beneficial impact46. Short-read sequencing will still have a place for quantifying short RNAs, degraded mRNAs from otherwise unavailable samples, or where thousands of samples need only be compared to a reference transcriptome likely produce from a few long-read
transcriptomes. However, switching to long reads will finally allow us to accurately characterize and quantify mRNA in the actual functional form used by the cell to run the transcriptional programs that drive developmental decisions and responses to its
METHODS
Sample collection and RNA extraction
GM12878, K562 and HepG2 were grown and harvested as described in the ENCODE consortium protocols (encodeproject.org). Total RNA was extracted using the QIAGEN RNAEasy Plus kit (Cat. No. 74134). All animal experimental procedures were approved by the Institutional Animal Care and Use Committee of University of California, Irvine, and performed in accordance with the NIH Guide for the Care and Use of Laboratory Animals. Mice were anesthetized with isoflurane and perfused with phosphate buffered saline (PBS). Hippocampus and Cortex from two 6-month male C57BL/6 mice were dissected and collected in HBSS no calcium no magnesium solution (cat. No. 14170112). Tissues were dissociated with syringes while in lysis buffer included in the QIAGEN RNAEasy Plus kit (Cat. No. 74134). Total RNA extraction was done following the vendor instructions. To degrade mRNA without a 5’ cap, total RNA was exposed to an exonuclease treatment using Terminator™ 5´-Phosphate-Dependent Exonuclease (Cat. No. TER51020).
PacBio Library Preparation and Sequencing
Starting from the depleted RNA, we followed a modified version of the SMART-seq2 protocol to synthesize cDNA47. 500 ng of cDNA were used as input for the PacBio library prep following the SMRTbell Template Prep Kit 1.0 instructions. Sequencing was done on the Sequel platform, with at least 2 SMRT cells per cell line and 4 SMRT cells per tissue. Raw PacBio subreads were processed into circular consensus reads using the Circular Consensus step (CCS) from the SMRTanalysis 6.0 software suite. Next,
full-length non-chimeric (FLNC) reads were identified using the SMRTanalysis Classify step. Reads were considered FLNC if they contained the expected arrangement of 5’ and 3’ PacBio primers in addition to a poly-(A) tail. Poly-A tails and adapters were removed at this stage. FLNC reads were mapped to the reference genome using Minimap2 version 2.15 (GRCh38 assembly for human cell types, and mm10 for mouse) with parameters recommended by Pacific Biosciences. Reads that did not map to the main chromosomes were removed.
ONT Library Preparation and Sequencing
Starting from 3 μg of depleted RNA, we proceeded to the direct-RNA library prep following the RNA-001 kit instructions. Reverse transcription was used to get rid of secondary RNA structures. We used 1 flowcell (R9.4) per replicate and MinKNOWN 2.0 was used to run the samples. We sequenced at least 2 biological replicates per cell line. Live basecalling was performed on the direct RNA ONT reads using ONT Albacore Sequencing Pipeline Software (version 2.3.1). ONT reads were mapped to the reference genome using Minimap2 version 2.15 (GRCh38 assembly for human cell types, and mm10 for mouse). We used parameters recommended for ONT by the Minimap2 documentation. Reads that did not map to the main chromosomes were removed.
TALON pipeline
Following alignment to the genome, reference-based error correction was performed on the PacBio FLNC and ONT reads using TranscriptClean v1.0.7 (available on GitHub at https://github.com/dewyman/TranscriptClean). Reference splice junctions were derived
from the GENCODE annotations using TranscriptClean accessory script
get_SJs_from_gtf.py. For the human runs, we used common variants from dbSNP Build 150 (April 2017 release) in the VCF format to run TranscriptClean in variant-aware mode. After TranscriptClean, any reads that still contained one or more un-annotated noncanonical splice junctions were removed using a custom Python script.
Human and mouse TALON databases were initialized from the GENCODE v29 and GENCODE vM21 comprehensive GTF annotations (reference chromosomes only). During initialization, transcript models were required to be at least 300 nt long. TALON (version 4.1) was run on the PacBio and ONT reads in order to annotate them. The resulting TALON database was used for downstream analysis. TALON is available from https://github.com/dewyman/TALON.
To perform long read quantification, transcript abundances were extracted from the database using the TALON create_abundance_file_from_database.py utility. For gene quantification, unfiltered abundance files were used (with the exception of genomic transcripts, which were removed). For transcript-level quantification, post-TALON filtering was performed to remove novel transcripts that were not reproducibly detected across biological replicates. For the joint analysis of Tier 1 cell lines on the same platform, transcripts were required to appear in at least two datasets to pass the filters (different cell lines permissible). These filters were also applied when generating custom GTF-formatted transcriptomes using the create_GTF_from_database.py TALON utility.
Further details and custom scripts for data visualization are available on GitHub (dewyman/ TALON-paper-2019).
PacBio vs. Illumina short read comparison
Illumina short-read RNA-seq reads from GM12878, K562, and HepG2 were downloaded from the ENCODE portal in the fastq format (accessions ENCSR000AEH, ENCSR000AEQ, and ENCSR000EYR). Quantification against the GENCODE v29 annotation was performed on each biological replicate using Kallisto16. Prior to comparisons with PacBio, the Kallisto results were filtered to remove mitochondrial genes, transcripts less than 300 basepairs in length, and genes/transcripts expressed at < 1 TPM. The log fold change between PacBio and Illumina was computed using the exact test method in EdgeR following normalization, and Bonferroni correction for multiple testing was performed on the resulting p-values. Genes/transcripts were considered significantly different in the two platforms if p ≤ 0.01 and abs(logFC) > 1.
Comparison of PacBio and ONT transcriptomes
We calculated gene quantification using the unfiltered TALON abundance files with genomic transcripts removed. For transcript quantification, we used the filtered abundance files, where we kept novel transcripts that were reproducible. Scatter plots in Figure 3 were done using the most deeply sequenced ONT replicate compared to replicate 1 from PacBio.
CAGE analysis
Robust human CAGE peaks were downloaded from FANTOM5 in the BED format12. The genomic coordinates were mapped from hg19 to hg38 using the UCSC genome browser LiftOver tool48. We obtained the start site of each long-read transcript
model from our GTF transcriptomes, then used Bedtools to ascertain whether any CAGE peak overlapped the 100 bp region immediately up or downstream of each TSS49.
A similar analysis was also conducted using CAGE IDR peaks for GM12878, K562, and HepG2 from the ENCODE portal (accessions ENCFF853HOH, ENCFF698DQS, and ENCFF246WDH). In this case, long-read transcripts were matched to CAGE data from the same ENCODE cell line.
Computational Poly(A) motif analysis
Each GTF transcript model was converted to BED format. We extracted the DNA sequence of the last 35 bp in each transcript using the reference genome (GRCh38 assembly for human cell types, and mm10 for mouse), then searched for the presence of a known 6-mer poly(A) motif as described in Anvar et al., 201850.
RNA-PET analysis
RNA-PET clusters for GM12878, K562, and HepG2 were downloaded in the BED format from the ENCODE portal (accessions ENCFF001TIL, ENCFF001TJA, and ENCFF001TIR ). The genomic coordinates were mapped from hg19 to hg38 using the UCSC genome browser LiftOver tool48. We obtained the start and end site of each long-read transcript model from our GTF transcriptomes, then used Bedtools to check whether any pair of RNA-PET clusters was located within 100 bp of the start and end49.
Gene and transcript abundances were calculated as described above. We used a custom script to identify genes that had higher novelty counts (NIC+NNC) separately for cortex and hippocampus and identified the overlapping genes. To assess the function of these genes and their biological process roles we input it into metascape (http://metascape.org) using an express analysis for mouse. We extracted the Metascape GOterm IDs along with their p-value to use as input for REVIGO(http://revigo.irb.hr) and created a semantic plot to summarize the GO terms. ORF prediction for Mef2a was performed using TransDecoder43, and subsequent predicted amino acid sequences were BLASTed against known Mef2a protein sequences to determine similarity of novel transcript predicted protein sequences to known protein sequences51. The predicted protein sequences were also run through Hmmer against the Pfam database to determine domain content44,45.
ACKNOWLEDGMENTS
We would like to thank Melanie Oakes at UC Irvine Genomics High-Throughput Facility (GHTF) for her help with PacBio sequencing as well as the entire ENCODE DCC for help implementing the TALON pipeline at the ENCODE portal. This work was supported in part by grants from the National Institutes of Health (UM1HG009443 to A.M. and B.W. as well as R01AG060148 to A.M and A.T.).
Figure S1. TALON read length distributions for PacBio ENCODE Tier 1 datasets. a) GM12878 Rep 1. b) GM12878 Rep 2. c) K562 Rep 1. d) K562 Rep 2. e) HepG2 Rep 1. f) HepG2 Rep 2.
Figure S2. Characterization of unknown genes detected by PacBio in ENCODE tier 1 cell lines. a) Fraction of unknown genes belonging to various subcategories of novelty. b) UCSC genome browser visualization of a novel gene that was reproducibly detected in GM12878, K562, and HepG2.
Figure S3. PacBio gene expression in K562 and HepG2. a-b) Expression level of known genes in each biological replicate of a) HepG2 (Pearson r = 0.92), and b) K562 (Pearson r = 0.92). c-d) Proportion of genes expressed in Illumina RNA-seq data of c) HepG2 and d) K562 that are also detected in the corresponding PacBio data, binned by Illumina expression level (TPM).
Figure S4. Further characterization of gene detection in GM12878 by short reads and PacBio long reads. a) Length of known genes binned by short-read expression level in GM12878 and colored by PacBio detection status. Gene length was computed by taking the median length of all known transcripts per gene. b) Detection of known genes as a function of PacBio read depth in GM12878. The number of short-read genes that were detected in PacBio is shown cumulatively for each possible ordering of four PacBio datasets. c) GC content of known genes that were detected in at least one of four PacBio replicates, versus those that were detected in short reads only.
Figure S5. Comparison of known gene expression levels across the PacBio and Illumina RNA-seq platforms. a) HepG2, and b) K562.
Figure S6. Number of distinct transcript isoforms observed per novelty category in PacBio datasets. a) HepG2, and b) K562.
Figure S7. PacBio transcript expression in K562 and HepG2. a-b) Expression level of known transcript models in each biological replicate of a) HepG2 (Pearson r = 0.86) and b) K562 (Pearson r = 0.86). c-d) Expression of transcript models in each biological replicate of c) HepG2 (Pearson r = 0.85) and d) K562 (Pearson r = 0.85), labeled by their novelty assignments. e-f) Comparison of known transcript expression levels across the PacBio and Illumina RNA-seq platforms in e) HepG2 and f) K562. g-h) Log2 of the total number of PacBio reads assigned to each novelty category after transcript filtering in g) HepG2 rep 1 and h) K562 rep 1.
Figure S8. Number of exons per transcript model detected in PacBio ENCODE tier 1 cell line transcriptomes. Transcripts are grouped by novelty type assignment.
Figure S9. Epstein-Barr Virus transcriptome characterization in GM12878. a) Gene expression levels in GM12878 from the EBV chromosome and from the human chromosomes, labelled by gene novelty. b) Transcript expression levels in GM12878 from the EBV chromosome and from the human chromosomes, labelled by transcript novelty. Novel transcripts have been filtered for reproducibility between GM12878 biological
replicates. c) Visualization of TALON GTF annotations in the UCSC genome browser for EBV transcripts in GM12878.
Figure S10. TALON read length distributions for Nanopore ENCODE Tier 1 cell line datasets. a) GM12878 Rep 1. b) GM12878 Rep 2. c) GM12878 Rep 3. d) K562 Rep 1. e) K562 Rep 2. f) HepG2 Rep 1. g) HepG2 Rep 2. h) HepG2 Rep 3.
Figure S11. Characterization of ENCODE tier 1 cell lines by Oxford Nanopore direct-RNA sequencing. a) Expression level of known transcript models and reproducible ISMs in PacBio vs. ONT for GM12878 (Pearson r = 0.21). b-c) Expression levels of known genes in two biological replicates of b) HepG2 (Pearson r = 0.84) and c) K562 (Pearson r = 0.73). d-e) Expression level of known GENCODE v29 transcript models and reproducible ISMs in two ONT biological replicates of d) HepG2 (Pearson r = 0.60) and e) K562 (Pearson r = 0.51).
Figure S12. Comparison of ONT and PacBio platforms in HepG2 and K562. a-b) Expression levels of known genes and reproducible antisense genes in PacBio vs. ONT for a) HepG2 (Pearson r = 0.75) and b) K562 (Pearson r = 0.75). c-d) Expression level of known transcript models and reproducible ISMs in PacBio vs. ONT for c) HepG2 (Pearson 0.27) and d) K562 (Pearson r = 0.34).
Figure S13. PacBio and ONT GM12878 post-TranscriptClean reads mapping to the XRCC5 locus.
Figure S14. CAGE support by novelty category in HepG2 and K562. a-d) Percentage of TALON transcript models with CAGE support for their 5’ end by novelty category in a) HepG2 PacBio, b) K562 PacBio, c) HepG2 ONT, and d) K562 ONT.
Figure S15. Poly(A) motif support by novelty category in HepG2 and K562. a-d) Percentage of TALON transcript models with a computationally predicted poly(A) motif within 35 nt of the 3’ end by novelty category in a) HepG2 PacBio, b) K562 PacBio, c) HepG2 ONT, and d) K562 ONT.
Figure S16. RNA-PET support by novelty category in HepG2 and K562. a-d) Percentage of TALON transcript models with RNA-PET support for their 5’-3’ end pair by novelty category in a) HepG2 PacBio, b) K562 PacBio, c) HepG2 ONT, and d) K562 ONT.
Figure S17. 5’ and 3’ end completeness of PacBio Epstein-Barr Virus transcripts. a)
Percentage of TALON EBV transcript models with CAGE support for their 5’ end by novelty category. b) Percentage of TALON EBV transcript models with a computationally predicted poly(A) motif within 35 nt of the 3’ end by novelty category.
Figure S18. Reproducibility of PacBio gene and transcript expression in mouse cortex and hippocampus. a) Expression level of known genes in each cortex biological replicate. b) Expression level of known transcripts in each cortex biological replicate. c)
Expression level of known genes in each hippocampus biological replicate. d) Expression level of known transcripts in each hippocampus biological replicate.
Supplementary Tables
Table S1 ENCODE/GEO IDs for generated data
Table S2 GM12878 PacBio GTF transcriptome annotation Table S3 GM12878 PacBio unfiltered abundance file Table S4 GM12878 PacBio filtered abundance file Table S5 HepG2 PacBio GTF transcriptome annotation Table S6 HepG2 PacBio unfiltered abundance file Table S7 HepG2 PacBio filtered abundance file Table S8 K562 PacBio GTF
Table S9 K562 PacBio unfiltered abundance file Table S10 K562 PacBio filtered abundance file
Table S11 EBV PacBio GTF transcriptome annotation Table S12 EBV PacBio unfiltered abundance file Table S13 EBV PacBio filtered abundance file
Table S14 Combined Tier 1 PacBio GTF transcriptome annotation Table S15 Combined tier 1 PacBio unfiltered abundance file Table S16 Combined tier 1 PacBio filtered abundance file Table S17 GM12878 ONT GTF transcriptome annotation Table S18 GM12878 ONT unfiltered abundance file Table S19 GM12878 ONT filtered abundance file Table S20 HepG2 ONT GTF
Table S21 HepG2 ONT unfiltered abundance file Table S22 HepG2 ONT filtered abundance file Table S23 K562 ONT GTF
Table S24 K562 ONT unfiltered abundance file Table S25 K562 ONT filtered abundance file Table S26 Combined Tier 1 PacBio/ONT GTF
Table S27 Combined Tier 1 PacBio/ONT unfiltered abundance file Table S28 Combined Tier 1 PacBio/ONT filtered abundance file Table S29 Combined Tier 1 ONT GTF
Table S30 Combined Tier 1 ONT unfiltered abundance file Table S31 Combined Tier 1 ONT filtered abundance file Table S32 Mouse brain GTF
Table S33 Mouse brain abundance filtered Table S34 Mouse brain abundance no filter
Table S35 Cortex and Hippocampus genes with more NIC+NNC than known reads filtered
Table S36 Cortex and Hippocampus genes with more NIC+NNC than known reads filtered by category in Fig 5c
Table S37 Go terms enriched in cortex specific genes from Table S36
Table S38 GO terms enriched in hippocampus-specific genes from Table S36 Table S39 GO terms enricjed in common genes from Table S36
REFERENCES
1. Nilsen, T. W. & Graveley, B. R. Expansion of the eukaryotic proteome by alternative splicing. Nature 463, 457–463 (2010).
2. Yang, X. et al. Widespread Expansion of Protein Interaction Capabilities by Alternative Splicing. Cell 164, 805–17 (2016).
3. Kalsotra, A. & Cooper, T. A. Functional consequences of developmentally regulated alternative splicing. Nat. Rev. Genet. 12, 715–729 (2011).
4. Foulkes, N. S. & Sassone-Corsi, P. More Is Better: Activators and Repressors from the Same Gene. Cell 66, (1992).
5. Koenig, R. J. et al. Inhibition of thyroid hormone action by a non-hormone binding c-erbA protein generated by alternative mRNA splicing. Nature 337, 659–661 (1989).
6. Love, J. E., Hayden, E. J. & Rohn, T. T. Alternative Splicing in Alzheimer’s Disease. J. Park. Dis. Alzheimer’s Dis. 2, (2015).
7. Wang, Z. & Burge, C. B. Splicing regulation: from a parts list of regulatory elements to an integrated splicing code. RNA 14, 802–13 (2008).
Alternative Splicing Variation in Human Populations. Am. J. Hum. Genet. 102, 11– 26 (2018).
9. Mortazavi, A., Williams, B. A., McCue, K., Schaeffer, L. & Wold, B. Mapping and quantifying mammalian transcriptomes by RNA-Seq. Nat. Methods 5, 621–628 (2008).
10. Davis, C. A. et al. The Encyclopedia of DNA elements (ENCODE): data portal update. Nucleic Acids Res. 46, D794–D801 (2018).
11. Lonsdale, J. et al. The Genotype-Tissue Expression (GTEx) project. Nat. Genet.
45, 580–585 (2013).
12. Lizio, M. et al. Gateways to the FANTOM5 promoter level mammalian expression atlas. Genome Biol. 16, 22 (2015).
13. Tomczak, K., Czerwińska, P. & Wiznerowicz, M. The Cancer Genome Atlas (TCGA): an immeasurable source of knowledge. Contemp. Oncol. (Poznan, Poland) 19, A68-77 (2015).
14. Pan, Q., Shai, O., Lee, L. J., Frey, B. J. & Blencowe, B. J. Deep surveying of alternative splicing complexity in the human transcriptome by high-throughput sequencing. Nat. Genet. 40, 1413–1415 (2008).
15. Conesa, A. et al. A survey of best practices for RNA-seq data analysis. Genome Biol. 17, 13 (2016).
RNA-seq quantification. Nat. Biotechnol. 34, 525–527 (2016).
17. Vaquero-Garcia, J. et al. A new view of transcriptome complexity and regulation through the lens of local splicing variations. Elife 5, (2016).
18. Shen, S. et al. rMATS: robust and flexible detection of differential alternative splicing from replicate RNA-Seq data. Proc. Natl. Acad. Sci. U. S. A. 111, E5593-601 (2014).
19. Eid, J. et al. Real-Time DNA Sequencing from Single Polymerase Molecules.
Science (80-. ). 323, 133–138 (2009).
20. Feng, Y., Zhang, Y., Ying, C., Wang, D. & Du, C. Nanopore-based Fourth-generation DNA Sequencing Technology. Genomics. Proteomics Bioinformatics
13, 4–16 (2015).
21. Rhoads, A. & Au, K. F. PacBio Sequencing and Its Applications. Genomics, Proteomics and Bioinformatics (2015). doi:10.1016/j.gpb.2015.08.002
22. Choudhury, O., Chakrabarty, A. & Emrich, S. J. HECIL: A Hybrid Error Correction Algorithm for Long Reads with Iterative Learning. Sci. Rep. 8, 9936 (2018).
23. Tardaguila, M. et al. SQANTI: extensive characterization of long-read transcript sequences for quality control in full-length transcriptome identification and quantification. Genome Res. (2018). doi:10.1101/gr.222976.117
24. Abdel-Ghany, S. E. et al. A survey of the sorghum transcriptome using single-molecule long reads. Nat. Commun. 7, 11706 (2016).
25. Wyman, D. & Mortazavi, A. TranscriptClean: variant-aware correction of indels, mismatches and splice junctions in long-read transcripts. Bioinformatics 35, 340– 342 (2019).
26. Gordon, S. P. et al. Widespread Polycistronic Transcripts in Fungi Revealed by Single-Molecule mRNA Sequencing. PLoS One 10, e0132628 (2015).
27. Tilgner, H., Grubert, F., Sharon, D. & Snyder, M. P. Defining a personal, allele-specific, and single-molecule long-read transcriptome. Proc. Natl. Acad. Sci.
(2014). doi:10.1073/pnas.1400447111
28. Wang, B. et al. Unveiling the complexity of the maize transcriptome by single-molecule long-read sequencing. Nat. Commun. 7, 11708 (2016).
29. Tseng, E. Cupcake ToFU.
30. Sahlin, K., Tomaszkiewicz, M., Makova, K. D. & Medvedev, P. Deciphering highly similar multigene family transcripts from Iso-Seq data with IsoCon. Nat. Commun.
9, 4601 (2018).
31. Humme, S. et al. The EBV nuclear antigen 1 (EBNA1) enhances B cell
immortalization several thousandfold. Proc. Natl. Acad. Sci. U. S. A. 100, 10989– 94 (2003).
32. Arvey, A. et al. An Atlas of the Epstein-Barr Virus Transcriptome and Epigenome Reveals Host-Virus Regulatory Interactions. Cell Host Microbe 12, 233–245 (2012).