On the Distribution of Protein Refractive Index Increments
Huaying Zhao,†Patrick H. Brown,‡and Peter Schuck†*
†Dynamics of Macromolecular Assembly Section, Laboratory of Cellular Imaging and Macromolecular Biophysics, and‡Biomedical
Engineering and Physical Sciences Shared Resource, National Institute of Biomedical Imaging and Bioengineering, National Institutes of Health, Bethesda, Maryland
ABSTRACT The protein refractive index increment,dn/dc, is an important parameter underlying the concentration determina-tion and the biophysical characterizadetermina-tion of proteins and protein complexes in many techniques. In this study, we examine the widely used assumption that most proteins havedn/dcvalues in a very narrow range, and reappraise the prediction ofdn/dcof unmodified proteins based on their amino acid composition. Applying this approach in large scale to the entire set of known and predicted human proteins, we obtain, for the first time, to our knowledge, an estimate of the full distribution of proteindn/dc
values. The distribution is close to Gaussian with a mean of 0.190 ml/g (for unmodified proteins at 589 nm) and a standard devi-ation of 0.003 ml/g. However, small proteins<10 kDa exhibit a larger spread, and almost 3000 proteins have values deviating by more than two standard deviations from the mean. Due to the widespread availability of protein sequences and the potential for outliers, the compositional prediction should be convenient and provide greater accuracy than an average consensus value for all proteins. We discuss how this approach should be particularly valuable for certain protein classes where a highdn/dcis coin-cidental to structural features, or may be functionally relevant such as in proteins of the eye.
INTRODUCTION
The question of what is the refractive index increment of proteins, and whether it is a constant, dates back more than a century (1–3). The knowledge of this parameter is important in many biophysical techniques. This includes the refractometric measurement of protein concentrations in analytical ultracentrifugation (AUC), surface plasmon resonance and other label-free optical biosensors, and the determination of protein molecular mass from the intensity of scattered light (4–8). The protein refractive index is also a key parameter in various types of optical imaging. Further-more, knowing the molecular refractive index contribution of macromolecular components is crucial for understanding the optical properties, structure, and function of different tissues in the eye.
It is widely recognized that unmodified proteins, in the absence of significant solvation effects and ligand binding, generally do not have very different refractive index incre-ments, and that a consensus value may be used in a good approximation. For example, a consensus value (in green or yellow light) of 0.185 ml/g (52%) was proposed by Barer and Josephs (9), reporting extreme values for the proteins tested of 0.181 and 0.188 ml/g. Similarly, a value of 0.186 ml/g in phosphate buffered saline at 633 nm was proposed by Wen and colleagues (10,11) (which would translate to 0.188 ml/g at 580 nm after a wavelength correction following reference (12)). The ability to use such a consensus value is convenient and very important because the absolute experimental determination of a protein refractive index increment is not only very
cumbersome, but also requires tens of milligrams of highly pure soluble protein for accurate dry weight measure-ments, which would be prohibitive for many or most proteins.
Physically, the refractive index of particles in the visible spectrum of light is a result of the local polarizability of the atoms and chemical groups due to deformation of the electron configuration about nuclei, and therefore insensitive to the long-range structure of macromolecules (6), and long known to be to a good approximation additive toward macro-molecular refractivity (3,13,14). As a consequence, the protein amino acid composition represents the major deter-minant for the protein refractive index increment, dn/dc
(3). In the 1960s, McMeekin and colleagues (15,16) deter-mined the refractivities of amino acids (Table 1), and proposed protein dn/dc values to be estimated from their amino acid composition. This approach compared very well with experimental protein dn/dc data (7,15). For the proteins tested at the time, this reaffirmed the conclusion that proteindn/dcvalues fall within a narrow range of values (within 0.18–0.19 ml/g), such that, in the absence of sequence data or sufficient material fordn/dcdetermination, a consensus value should yield a good approximation to within 2–3% (7).
Unfortunately, the quality of this consensus value approx-imation has not been entirely clear. A recent compilation of experimentally measured dn/dc values (17) shows values largely consistent with this view. However, the literature also contains experimental values ranging from at least 0.168 ml/g forb-lactoglobulin A (18) (in phosphate buff-ered saline after wavelength correction) to 0.203 ml/g for bovine g-crystallin (19) (in phosphate buffer at pH 7.0). Furthermore, because the number of experimentally
Submitted January 26, 2011, and accepted for publication March 14, 2011. *Correspondence:schuckp@mail.nih.gov
Editor: George I. Makhatadze.
measured values for unmodified proteins is quite limited, it is questionable whether they are representative for the entire set of human proteins, in particular, when considering that the molar residue refraction values of amino acids span more than a fourfold range (Table 1). This topic is of some importance because errors may be further amplified; for example, due to the square dependence of the intensity of scattered light on dn/dc (4), and a much larger error amplification could potentially occur in methods that use multisignal approaches, for example, to calculate the extent of protein derivatization (10,20), the degree of detergent-binding (21), or the stoichiometry of protein complexes (22,23).
While the knowledge of protein amino acid sequences was extremely sparse in the 1960s, this is usually not a limi-tation anymore for contemporary studies. Strengthening the strategy of a compositional prediction are modern ab initio computations of the mean polarizabilities of amino acids, which were found to be in good agreement with the tabu-lated data of McMeekin and colleagues (24–26). Thus, wheredn/dc cannot be experimentally measured for prac-tical reasons, it might be valuable to obtain an estimate from the compositional prediction rather than using an average value for all proteins. For the protein partial-specific volumes, quite analogous compositional predictions are highly useful and a current practice in the field of AUC (27–30)—with all their caveats and limitations (31,32). Accordingly, for this work we have embedded a dn/dc
calculator function into the software SEDFIT (33).
Furthermore, the modern availability of large-scale pro-tein sequence data bases allows us to reexamine more thor-oughly than previously possible the question of how much the proteindn/dcvalue can possibly deviate from the stan-dard expectation. To this end, in the current work we have embarked on using the composition-based prediction of
dn/dc in a bioinformatics approach to the set of predicted proteins from the genome of humans and other species, with the aim to determine the complete distribution of
dn/dc values. Finally, we have experimentally probed the range of predicteddn/dc values with synthetic peptides of high and lowdn/dc.
MATERIALS AND METHODS
Prediction of proteindn/dcbased on amino acid composition
The prediction of the protein refractive index increment follows the method outlined by McMeekin and colleagues (15,16). In brief, we can write the refraction per gramRPof the protein as the weight average of the
contribu-tions from the individual amino acidsRa(enumerated with the indexa):
Rp ¼ P a RaMa P a Ma ; (1)
where Ma is the residue molecular mass. Similarly, the protein partial
specific volume,vp, may be estimated based on the amino acid composition as the weight average
vp ¼ P a vaMa P a Ma ; (2)
withvadenoting the residue partial specific volume (27,34). Using the Lor-entz-Lorenz formulaR¼vðn21Þ=ðn2þ2Þ, the refractive index of the protein is np ¼ ffiffiffiffiffiffiffiffiffiffiffiffiffiffiffiffiffi 2Rpþvp vpRp s : (3)
Based on the Wiener equation for dilute solutions (35) (Eq. 17 in reference (36)), the refractive index increment then follows as
dn dc ¼ 3 2vpn0 n2pn20 n2pþ2n20; (4) with solvent refractive indexn0.
The wavelength dependence of several proteins has been examined by Perlmann and Longsworth (12). It was found to follow a Cauchy relation, and the formula
dn dc l ¼ dn dc 578nm 0:940þ20;000nm2 l2 (5) was proposed for the approximate wavelength correction (with the wave-length lmeasured in nm). By the same authors, a small temperature dependence was measured, which we can approximately describe by
TABLE 1 Refractive index properties of amino acids
Amino acid Molar residue refractivity*(cm3) v(ml/g)y dn/dc(ml/g)z Arg 39.47 0.70 0.206 His 34.62 0.67 0.219 Lys 34.10 0.82 0.181 Asp 26.06 0.60 0.197 Glu 30.07 0.66 0.183 Ser 19.16 0.63 0.170 Thr 23.82 0.70 0.172 Asn 26.09 0.62 0.192 Gln 30.37 0.67 0.186 Cys 48.58 0.63 0.206 Gly 12.81 0.64 0.175 Pro 23.74 0.76 0.165 Ala 17.15 0.74 0.167 Ile 31.87 0.90 0.179 Leu 31.59 0.90 0.173 Met 34.45 0.75 0.204 Phe 42.21 0.77 0.244 Trp 55.24 0.74 0.277 Tyr 44.34 0.71 0.240 Val 26.73 0.86 0.172
*From McMeekin et al. (16) (measured experimentally as molar refraction of amino acid from which residue molar refraction was calculated).
yFrom Cohn et al. (34).
zPredicted at 589 nm for hypothetical polypeptide in water with 150 mM
a factor (1þ(25-t)0.0025/30C), withtdenoting the temperature inC, in the range approximately between 10 and 25C. Further corrections could be applied, in principle, for contributions from charge, preferential solva-tion, and known posttranslational modifications (5,10,12,37–39).
We implemented in the software SEDFIT version>12.2 (33) the predic-tion ofdn/dcfrom a user-supplied amino acid sequence in single letter format, with wavelength and temperature corrections, using the tabulated experimental values for the amino acid refraction per gram from McMeekin and colleagues (16) for sodium light at a wavelength of 589.3 nm and a temperature of 25C (Table 1), in combination with the tables for the amino acid partial-specific volumes determined by Cohn and Edsall (34). Unless otherwise mentioned in the following, we assume a reference solvent refractive index n0 of 1.3340, corresponding to water at 25C with
150 mM sodium chloride. For convenience, also implemented are the approximate corrections for temperature and wavelength dependence, the transformation of dn/dc into a fringe increment for interference optical AUC, and the compositional prediction of the protein extinction properties (40).
Experimental determination ofdn/dc and dry weight measurement
The peptides were purchased from the Keck Biotechnology Resource Labo-ratory (New Haven, CT). The dry weight concentration was determined with modifications of the method outlined by Kupke and Dorrier (41). Stocks of both peptides and a control solution consisting of 5 mM NaCl were prepared by exhaustive dialysis against 5 mM NaCl. A gravimetrically recorded quantity (~3 ml) of filtered stocks, control solution, and dialysate were transferred (in triplicate) into preweighed pyrex weighing bottles. These samples, as well as three empty preweighed bottles, were placed under vacuum (at a pressure of 90 mbar) overnight at 45C, with caps un-affixed. For the next 3.5 days, the temperature was raised to 105C while remaining under vacuum. Following the drying session, the samples were placed within an evacuated pyrex desiccator (containing calcium sulfate as a desiccant) at room temperature. The mass of all bottles was measured using an XP-26 microbalance (Mettler Toledo, Columbus, OH). To this end, the apparent mass was recorded in 1 min intervals up to 15 min, and a second degree polynomial fit was used to determine by extrapolation the mass at a time immediately following breakage of the vacuum seal on the desiccators. The mass values obtained were corrected for atmo-spheric buoyancy due to small temporal variations in local temperature, humidity, and barometric pressure. The bottles were subjected to three more rounds of overnight incubation at 105C under vacuum, overnight incubation in desiccator, and mass measurements to ensure no further loss of water. For dialysate and control solutions, the wt% of NaCl was determined from the quotient of water mass evaporated to mass of material remaining dried in the bottle. For the peptide samples, the mass of protein was determined as the difference between the total dry mass remaining and the mass of the sodium chloride.
The total solution volume was calculated based on the tabulated density of the 5 mM NaCl solution at 20C, corrected for the volume occupied by the peptide (predicted using the partial-specific volume based on amino acid composition). Peptide concentrations were then determined from quotient of peptide dry weight and total solution volume. The concentra-tions were (5.40050.007) mg/ml and (3.82850.007) mg/ml for both peptides, respectively.
Experimentaldn/dcmeasurements were conducted from the same dial-ysis stock immediately after start of the dry weight determination. For each peptide, six sample solutions were prepared, with 10%, 20%, 40%, 60%, 80%, and 100% concentration of the stock. The refractive index of the solutions were determined with an Optilab ReX (Wyatt Technology, Santa Barbara, CA), at a wavelength of 690 nm. The protein refractive index increment was determined from the slope of the linear relationship between refractive index and concentration. The Cauchy wavelength corrections were applied (12).
RESULTS
Table 1 shows the molar residue refractivities of the different amino acids from McMeekin and colleagues, and the calculated dn/dc for hypothetical polypeptides from each. Clearly, there are considerable differences in the refractive properties of the amino acids, ranging fromdn/
dcof 0.165 ml/g for proline to 0.277 ml/g for tryptophan. Amino acids with high polarizability and refractive index increment are those containing aromatic rings, sulfur, or double-bonds in the R-group, the highest ones being trypto-phan, phenylalanine, tyrosine, histidine, cysteine, arginine, and methionine (Table 1).
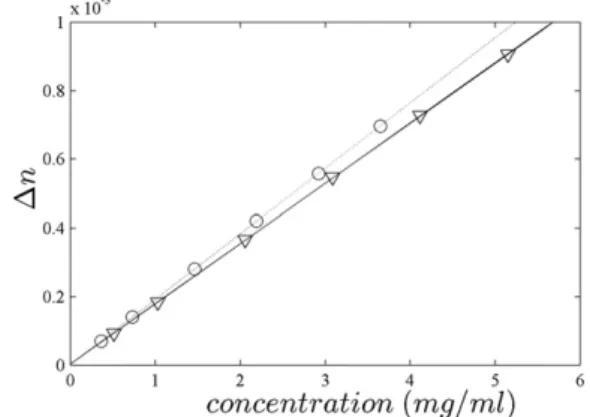
The compositional approach for predicting protein refrac-tive index increments has been compared in the literature with the values measured for naturally occurring mid-sized proteins, where difference from the constituent amino acids can be expected to have averaged out. In a different strategy, we aimed to experimentally demonstrate the sequence dependence of dn/dc and the range of possible values by constructing two short peptides that would be predicted to exhibit very high and very low values, respectively. To this end, a peptide A was created by concatenating two repeats of the solubility tag PEEASVTSTEETLTPAQE AAY, whereas peptide B was created as a concatenation of the tag with HHMHHMHHMHHMHHMHHMHH. (This sequence represented a compromise between a high pre-dicteddn/dc value, the expected solubility, and the possi-bility for synthesis and purification.) The peptides were dialyzed in 5 mM NaCl and their concentration determined by careful dry weight measurement. By sedimentation velocity, both peptides were essentially monomeric with a large frictional ratio, consistent with the circular dichroism spectra containing significant contributions from the spec-tral signature of unordered peptides. Refractive index measurements of each peptide at different dilutions are shown in Fig. 1. The data show excellent linearity, with very different slopes corresponding to dn/dc values of
FIGURE 1 Differential refractometry of peptides A (triangles) and B (circles). Concentrations were measured by dry weight determination. After wavelength correction to 589 nm, the slopes correspond todn/dcvalues of 0.17950.003 ml/g (solid line) and 0.19450.003 ml/g (dashed line).
0.17950.003 ml/g and 0.19450.003 ml/g for peptide A and B, respectively. Within error, the values obtained are identical or very close to the theoretically predicted ones of 0.178 ml/g and 0.199 ml/g, respectively. Likely contrib-uting factors to the small deviation are solvation and errors propagated from the tabulated amino acid partial specific volumes (see Discussion). This close agreement clearly confirms the amino acid composition dependence of the refractive index increment and the large range in principle available for proteins.
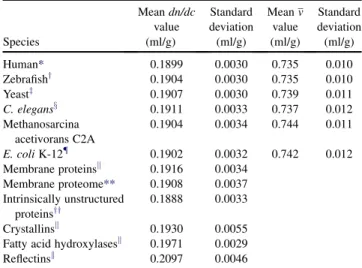
Next, we computed the dn/dcvalues for all 62,378 pre-dicted protein sequences obtained from the University of California Santa Cruz (UCSC) genome browser for the human Feb. 2009 (GRCh37/hg19) assembly (Fig. 2). Inter-estingly, their distribution is very close to Gaussian, as if the refractive index of each residue were an independent random variable. Clearly, the considerable differences of the refractive properties of the amino acids average out for most natural protein sequences to an average of 0.1899 ml/g. The small standard deviation of 0.0030 ml/g confirms the expected similarity of refractive indices among most proteins. Similar distributions were obtained from the genome of different organisms that had mean values differing by less than the standard deviation of the distribu-tions (Table 2). We observed that the predicteddn/dcvalue correlates well with the fraction of residues being Arg, Asp, Cys, His, Met, Phe, Trp, or Tyr, which are those with the highest eight values (Fig. 3). This correlation indicates that high dn/dc values are predominantly determined by the presence of these amino acids. This may be useful for a quick assessment of whether a protein with a given sequence should be expected to have unusually high or low values. (Many low dn/dc residues have refractivities closer to the average, and therefore individually do not contribute as much to the overalldn/dc.)
There are a significant number of proteins with dn/dc
values more than two standard deviations from the mean. For the human proteins in the database, at the low end there are 1388 proteins withdn/dc<0.1838 ml/g, the lowest one with 0.173 ml/g; and at the high end there are 1444 proteins withdn/dc>0.1976 ml/g, the highest one being a keratin-associated protein with 0.215 ml/g. Prominent examples of more extreme values include titin, with a predicted dn/dc
0.177 ml/g, and g-crystallins with values in excess of 0.199 ml/g. Furthermore, the shape of thedn/dcdistribution depends significantly on the protein size (Fig. 4). For small proteins with molecular mass below 10 kDa the standard deviation of the distribution is 0.0053 ml/g, more than twice
FIGURE 2 Histogram of calculateddn/dcvalues for the 62,378 predicted proteins from the UCSC human genome browser for the human Feb. 2009 (GRCh37/hg19) assembly. The best-fit Gaussian is indicated as a black solid line, with mean of 0.1899 ml/g and standard deviation of 0.0030 ml/g.
TABLE 2 Distributions of refractive index increments for different organisms and different classes of proteins
Species Meandn/dc value (ml/g) Standard deviation (ml/g) Meanv value (ml/g) Standard deviation (ml/g) Human* 0.1899 0.0030 0.735 0.010 Zebrafishy 0.1904 0.0030 0.735 0.010 Yeastz 0.1907 0.0030 0.739 0.011 C. elegansx 0.1911 0.0033 0.737 0.012 Methanosarcina acetivorans C2A 0.1904 0.0034 0.744 0.011 E. coliK-12{ 0.1902 0.0032 0.742 0.012 Membrane proteinsk 0.1916 0.0034 Membrane proteome** 0.1908 0.0037 Intrinsically unstructured proteinsyy 0.1888 0.0033 Crystallinsk 0.1930 0.0055 Fatty acid hydroxylasesk 0.1971 0.0029 Reflectinsk 0.2097 0.0046 *Assembly Feb 2009 (GRCh37/hg19).
yDec 2008 (Zv8/danRer6). zJune 2008 (SGD/scaCer2). xMay 2008 (WS190/ce6).
{Protein sequences available in NCBI forE. coliK-12. kNCBI search results with this key word.
**Alme´n et al. (48).
yyDunker et al. (49).
FIGURE 3 Two-dimensional histogram of proteins fromFig. 2and their dn/dcvalue as a function of the fraction of amino acid residues being either Arg, Asp, Cys, His, Met, Phe, Trp, or Tyr (this fraction being termed high dn/dcaa index in the axis label).
the number of 0.0025 ml/g obtained for large proteins with molecular mass in excess of 100 kDa. This suggests that shorter sequences are not averaging out as much the differ-ences in the residue refractivities.
In addition to the molar refractivity, the molecular volume is an important quantity determining the refractive index increment. Therefore, we also determined the distri-bution of predicted protein partial-specific volumes. To this end, the established approach of Eq. 2 was applied across all predicted human proteins. The distribution obtained was close to Gaussian, with a mean of 0.735 ml/g and standard deviation of 0.010 ml/g. This is within error consistent with the consensus average value of 0.724 (50.024) ml/g calculated on the basis of 141 proteins by Attri and Minton (42). Fig. 5 shows a two-dimensional histogram ofdn/dcand the partial-specific volume of each protein, suggesting the absence of a cross correlation between dn/dc and the partial-specific volume. (Potential confusion on this topic could arise from work by Scholte on the relationship between density increments and refrac-tive increments of polymers (43); however, this work is con-cerned with the compounds of given refractive index. InEq. 4, the protein partial-specific volume anddn/dcare indeed
closely related for the givennP. However,nPitself is
deter-mined by the particle refractivity and partial-specific volume (Eq. 3), which are both amino acid composition-dependent for proteins and properties incomposition-dependent of each other (Eqs. 1 and 2).Table 1, for example, shows that argi-nine and threoargi-nine have the same residue partial-specific volume, but the latter has only half the refractivity. This can be understood by considering that the molecular polar-izability depends on how strong electrons are localized in the outer shells of its atoms and chemical bonds, not neces-sarily related to the molecular volume.)
DISCUSSION
In this work, we have reappraised the compositional predic-tion of the refractive index increment of proteins. Clearly, though very useful, the compositional estimate in the current form is imperfect. For example, it does not account for contributions from preferential interactions with solvent components (37,38), such as charge effects and ion binding (12), which can lead to different experimentaldn/dcvalues at different pH and buffer conditions and for folded or unfolded proteins. Other factors that are not captured are the contributions of prosthetic groups and chemical modifi-cations, although corrections for glycosylation (like other conjugation) should be possible as a weighted average of predicted amino acid and carbodydrate component (20).
These limitations should be very similar to those of the compositional prediction of the partial-specific volume, which is widely applied in the fields of small angle scat-tering and AUC for protein samples that do not lend them-selves to dialysis and densimetry. As predicted by the Lorentz-Lorenz formula (Eq. 2), errors in the protein partial-specific volume will always also propagate into errors ofdn/dc, and the tabulated amino acid partial-specific volumes probably represent the largest source of possible systematic error for the computation of a proteindn/dc. In fact, because the residue refractivities are known with great confidence experimentally and computationally from first principles, the ability to predict correct refractive indices
FIGURE 4 Histogram ofdn/dcvalues from known human proteins with molecular mass below 10 kDa (top) and above 100 kDa (bottom), respec-tively. The solid line is the best-fit Gaussian, with a mean of 0.1902 ml/g and standard deviation of 0.0053 ml/g for small proteins, and a mean of 0.1888 ml/g and a standard deviation of 0.0025 ml/g for the large proteins.
FIGURE 5 Two-dimensional histogram of the human proteins from
is an indirect method to verify the tabulated protein partial-specific volumes. In this regard, we found the data tables by Cohn and Edsall (34) clearly superior to those from Zamyat-nin (44), consistent with the observation of Durchschlag and Zipper (45) and Perkins (28).
Despite these limitations and potential sources of system-atic error, as the experience from the widespread use of compositional partial specific volumes in the fields of small angle scattering and AUC shows, the amino acid composi-tion will still be the dominant factor in many practical studies where proteins are not extremely charged, studied in simple buffers without osmolytes. Because sequences of the proteins under study are usually easily available, re-placing the prediction from a postulated consensus value with a compositional prediction is easily possible and should present a better approximation.
Applying this approach to the entire space of predicted human proteins has shed new light on the idea of consensus
dn/dc values. Although these are computed rather than experimental values, this improves on the surprisingly thin data basis of only a few dozen proteins, at best, on which the historic studies proposing the constancy of protein refractive indices were based (7,9). Of importance, the width of the calculated distribution is qualitatively consis-tent with some of the previous estimates. The large differ-ences in amino acid refractivity usually average out, in particular, for large proteins.
On the other hand, thedn/dc distributions obtained also show that this averaging of amino acid refractivity is less effective for small proteins <10 kDa. It is certainly not negligible that we found close to 3000 human proteins that differ from the mean dn/dc of the distribution by more than two standard deviations. Furthermore, the span of dn/dc values of (predicted) human proteins ranging from 0.173 ml/g to 0.215 ml/g is much larger than previ-ously thought (9). These aspects suggest caution against in-discriminately using a consensus dn/dc value that could potentially involve a maximum error of up to ~10%.
An illustration for possible outliers offers the distribution obtained from a search of the National Center for Biotech-nology Information (NCBI) for fatty acid hydroxylases (Fig. 6,top). In these enzymes, the high refractive index increment (0.197150.0029 ml/g) arises from the consis-tently higher than average content of aromatic amino acids, some of them possibly aiding in substrate binding (e.g., in CYP120A1 (46)). However, generally it is not straightfor-ward to identify entire protein families that would have consistently and significantly different dn/dc, because examples for amino acids with both high and low dn/dc
can be found among all subsets that have either basic, acidic, charged, or hydrophobic properties. For example, although clusters of aromatic amino acids are a common motif of protein-membrane interactions (47), we have not observed significant deviations in thedn/dcdistribution of membrane proteins from that of most other proteins (0.1916 5
0.0034 ml/g for the 6717 sequences in the human membrane proteome (48) and 0.19085 0.0037 ml/g for all 382,577 results searching NCBI for membrane protein (interestingly, though, a significantly higher average partial-specific volume of 0.753 ml/g than the average for all human pro-teins of 0.735 ml/g was calculated). Likewise, intrinsically unstructured proteins (49) do not seem to systematically deviate very much from the average dn/dc (0.1888 5 0.0033 ml/g). Conspicuous is the observation of a much broaderdn/dc distribution of proteins classified as crystal-lins (0.1930 5 0.0055 ml/g), with many high dn/dc
members and values up to ~10% above average (Fig. 6,
bottom). Extremely high values are also found in the proteins termed reflectins recently discovered in squid tissues (50).
Whether or not the distribution ofdn/dcvalues reported here is narrow enough to be considered consistent with uniform dn/dcvalues of proteins will certainly depend on the specific application and the level of accuracy needed. Often in biophysical studies characterizing protein interac-tions, the protein refractive index increment is needed solely
FIGURE 6 (Top panel) Histogram of the computeddn/dcvalues of all 6306 proteins obtained searching the NCBI protein sequence database for fatty acid hydroxylase. The solid line is the best-fit Gaussian, with a mean of 0.1971 ml/g and standard deviation of 0.0029 ml/g. As a visual reference, the Gaussian distribution from the analysis of all known and pre-dicted human proteins is shown as a dotted line. (Bottom panel) Histogram of the computeddn/dcvalues of the 1514 proteins in NCBI classified as crystallins.
to measure protein concentration, or in biosensing a surface layer thickness. Small errors should usually be tolerable, considering that binding isotherms typically result in statis-tical errors of the equilibrium binding constants values far greater than a few percent. However, error amplification can occur in the measurement of molecular mass from light scattering, to the extent that the incorrect assumption of a consensus value for one of the proteins in the tail of the distribution might make the discrimination between higher oligomers ambiguous. Error amplification in molecular mass determined by light scattering will be avoided if the protein concentration is measured refractometrically (51,52); nevertheless, accurate knowledge of the dn/dc
parameter was found to be the limiting factor in the accu-racy of peptide molecular mass determination by size-exclu-sion chromatography with multiangle laser light scattering (52). Errors indn/dcwould translate into even larger relative errors for some multisignal approaches, for example, where the excess refractive index signal is interpreted in terms of ligand binding, detergent binding, or protein modification. More accuracy in dn/dc could potentially be a significant improvement.
The availability of accurate protein refractive indices is also crucial for understanding the biophysics of eyes. For example,dn/dcenters as a key parameter in models for light transmission and scattering in the cornea (53–55). Similarly, lens protein concentrations are often estimated from measured lens refractive indices on the basis of assumed crystallin dn/dc values (56). In fact, crystallin concentra-tions in the lens are among the highest of any tissue, in some species reaching up to 500–1000 mg/ml (57). The thermodynamic phase behavior of such highly concentrated protein solutions close to the highest possible packing density is still an active area of research and very important for understanding the formation of cataract (58,59). How-ever, it is clear that the strong nonideality under such crowded conditions will create highly nonlinear concentra-tion dependence of thermodynamic parameters, such as chemical activity and osmotic pressure. Consequently, the accurate measurement of lenticular concentrations will be critical to understand actual intracellular conditions.
In this context, Pierscionek and colleagues (19) have concluded from their study of eye lens crystallins that the paradigm of constancy of refractive index increments is false and reported measurement of lens crystallin dn/ dcresulting in values of 0.190 ml/g for bovinea-crystallin and 0.203 ml/g for bovine g-crystallin. This correlates with the predominant spatial location of these crystallin species in the lens, as well as the well-known refractive index gradient from the cortex to the nucleus the lens (19,60,61). Recently, Kappe´ and co-workers (62) have similarly speculated that a high dn/dc value of g -crystal-lins may be a result of sulfur-containing residues (e.g., amounting to 21.2% in lip shark gM1-crystallin) and be functionally relevant. To study the evolution of crystallins
from this perspective, Kappe´ and co-workers (62) proposed the measurement of refractive index increments of crystallins from different clades. Although such experi-ments seem to pose insurmountable practical difficulties, the sequence-based computational approach can accom-plish this task. In a forthcoming communication, we show by systematic sequence analysis of crystallins of different members of the bg-crystallin family that lens (but not nonlens) g-crystallins have indeed specifically evolved toward an elevated refractive index increment (H. Zhao, P. H. Brown, M. T. Magone, and P. Schuck, unpublished). Thus, this method represents what we believe to be a useful new bioinformatics tool for the prediction of potential protein function based on amino acid sequences from proteomic data bases.
We thank Dr. Medha Bhagwat and Dr. Elliott Margulies for their help with the NCBI databases, Dr. David Dong for help with computer programming, and Dr. Nathan Coussens for discussions. This work was supported by the Intramural Research Program of the National Institute of Biomedical Imaging and Bioengineering, National Institutes of Health.
REFERENCES
1. Reiss, E. 1903. Eine neue methode der quantitativen eiweissbestim-mung.Arch exp Path Pharmak.51:18–29.
2. Robertson, T. B. 1912. On the refractive indices of solutions of certain proteins.J. Biol. Chem.11:179–200.
3. Adair, G. S., and M. E. Robinson. 1930. The specific refraction increments of serum-albumin and serum-globulin.Biochem. J. 24: 993–1011.
4. Debye, P. 1947. Molecular-weight determination by light scattering. J. Phys. Colloid Chem.51:18–32.
5. Doty, P., and E. P. Geiduschek. 1953. Optical properties of proteins.In The Proteins. H. Neurath and K. Bailey, editors. Academic Press, New York. 393–460.
6. Tanford, C. 1961. Physical Chemistry of Macromolecules. Wiley, New York.
7. Babul, J., and E. Stellwagen. 1969. Measurement of protein concentra-tion with interferences optics.Anal. Biochem.28:216–221.
8. Ferna´ndez, C., and A. P. Minton. 2009. Static light scattering from concentrated protein solutions II: experimental test of theory for protein mixtures and weakly self-associating proteins.Biophys. J.96: 1992–1998.
9. Barer, R., and R. Josephs. 1954. Refractometry of living cells.Quart J Microcop Sci.95:399–423.
10. Wen, J., T. Arakawa, and J. S. Philo. 1996. Size-exclusion chromatog-raphy with on-line light-scattering, absorbance, and refractive index detectors for studying proteins and their interactions.Anal. Biochem. 240:155–166.
11. Wen, J., and T. Arakawa. 2000. Refractive index of proteins in aqueous sodium chloride.Anal. Biochem.280:327–329.
12. Perlmann, G. E., and L. G. Longsworth. 1948. The specific refractive increment of some purified proteins. J. Am. Chem. Soc.70:2719– 2724.
13. LeFe`vre, R. J. W. 1965. Molecular refractivity and polarizability.Adv. Phys. Org. Chem.3:1–90.
14. Born, M., and E. Wolf. 1999. Principles of Optics. University Press, Cambridge.
15. McMeekin, T. L., M. L. Groves, and N. J. Hipp. 1964. Refractive indices of amino acids, proteins, and related substances.InAmino
Acids and Serum Proteins. J. Stekol., editor. American Chemical Society, Washington DC.
16. McMeekin, T. L., M. Wilensky, and M. L. Groves. 1962. Refractive indices of proteins in relation to amino acid composition and specific volume.Biochem. Biophys. Res. Commun.7:151–156.
17. Theisen, A., C. Johann,., S. E. Harding. 2000. Refractive Increment Data-Book for Polymer and Biomolecular Scientists. Nottingham University Press, Nottingham, UK.
18. Stuting, H. H., and I. S. Krull. 1990. Complete on-line determination of biopolymer molecular weight via high-performance liquid chromatog-raphy coupled to low-angle laser light scattering, ultraviolet, and differential refractive index detection.Anal. Chem.62:2107–2114. 19. Pierscionek, B., G. Smith, and R. C. Augusteyn. 1987. The refractive
increments of bovine alpha-, beta-, and gamma-crystallins. Vision Res.27:1539–1541.
20. Arakawa, T., and J. Wen. 2001. Determination of carbohydrate contents from excess light scattering.Anal. Biochem.299:158–161.
21. le Maire, M., B. Arnou,., J. V. Møller. 2008. Gel chromatography and analytical ultracentrifugation to determine the extent of detergent binding and aggregation, and Stokes radius of membrane proteins using sarcoplasmic reticulum Ca2þ-ATPase as an example. Nat. Protoc. 3:1782–1795.
22. Balbo, A., K. H. Minor,., P. Schuck. 2005. Studying multiprotein complexes by multisignal sedimentation velocity analytical ultracentri-fugation.Proc. Natl. Acad. Sci. USA.102:81–86.
23. Padrick, S. B., R. K. Deka,., C. A. Brautigam. 2010. Determination of protein complex stoichiometry through multisignal sedimentation velocity experiments.Anal. Biochem.407:89–103.
24. Millefiori, S., A. Alparone,., A. Vanella. 2008. Electronic and vibra-tional polarizabilities of the twenty naturally occurring amino acids. Biophys. Chem.132:139–147.
25. Kassimi, N. E.-B., and A. J. Thakkar. 2009. A simple additive model for polarizabilities: application to amino acids. Chem. Phys. Lett. 472:232–236.
26. Hansen, T., L. Jensen,., K. V. Mikkelson. 2005. Frequency-depen-dent polarizabilities of amino acids as calculated by an electrostatic interaction model.J. Chem. Theory Comput.1:626–633.
27. Durchschlag, H. 1986. Specific volumes of biological macromolecules and some other molecules of biological interest.InThermodynamic Data for Biochemistry and Biotechnology. H.-J. Hinz, editor. Springer, Berlin. 45–128.
28. Perkins, S. J. 1986. Protein volumes and hydration effects. The calcu-lations of partial specific volumes, neutron scattering matchpoints and 280-nm absorption coefficients for proteins and glycoproteins from amino acid sequences.Eur. J. Biochem.157:169–180.
29. Laue, T. M., B. D. Shah,., S. L. Pelletier. 1992. Computer-aided interpretation of analytical sedimentation data for proteins.In Analyt-ical Ultracentrifugation in Biochemistry and Polymer Science. S. E. Harding, A. J. Rowe, and J. C. Horton, editors. The Royal Society of Chemistry, Cambridge. 90–125.
30. Schuck, P., A. Balbo,., H. Zhao. 2010. Analytical ultracentrifugation. InEncyclopedia of Analytical Chemistry. R. A. Meyers, editor. John Wiley, Chichester.
31. Eisenberg, H. 2003. Modern analytical ultracentrifugation in protein science: look forward, not back.Protein Sci.12:2647–2649, discussion 2649–2650.
32. Lebowitz, J., M. S. Lewis, and P. Schuck. 2003. Back to the future: a rebuttal to Henryk Eisenberg.Protein Sci.12:2649–2650. 33. Schuck, P. 2010. https://sedfitsedphat.nibib.nih.gov/software/default.
aspx.
34. Cohn, E. J., and J. T. Edsall. 1943. Density and apparent specific volume of proteins. In Proteins, Amino Acids and Peptides. E. J. Cohn and J. T. Edsall, editors. Van Nostrand-Reinhold, Princeton, NJ. 370–381.
35. Wiener, O. 1910. Zur Theorie der Refraktionskonstanten.Leipzig Ber. 62:256.
36. Heller, W. 1965. Remarks on refractive index mixture rules.J. Phys. Chem.69:1123–1129.
37. Pittz, E. P., J. C. Lee,., S. N. Timasheff. 1973. Light scattering and differential refractometry.Methods Enzymol.27:209–256.
38. Eisenberg, H. 1976. Biological Macromolecules and Polyelectrolytes in Solution. Clarendon Press, Oxford.
39. Eisenberg, H. 1992. Halophilic malate dehydrogenase—a case history of biophysical investigations: ultracentrifugation, light-, x-ray- and neutron scattering.Biochem. Soc. Symp.58:113–125.
40. Pace, C. N., F. Vajdos, ., T. Gray. 1995. How to measure and predict the molar absorption coefficient of a protein. Protein Sci. 4:2411–2423.
41. Kupke, D. W., and T. E. Dorrier. 1978. Protein concentration measure-ments: the dry weight.Methods Enzymol.48:155–162.
42. Attri, A. K., and A. P. Minton. 1983. An automated method for determination of the molecular weight of macromolecules via sedimen-tation equilibrium in a preparative ultracentrifuge. Anal. Biochem. 133:142–152.
43. Scholte, T. G. 1972. Relation between the refractive index increment and the density increment of binary mixtures: application to the deter-mination of the partial specific volumes of polymers in solution. J. Polym. Sci. A.10:519–526.
44. Zamyatnin, A. A. 1984. Amino acid, peptide, and protein volume in solution.Annu. Rev. Biophys. Bioeng.13:145–165.
45. Durchschlag, H., and P. Zipper. 1997. Calculation of partial specific volumes and other volumetic properties of small molecules and poly-mers.J. Appl. Cryst.30:803–807.
46. Ku¨hnel, K., N. Ke,., I. Schlichting. 2008. Crystal structures of substrate-free and retinoic acid-bound cyanobacterial cytochrome P450 CYP120A1.Biochemistry.47:6552–6559.
47. Zhang, W., T. Sato, and S. O. Smith. 2006. NMR spectroscopy of basic/ aromatic amino acid clusters in membrane proteins.Prog. Nucl. Magn. Reson. Spectrosc.48:183–199.
48. Alme´n, M. S., K. J. Nordstro¨m,., H. B. Schio¨th. 2009. Mapping the human membrane proteome: a majority of the human membrane proteins can be classified according to function and evolutionary origin. BMC Biol.7:50.
49. Dunker, K., Z. Obradovic,., P. Tompa. 2010.http://www.disprot.org/. 50. Crookes, W. J., L. L. Ding,., M. J. McFall-Ngai. 2004. Reflectins: the
unusual proteins of squid reflective tissues.Science.303:235–238. 51. Kendrick, B. S., B. A. Kerwin,., J. S. Philo. 2001. Online
size-exclu-sion high-performance liquid chromatography light scattering and differential refractometry methods to determine degree of polymer conjugation to proteins and protein-protein or protein-ligand associa-tion states.Anal. Biochem.299:136–146.
52. Oliva, A., J. B. Farina, and M. Llabres. 2004. Measurement of uncer-tainty in peptide molecular weight determination using size-exclusion chromatography with multi-angle laser light-scattering detection and matrix-assisted laser desorption/ionization time-of-flight mass spec-trometry.Anal. Chimica. Acta.512:103–110.
53. Leonard, D. W., and K. M. Meek. 1997. Refractive indices of the collagen fibrils and extrafibrillar material of the corneal stroma. Biophys. J.72:1382–1387.
54. Meek, K. M., S. Dennis, and S. Khan. 2003. Changes in the refractive index of the stroma and its extrafibrillar matrix when the cornea swells. Biophys. J.85:2205–2212.
55. Doutch, J., A. J. Quantock,., K. M. Meek. 2008. Light transmission in the human cornea as a function of position across the ocular surface: theoretical and experimental aspects.Biophys. J.95:5092–5099. 56. Bloemendal, H., W. de Jong,., A. Tardieu. 2004. Ageing and vision:
structure, stability and function of lens crystallins.Prog. Biophys. Mol. Biol.86:407–485.
57. Jaenicke, R., and C. Slingsby. 2001. Lens crystallins and their micro-bial homologs: structure, stability, and function.Crit. Rev. Biochem. Mol. Biol.36:435–499.
58. McManus, J. J., A. Lomakin,., G. B. Benedek. 2007. Altered phase diagram due to a single point mutation in human gammaD-crystallin. Proc. Natl. Acad. Sci. USA.104:16856–16861.
59. Stradner, A., G. Foffi,., P. Schurtenberger. 2007. New insight into cataract formation: enhanced stability through mutual attraction. Phys. Rev. Lett.99:198103.
60. Campbell, M. C. 1984. Measurement of refractive index in an intact crystalline lens.Vision Res.24:409–415.
61. Ve´re´tout, F., and A. Tardieu. 1989. The protein concentration gradient within eye lens might originate from constant osmotic pressure coupled to differential interactive properties of crystallins. Eur. Biophys. J. 17:61–68.
62. Kappe´, G., A. G. Purkiss,., N. H. Lubsen. 2010. Explosive expansion of betagamma-crystallin genes in the ancestral vertebrate.J. Mol. Evol. 71:219–230.