Sociology & Criminal Justice Theses &
Dissertations Sociology & Criminal Justice
Spring 2019
Effects of Prison Program Participation on
Recidivism Outcomes
Jordan Jakobs Old Dominion University
Follow this and additional works at:https://digitalcommons.odu.edu/ sociology_criminaljustice_etds
Part of theCriminology Commons
This Thesis is brought to you for free and open access by the Sociology & Criminal Justice at ODU Digital Commons. It has been accepted for inclusion in Sociology & Criminal Justice Theses & Dissertations by an authorized administrator of ODU Digital Commons. For more information, please contactdigitalcommons@odu.edu.
Recommended Citation
Jakobs, Jordan. "Effects of Prison Program Participation on Recidivism Outcomes" (2019). Master of Arts (MA), thesis, Sociology/ Criminal Justice, Old Dominion University, DOI: 10.25777/g8w4-e637
EFFECTS OF PRISON PROGRAM PARTICIPATION ON RECIDIVISM OUTCOMES by
Jordan Jakobs
B.A. May 2017, West Virginia University
A Thesis Submitted to the Faculty of
Old Dominion University in Partial Fulfillment of the Requirements of the Degree of
MASTER OF ARTS APPLIED SOCIOLOGY OLD DOMINION UNIVERSITY
May 2019
Approved by:
Tracy Sohoni (Director) Randy Gainey (Member) Sylwia Piatkowska (Member)
ABSTRACT
EFFECTS OF PRISON PROGRAM PARTICIPATION ON RECIDIVISM OUTCOMES Jordan Jakobs
Old Dominion University, 2019 Director: Dr. Tracy Sohoni
Although the relationship between prison programs and recidivism has been extensively researched, few studies have examined the role of commitment as apart of social bond theory and its relationship to prison programs and recidivism. Based on a nationwide sample of 9,890
prisoners, the concept of commitment is used as a paradigm to understand whether completion of prison programs increases bonds of commitment to conventional activities thereby reducing the rate of recidivism. The analyses indicate that commitment improves recidivism outcomes for offenders who completed alcohol and drug treatment programs but not for those in vocational and educational programs. These results indicate that future studies of prison programs and re-entry success should examine the role of educational attainment prior to incarceration and how that effects recidivism outcomes. Also, the role of differential association theory and its effects of recidivism outcomes should be taken into consideration.
ACKNOWLEDGEMENTS
I would like to take this time to extend thanks to the people who guided me through these last few years. First, I would like to thank Dr. Ingrid Whitaker for taking a chance and accepting me into this program. I would not be here today if it was not for you. Secondly, I would like to extend much thanks to my committee members, Dr. Tracy Sohoni, Dr. Randy Gainey, and Dr. Sylwia Piatkowska, for helping me through this crazy process. Lastly, I would like to thank every single person that has impacted my life thus far,
To my Mom: I would like to thank you for showing me what you can accomplish with a hard work ethic and fierce independence. My admiration for you is insurmountable.
To my Grandparents: I could never thank you enough for your endless love and support. You are the foundation and voice of reason in this family.
To Uncle Dada: You are an absolute inspiration to me and this family. I love you. To Linze, Rylee, and Lauren: You are the reason I do what I do. Never stop chasing your dreams. I love you so much.
To my Dad and Sherry: Dad, thank you for loving me unconditionally. Sherry, thank you for being the absolute best mother to Rylee and Lauren. You are an amazing woman and I am blessed to be a part of your life.
To Gary: Thank you for showing me how much you can achieve with determination and dedication. I love you.
To Aunt Sue and Uncle Joe: Aunt Sue, thank you for always being steadfast and down to earth. You are my spirit animal and an absolute blessing to me. Uncle Joe, your charismatic nature shines a bright light on the family. We are so blessed.
To Joseph and Caitlin: I am so fortunate to not only call you my cousins, but to also call you my friends. I love you so much.
To Amellia, Caroline, and Lauren: Thank you for being you. I am so lucky to have known you for ten years. You mean more to me than you will ever know. I love you so much.
To Sarah: You taught me so much at West Virginia and I’m so blessed to have known you these last six years. I love you so much. Let’s go Mountaineers!
To Briana, Kyhara, Julie, Prosper, Richard, and Brendan: Thank you for being such good friends. Only you understand what these past two years have meant. You will always hold a special place in my heart.
TABLE OF CONTENTS Page LIST OF TABLES ... vi Chapter I. INTRODUCTION ...1 PURPOSE STATEMENT ...2
II. LITERATURE REVIEW ...3
NEED FOR EDUCATION PROGRAMS ...3
EDUCATIONAL AND VOCATIONAL PROGRAMS ...4
ALCOHOL AND DRUG TREATMENT ...7
SENTENCE LENGTH ...8
EFFECTS OF AGE AND OTHER CHARACTERISTICS ON RECIDIVISM ...10
THEORETICAL FRAMEWORK ...11
SUMMARY AND CRITIQUE OF LITERATURE ...13
HYPOTHESES ...14
III. METHODOLOGY ...15
SIGNIFICANCE OF THE STUDY ...15
RESEARCH QUESTIONS ...15
RESEARCH DESIGN ...16
VARIABLES IN THE STUDY ...18
DATA ANALYSIS ...21 IV. RESULTS ...22 DESCRIPTIVE STATISTICS ...22 BIVARIATE ANALYSIS ...27 BIVARIATE RESULTS ...27 MULTI-VARIATE ANALYSIS ...33 V. CONCLUSION ...36
LIMITATIONS OF THE STUDY ...37
DISCUSSION AND FUTURE RESEARCH ...38
REFERENCES ...40
APPENDIX ...45
LIST OF TABLES
Table Page
1. Variables in the Study ...20 2. Descriptive Statistics of Study Variables ...24
3. Relationship to Drug Treatment Programs and Instance of Rearrest by means of
Chi-Square Test ...25 4. Relationship to Alcohol Treatment Programs and Instance of Rearrest by means of
Chi-Square Test ...25 5. Relationship to Vocational Courses and Instance of Rearrest by means of Chi-Square
Test ...26
6. Relationship to Educational Courses and Instance of Rearrest by means of Chi-Square
Test ...26 7. Multi-Variate Analysis - Logistic Regression – Alcohol Treatment and Instance of
Rearrest ...29 8. Multi-Variate Analysis - Logistic Regression – Drug Treatment and Instance of
Rearrest ...30 9. Multi-Variate Analysis - Logistic Regression – Vocational Courses and Instance of
Rearrest ...31 10. Multi-Variate Analysis - Logistic Regression – Educational Courses and Instance of
CHAPTER I INTRODUCTION
In 2015, John J. Lennon, addressed the issues of prison programs and barriers to reentry by so eloquently stating,
“We need to be prepared to return to the outside world and stay there. But have hope for us when we’re inside, too. We need opportunities to educate ourselves. My mother used to tell me something that obviously took me a long time to figure out: ‘How you think is how you act.’” (Link 2016).
The number of individuals being released from state and federal prisons has outpaced that of admissions for the fourth consecutive year, with over two million people incarcerated, over 9 million rotating through local jails, and roughly five million under some kind of supervision (James 2015; The Burau Justice of Statistics).
From 1980 to 2010 the number of women in prison rose by 646%, with the number of men rising 419% (Clark 2014, Mauer & McClamont, 2013). This fourfold increase has far-reaching consequences, and according to the National Institute of Corrections, over the last 20 years state spending on prisons has grown at a faster rate than nearly any other state budget item, with the cost of incarceration wreaking havoc on state and municipal budgets.
The dramatic increase in the prison population was largely the consequence of policy and sentencing changes that intensified criminal justice sanctions; namely determinant sentences with sentencing guidelines, mandatory minimum sentences, habitual offender laws, and the
elimination of nonobligatory parole (Phelps, 2013). Scholars of mass incarceration point to the 1970’s as a crucial turning point in United States penal history, marked by a swing towards more
punitive policies and a general agreement that “nothing works” when rehabilitating prisoners (Phelps, 2013).
These changes were accompanied by a dramatic deviation in general rationale regarding prisons and crime policies, specifically there has been a decline in the rehabilitative idea that prison should serve as houses of reformation where offenders would be equipped to return to society (Phelps, 2013). In place of reintegration techniques, incapacitation and deterrence have become the overt goals of the criminal justice system, with the focus on treatment cast aside and prisons being place holders for violent individuals who have been judged irredeemable by society (Phelps, 2013).
Purpose Statement
The purpose of this study is to explore the effect, if any, correctional education and vocational training, along with drug treatment and alcohol treatment have on the likelihood of recidivism. To explore this relationship, the theoretical concept of commitment, which is an important construct of social bond theory, will be used to measure levels of participation in prison programs among incarcerated individuals; hypothesizing that full participation and
CHAPTER II LITERATURE REVIEW
This chapter begins with a discussion of themes commonly looked at when addressing factors that significantly impact the likelihood of recidivism. Since there is substantial literature examining the relationship between alcohol treatment, drug treatment, educational programs, and vocational training in relation to recidivism, a brief synopsis of these factors is given. Subsequent to the discussion for the need of educational programs in prisons, is an in-depth review of
literature relating to vocational and educational courses. Next, alcohol and drug treatment programs are examined. Followed by a discussion of other mitigating factors such as sentence length, age, and offense type in relation to recidivism. Later, an overview of the social bond theory and the concept of commitment as the theoretical framework is examined. This section concludes with a summary and critique of the current literature and presentation of the research questions and hypotheses.
Need for Education Programs
“One of the predicates of correctional education is the level of unmet need” (Gaes, 2008). There have been many different attempts to measure the literacy and education levels of inmates compared to community populations (Gaes, 2008). Harlow’s Special Report for the Bureau Justice of Statistics (2003) tracked trends in the prison population from 1991-1997 based on the inmate survey conducted by BJS (Gaes, 2008). The National Center for Education Statistics published two studies, (NCES, 1994; Greenberg, Dunleavy, and Kutner, 2007) that measure the literacy levels of inmates as part of a national evaluation of literacy throughout the United States
(Gaes, 2008). In both of these studies’ literacy was defined as being able to use printed and written information to function in society, reach one’s goals, and develop one’s potential (Gaes, 2008). These studies demonstrate that prisoners are an undereducated class compared to the community and have lower literacy skills to perform everyday tasks illustrating a greater need for certification and post-secondary education in prison systems (Gaes, 2008).
Educational and Vocational Programs
From March 1991 through December 1992, an examination of fourteen thousand released inmates from Texas prisons was conducted with the purpose of comparing participants and nonparticipants in prison education programs on a variety of behavioral outcomes (Adams et al. 1994). The sample included all inmates who were released on parole, mandatory supervision, and expiration of sentence, with “return to prison” being the primary dependent variable (Adams et al. 1994). By matching inmate identification numbers against admission files, a sample of offenders who had returned to prison was gathered and elapsed time was calculated for the recidivists (Adams et al. 1994). The data showed that the number of participation hours in both academic and vocational programs was negatively related to recidivism, but positively related to prison misconduct. However, these findings, may simply reflect the influence of increased time incarcerated; that is, inmates who participated more in prison programs also spent more time incarcerated, and therefore had more opportunity to commit prison infractions (Adams et al. 1994). It is also possible that individuals who participated in prison programs were charged with program related infractions, for example, classroom misbehavior or tardiness (Adams et al. 1994).
In 2008, a paper published by Gaes examined the impact of correctional education programs on post-release outcomes by reviewing summaries of relevant research literature, examining their results, and drawing inferences based on the overall impact. In his review of the relationship between correctional education and recidivism, Gaes discussed numerous meta-analytical studies. One of the studies used meta-analysis to estimate the effect of post-secondary education (PSE) on recidivism (Chappell, 2004). PSE training could include educational,
vocational, undergraduate, academic, graduate, certification, and degree programs (Chappell, 2004). These studies were published from 1990-1999, and were quasi-experimental and correlation studies, with effect size measured as the correlation between PSE and recidivism (Chappell, 2004). The sample weighted effect size was r= -.31, with PSE participant recidivating 22 percent of the time and non-participants recidivating 41 percent of the time (Chappell, 2004).
Additional research supports work release programs and vocational programs have success at reducing rates of recidivism (Duwe, 2014). Milwaukee Safe Streets Prisoner Release Initiative provided inmates with assessments and 6 months of needed services before their release from prison, with a multifaceted approach including vocational skills assessment and training (Cook et al. 2014; Newton et al. 2016). Participants were also given access to alcohol and drug treatment, remedial education, and for lower security offenders, work release was possible (Cook et al. 2014; Newton et al. 2016). The sample included male inmates who were aged 35 and younger, scheduled to be released to the Milwaukee initiative with at least 6 months of supervision, and had a history or violence or gang activity (Cook et al. 2014; Newton et al. 2016). Between January and August of 2009, 236 inmates were randomized to either a control group (n=130), or a program group (n=106), and the results showed that the program group had a higher success rate and a higher median earning than the control group (Cook et al. 2014;
Newton et al. 2016). Furthermore, the program group was more likely to be employed in the third and fourth quarters of the year following release, and by the end of the first year, the program group had lower overall recidivism and rearrest rates (Cook et al. 2014; Newton et al. 2016). By the end of the first year, overall rearrest rates (63% versus 72%) were lower for the program group compared to the control group, and reimprisonment rates after the first year were also lower for the program group (22% versus 26%) (Cook et al. 2014; Newton et al. 2016).
By gaining some kind of certification such as a GED or trade, this signals to potential employers that the offender is capable of completed work (Gaes 2008). This advantage may help to combat the signaling “penalty” following prisoners into the labor market resulting from a stint of imprisonment (Gaes 2008). Harer 1995 argues that prison education encourages prosocial attitudes and instills a disposition antithetical to anti-social norms of prison life. Tyler and Kling (2006) argue that GED participation can affect labor market outcomes either by increasing the human capital, or by a signaling effect if the inmate earns a certificate showing a potential
employer that he/she is more likely to be a better job candidate than those who do not possess the certification. To test these hypotheses, they use two different regression analyses. From a
collection of high school dropouts who were imprisoned, they compared a group of prisoners who earned their GED while imprisoned to those who did not have their high school diploma when they entered prison and participated in the GED program or participated and did not earn their GED (Gaes 2008; Tyler and Kling 2006). The comparison groups were composed so they entered the correctional facility around the same time as the inmates earning the GED certificate (Tyler and Kling 2006). Tyler and Kling used panels of quarterly earnings and four different regression models to analyze the effect of GED certificates on quarterly earnings (2006). The simplest model used linear regression using only an indicator variable for GED completion, with
the more complex models using year-quarter dummies, large sets of covariates, a variable indicating participation in the labor market post-release relative to pre-admission, and fixed effects estimates controlling for time invariant characteristics of the sample (Tyler and Kling 2006). The results indicate that there was very little difference between the fixed effects panel model and the model that used a rich set of covariates (Tyler and Kling 2006). Although there was no effect for whites, minorities benefited from GED completion with a 20 percent increase in quarterly wages (Tyler and Kling 2006). These findings suggest a dependence on racial differences and should be addressed in future research (Tyler and Kling 2006).
In a cost-benefit analysis study, the Aos, Miller, and Drake (2006) report shows that general education and vocational training in correctional facilities produce some of the largest economic benefits for adult programs. Not including the social benefits to crime victims
accumulating from recidivism reductions, the marginal cost of vocational programs is $1,182 per inmate and the marginal savings for the tax payer from lower criminal justice cost is $6,806 (Aos et al. 2006). General education marginal costs for the tax payer was $962 per person and the tax payer savings were $5,306 (Aos et al. 2006). Furthermore, if you add victim savings to the new benefit for vocational training programs the savings totaled $13,738 per prisoner and for general education, $10,699 per prisoner (Aos et al. 2006). Respectively, these are 9 and 7 percent drops in recidivism rates for vocational training and general education programs (Aos et al. 2006).
Alcohol and Drug Treatment
Most studies suggest that the use of drugs and alcohol after incarceration increases the difficulty of reintegration. Visher et al. (2011), reported two-thirds (64 percent) of the
and Visher (2008) reported a high number of individuals who used illegal drugs or became inebriated six months prior to incarceration (8 in 10 respondents).
Amphetamine, heroin, and injection drug use all had a high rate of predicting recidivism, with the risk increasing exponentially by those who reported doing all three (Hakansson & Berglund, 2012). The use of methamphetamine was associated with a 30 percent increase in the chance of recidivism and was a strong predictor of reincarceration (Cartier, Farabee, &
Prendergast, 2006). Shinkfield and Graffam (2009), noted that 1-4 weeks after incarceration there was a significantly higher number of alcoholic drinks consumed than 3-4 months after incarceration, indicating a higher tendency toward binge drinking initially following release from prison than the proceeding months (Shinkfield & Graffam, 2009). Additionally, individuals with substance abuse issues before prison (44% of both men and women) were more likely than individuals without substance abuse problems (18% of men and 16% of women) to report criminal behavior or be reincarcerated within one year of release (Kane & Visher, 2008). Relatively few inmates received substance abuse treatment while in prison, despite having high rates of substance abuse issues before being incarcerated, and men who used illicit drugs before prison were more likely to receive treatment while incarcerated than women (Kane & Visher, 2008).
Sentence Length
An analysis by Gottfredson et al. (1973) examined 104,182 male prisoners in 14 offense categories in the United States who were paroled for the first time between 1965 and 1970 (Gottfredson et al. 1973). The follow up period was one year, with recidivism defined as return to prison (Gottfredson et al. 1973). The median time served ranged from 12.2 months for fraud
offenders to 58.6 months for homicide offenders (Gottfredson et al. 1973). Attempts were made to statistically control for the effects of prior offense, offense type, and age (Gottfredson et al. 1973). The results showed that while on parole, offenders with the longest time served generally had a higher recidivism rate than offenders with the shortest time served (Gottfredson et al. 1973). For all subgroups of property offenders (check offense, auto theft, burglary, fraud, and larceny) who served the longest time had higher recidivism rates than those subgroups who served the shortest time (Gottfredson et al. 1973). However, for drug offenses and armed
robbery, offenders with longer sentences had slightly lower recidivism rates than offenders with shorter sentences (Gottfredson et al. 1973).
In 1976, Beck and Hoffman followed 1,546 adults from federal prisons in the United States for two years after their release. Offenders were categorized according to their “salient factor score” which included prior criminal history, age, education, employment history, and marital status (Beck & Hoffman 1976). The offenders were first grouped by their scores, then further divided according to their time served and the results showed no significant association between time served and recidivism rates (Beck & Hoffman 1976).
Orsagh and Chen (1988) tested the theory that there in an optimal sentence length which minimizes the rate of recidivism. They examined 1,425 offenders released from a North Caroline prison in 1980 and of the total sample, 40 percent were incarcerated for robbery of burglary (Orsagh & Chen 1988). The offenders were followed for two years after release and recidivism was defined as the instance of post-release arrest (Orsagh & Chen 1988). After controlling for possible effects of race, age, marital status, criminal history, and employment, the findings indicated that for robbery offenders, the probability of re-offense increased with the amount of time served (Orsagh & Chen 1988). For the whole sample of offenders that were convicted of
any offenses, the estimated optimum time served was 1.2 years (Orsagh & Chen 1988). When time served was less than 1.2 years, increased length of imprisonment was correlated with a decreased likelihood of post-release arrest (Orsagh & Chen 1988). However, when time served was more than 1.2 years, offenders serving longer sentences had an increased chance of post-release arrest (Orsagh & Chen 1988). Orsagh and Chen (1988), concluded that time served does affect recidivism rates, the direction of offense varies across offense class, and that for some offense classes, recidivism rates will likely be reduced by shortening the period of imprisonment.
Effects of Age and Other Characteristics on Recidivism
The United States Sentencing Commission conducted a study of 25,431 federal offenders that examines the impact of age at release on recidivism (Easley & Hunt 2017). This report examines the aging process on federal offenders and, once age is accounted for, impact of other offender and offense characteristics (Easley & Hunt 2017). Recidivism was measured three ways; rearrest, reconviction, and reincarceration, and had a follow-up period of eight years (Easley & Hunt 2017).
Drug trafficking offenders were usually the youngest group of offenders at the time of release (68% were below the age of 40) (Easley & Hunt 2017). In comparison, 66.5% of
weapons offenders were younger than 40 and 60.3% of robbery offenders were below the age of 40 (Easley & Hunt 2017). Offenders who committed fraud were the oldest age range with 55% being 40 years or older at the time of release (Easley & Hunt 2017).
The largest offender age group in this study were offender who were aged 30 to 34 (18.3% of the total) (Easley & Hunt 2017). The next largest cohorts at the time of release were 25 to 29 years old (16.4%) and 35 to 39 years old (15.3%) (Easley & Hunt 2017). At the time of
release, most White offenders were 40 years or older (51.6%) with 30.2% of Black offenders 40 years old or older (Easley & Hunt 2017). Female offenders were somewhat younger than male offenders at the time of release (Easley & Hunt 2017). Particularly, a larger proportion of female offenders were 30 years old or younger at the time of release (31.2%), compared to 25.8% of male offenders (Easley & Hunt 2017). One of the key findings of this study were that older offenders were substantially less likely to recidivate following release than younger offenders (Easley & Hunt 2017). Of the offenders who were 65 years and older, 13.4% were rearrested compared to 67.6% of offenders who were younger than 21 at the time of release (Easley & Hunt 2017). The pattern was constant across age groupings, and recidivism measured by rearrest, reconviction, and reincarceration declined as age increased (Easley & Hunt 2017).
Theoretical Framework
One common approach to study recidivism is social bond theory. This theory was originally devised by Travis Hirschi and essentially refers to the extent to which an individual is connected with society (Durkin, Wolfe, & Clark 1999). This theory postulates that deviance occurs when the social bond is weak (Durkin et. al. 1999). Four major concepts make up social bond theory: attachment, commitment, involvement, and belief. Hirschi (1969) argued that if individuals are strongly attached to parents, teachers, and peers; committed to a conventional kind of action, involved in conventional activities, and believe in the legitimacy of morals, they are less likely to be criminal (Ozbay & Ozcan 2008). Social bond theory is one of the dominant perspectives on deviant behavior and has been frequently tested and discussed since its
formulation (Durkin et.al. 1999). It has received strong empirical support, and its explanatory value is usually regarded as good or moderate (Durkin et. al. 1999). This study will focus
specifically on the bond of commitment, and how participation and completion of prison programs indicates a person’s commitment to conventional behavior and activities.
Commitment is referred to as the responsibility one feels to certain social expectations such as, work, sports, or school. It also reflects the cost factor involved in engaging in deviant activity (Khron & Massey 1980). It is the investment of time, resources and energy in
conventional activities which represent stakes in conformity (Durkin et. al. 1999). For
individuals returning to society it is assumed that commitment to employment would outweigh the costs of reincarceration. For example, when examining the relationship between commitment and employment to recidivism, Berg and Huebner (2011), found that inmates who maintain employment post-incarceration are less likely to return to prison. This is important when
examining offenders who have participated in prison programs. It can be assumed that the more committed an offender is to a program during incarceration the more committed he or she will be once released from prison. It is also important to note that completion of programs, such as vocational and educational training, can lead to better employment opportunities once an offender is released from prison. The enhancement of educational and vocational skills not only signals to potential employers that they are qualified but could also increase the commitment level of the offender to non-criminal activities that are conventional in nature. Likewise, commitment to alcohol and drug treatment programs could increase the likelihood that an offender will stay clean once they are released. Though there are more complex factors that make up an addiction than just commitment, theoretically speaking, if an offender is committed to completing treatment programs while incarcerated, the prospect of maintaining sobriety upon release is higher.
Social bond theory is important when understanding how weak or broken social bonds can lead to offending behavior of individuals. While all four aspects of social bond theory are important, commitment is the most applicable concept when examining participation rates. For this analysis, commitment is used as a foundation to understand whether participation and completion of prison rehabilitation programs increase bonds of commitment and thus reduce rates of recidivism.
Summary and Critique of Literature
Centered around the review in the previous section, many themes emerged that discussed the difficult challenges contributing to high rates of recidivism among ex-inmates following release. Available research literature examined the need for prison programs and how prison programs benefit the economy and improve human capital. Alcohol and drug treatment programs were also examined in relation to recidivism stating that individuals who engage in drug or alcohol post-release are more likely to recidivate than those who do not. This means it is
important for offenders who are addicts to complete treatment programs while incarcerated. This chapter also examined sentence length, age, and other factors such as sample offense and how these factors influence recidivism. Lastly, the chapter closed with a discussion of social bond theory, specifically commitment, and how it plays an important role in goal attainment. This chapter provided an overview of current literature as it relates to factors that contribute to high rates of recidivism, specifically prison programs, as well as provided an in depth look at the theoretical framework. The next chapter will showcase the methodology used for the current study.
Hypotheses
1. Those who have higher levels of participation in alcohol treatment programs are less likely to recidivate upon release – as program participation increases so does the chance of successful reentry
2. Those who have higher levels of participation in drug treatment programs are less likely to recidivate upon release – as program participation increases so does the chance of successful reentry
3. Those who have higher levels of participation in educational programs are less likely to recidivate upon release – as program participation increases so does the chance of successful reentry
4. Those who have higher levels of participation in vocational programs are less likely to recidivate upon release – as program participation increases so does the chance of successful reentry
CHAPTER III METHODOLOGY
The chapter details the research methodology that guided this study. The chapter begins with a discussion of the research design, followed by the research question and hypothesis. Next, is a presentation of the data source and a discussion of the variables that were used. Finally, concluding this chapter is a discussion of the data analysis techniques and limitations that were employed.
Significance Of The Study
Reentry can be a daunting task for inmates once released from prison, and through completion of prison programs, the likelihood of successful reintegration could be higher. The current study examines reentry success of former inmates based on the incidence of rearrest by using the theoretical concept of commitment to measure prison program participation. This research will add to current literature by examining the role of social bond theory, exclusively the concept of commitment, and how it contributes to recidivism rates among ex-offenders who participate in prison rehabilitation programs.
Research Questions
The purpose of this study is to explore the effect, if any, levels of participation in drug and alcohol treatment, along with vocational and educational courses have on rates of recidivism. To explore this relationship, the following question will be used to guide this study:
1. Do levels of participation in educational programs influence the rate at which an offender recidivates once released from prison?
2. Do levels of participation in vocational programs influence the rate at which an offender recidivates once released from prison?
3. Do levels of participation in drug treatment programs influence the rate at which an offender recidivates once released from prison?
4. Do levels of participation in alcohol treatment programs influence the rate at which an offender recidivates once released from prison?
Research Design
The data used in this study, Recidivism of Prisoners Released in 1994 (ICPSR # 03355), was collected by the Bureau of Justice Statistics and is managed by ICPSR. This research is a cross-sectional secondary analysis research design investigating the impact of treatment and education programs on the rate at which an offender recidivates once released from prison. The data used in this study is restricted from general dissemination, meaning prior to gaining access an Agreement for the Use of Confidential Data thought the National Archive of Criminal Justice Data (NAJCD) was obtained. In addition, a Restricted Usage Data Agreement through Inter-University Consortium for Political and Social Science Research (ICPSR) was completed and approved. A data security plan was put in place to assure the confidentiality of all participants as well as the protection of the hard drive used to store the confidential data. Institutional Review Board (IRB) exemption approval through Old Dominion University was also necessary before gaining access to the dataset. Furthermore, a confidentiality agreement and privacy certificate were signed and approved by ICPSR.
The data in this study comes from a data set collected by the U.S. Department of Justice’s Bureau of Justice Statistics for a special report. It consists of 38,624 sampled prisoners released from prison in 1994 from fifteen different states (Arizona, California, Delaware, Florida, Illinois, Maryland, Michigan, Minnesota, New Jersey, New York, North Carolina, Ohio, Oregon, Texas, and Virginia), and tracked for three years following their release. The Department of Corrections from these fifteen states supplied the Bureau Justice of Statistics (BJS) with release records of 302,309 prisoners released in 1994. The 15 states were chosen as a purposive sample, based on numerous factors. First, 11 of the 15 states were integrated to preserve continuity with the earlier recidivism study done by BJS (RECIDIVISM OF PRISONERS RELEASED IN 1983, ICPSR #8875). Inclusion of the 11 states from the previous study allows for a more comprehensive examination of released prisoners. Second, the 15 states used in the study are large, collectively accounting for two-thirds of all prison releases nationwide in 1994.
Although 38,624 participants were followed as part of the recidivism study, many of these participants were missing data on key variables, particularly in terms of knowing whether or not they had participated in treatment programs. As a result, a filter variable was created to exclude any individuals that had missing data on all four possible programs types. Individuals who participated in treatment programs but had unknown outcomes were also included in the descriptive statistics but excluded from the bivariate and multivariate analyses due to the total number of offenders being relatively small. Filtering out missing data for race, sex, age, and time served was also necessary for the final analysis, thus reducing the final sample size to N=9890.
Variables In The Study
Dependent Variable
As a nominal level of measurement, the dependent variable in this study is the instance of rearrest. It is operationalized by whether or not the prisoner was rearrested at any time with in the three-year follow-up period. Originally, rearrested was coded as 1=rearrested, 2=not rearrested, and 8=not applicable. For the purpose of this study, the instance of rearrest was recoded as 0=not rearrested and 1=rearrested. Pertaining to the previously mentioned filter, rearrest was recoded so that those who weren’t applicable were excluded in this study (8=not applicable). The dependent variable rearrested or not rearrested consists of 11,081 individuals and not applicable made up 27,543 individuals.
Independent Variables
The independent variables contain measures of 4 different types of treatment programs available to prisoners. Educational courses, vocational courses, drug treatment, and alcohol treatment were constructed using the commitment concept of social bond theory. The theoretical concept was measured by participation level in the prison programs. The variable measurements for each program type were defined as: 2=inmate participated in program and completed it, 1=inmate participated but did not complete, and 0=inmate did not participate.
Control Variables
The control variables in this study are age, sex, race, time served, and sample offense. For the purpose of this study, ethnicity was excluded as a control variable due to the high amounts of missing data in the original dataset.
In this study, age at release is a continuous variable. To obtain age at release, date of birth for each offender was subtracted by year of release (DateOfBirth-1994=AgeAtRelease). The sex
of the released prisoner was also used as a measurement in this study. It was coded as follows: 1=Male and 0=Female. In addition, race of the released prisoner was used as a measurement. In the original dataset race was coded as 1=White, 2=Black, 3=American Indian/Aleutian,
4=Asian/Pacific Islander, 5=Other, 9=Unknown, but for the purpose of this study it was recoded as follows: 0=White and 1=Black. American Indian/Aleutian and Asian/Pacific Islander made up less than 2% of the sample and were therefore excluded in this study. Unknown was also
excluded for the purpose of this study.
There were 13 offense levels in the dataset of released prisoners, and this was measured corresponding to the conviction offense for which the offender was incarcerated at the time of this study. The sample offense was recoded as a binary variable since the levels of measurement in the original dataset were categorical. In the original dataset, sample offense was categorized as 1=homicide, 2=rape/sexual assault, 3=robbery, 4=aggravated assault, 5=burglary, 6=larceny-MVT (Motor Vehicle Theft), 7=FFE (Financial/Fraud/Exploitation), 8=drug possession, 9=drug trafficking, 10=weapons, 11- DUI (Driving Under the Influence), 12=other public order,
13=other. For the purpose of this study sample offense was recoded to reflect violent and non-violent offense types. Violent offenses included homicide, rape/sexual assault, robbery, and aggravated assault. Non-violent offenses included burglary, larceny/motor vehicle theft (MVT), (FFE) financial/fraud offense, drug possession, drug trafficking, weapons, driving under the influence (DUI), and public order. It was recoded as: violent offense=1 and non-violent offense=0.
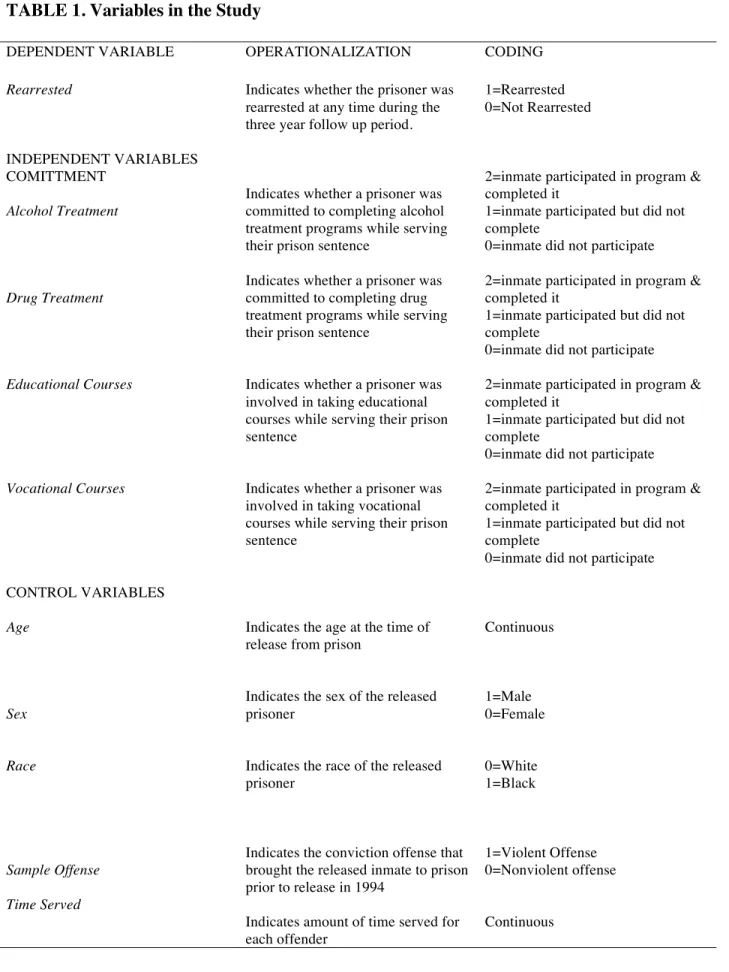
TABLE 1. Variables in the Study
DEPENDENT VARIABLE OPERATIONALIZATION CODING
Rearrested Indicates whether the prisoner was
rearrested at any time during the three year follow up period.
1=Rearrested 0=Not Rearrested INDEPENDENT VARIABLES COMITTMENT Alcohol Treatment Drug Treatment Educational Courses Vocational Courses CONTROL VARIABLES Age Sex Race Sample Offense Time Served
Indicates whether a prisoner was committed to completing alcohol treatment programs while serving their prison sentence
Indicates whether a prisoner was committed to completing drug treatment programs while serving their prison sentence
Indicates whether a prisoner was involved in taking educational courses while serving their prison sentence
Indicates whether a prisoner was involved in taking vocational courses while serving their prison sentence
Indicates the age at the time of release from prison
Indicates the sex of the released prisoner
Indicates the race of the released prisoner
Indicates the conviction offense that brought the released inmate to prison prior to release in 1994
Indicates amount of time served for each offender
2=inmate participated in program & completed it
1=inmate participated but did not complete
0=inmate did not participate 2=inmate participated in program & completed it
1=inmate participated but did not complete
0=inmate did not participate 2=inmate participated in program & completed it
1=inmate participated but did not complete
0=inmate did not participate 2=inmate participated in program & completed it
1=inmate participated but did not complete
0=inmate did not participate
Continuous 1=Male 0=Female 0=White 1=Black 1=Violent Offense 0=Nonviolent offense Continuous
Data Analysis
The general purpose of this project is to understand how participation in prison programs affected inmates after release, specifically whether or not an individual recidivates. To examine this relationship, descriptive statistics, bivariate, and multivariate analyses techniques will be utilized. Also, the previously mentioned filter variable will be used at every level of analysis.
Descriptive Statistics and Bivariate Analysis
The measure of central tendency (the mean and median), as well as measures of
dispersion, the standard deviation, and the measure of frequency will be used to gain a general understanding of the data.
Chi-square tests with Phi and Cramer’s V for strength of association will be the bivariate methods utilized in this study. Chi-square tests are used to analyze categorical data and have two specific purposes: 1. To test the hypothesis of no association between two or more groups, and 2. To test how likely the observed distribution of data fits with the distribution that is anticipated (Rana & Singhal, 2015). Cramer’s V is the most common strength test used when the significant Chi-square result has been obtained (McHugh 2013).
Multi-Variate Analysis
The multivariate analysis technique used in this study is binary logistic regression. This allows for the analysis of dichotomous or binary outcomes with two mutually exclusive levels; also, it permits the use of continuous or categorical predictors and provides the capability to modify for multiple predictors (LaValley, 2008).
CHAPTER IV RESULTS
This chapter presents the findings of the data analysis. This chapter begins with an overview of the descriptive statistics from the data set. The chapter will conclude with a discussion of the bivariate analysis and the multi-variate analysis.
Descriptive Statistics
Table 2 provides an overview of the variables included in the study after the filter variable was applied.
When examining the dependent variable, instance of rearrest, the results of the descriptive statistics indicate that 62.2% of offenders were rearrested while 37.8% were not rearrested. The results for demographic information show that 93.5% of the sample consisted of male offenders while 6.5% consisted of female offenders. In addition, the results indicated that 46.8% of offenders were White with 53.2% being Black. For age, results show that the average age of offenders of the study was 33 years of age. Results illustrate that 53.5% of offenders were incarcerated for a non-violent offense with 46.5% being incarcerated for a violent offense. As indicated by the state Department of Corrections, results showed the 22% of the offenders in this study were identified as being alcohol abusers while 10.5% were not. Furthermore, 33.5% of offenders were identified as being drug abusers while 6.1% were not. Time served was measured as a continuous variable with the average sentence length being 27 years.
For the theoretical concept of commitment, the level of participation in prison programs are the independent variables. Each program was recoded into separate variables by either
participation, completion, or no participation. Participation in alcohol treatment comprised 44.1% of the sample with drug treatment making up 36.5% of the sample. Vocational courses made up 89.3% of the sample and education courses made up 85.1% of the sample. These numbers are only representative of the sample when N=9890 and is not representative of the entire dataset. In fact, before the filter is applied where N=38624, 5.2% of inmates participated and completed the program, 9.5% inmates did not complete the program, 3.6% participated but it was unknown if they competed, and 13.5 inmates did not participate. Unknown information made up 68.3% of the sample. For vocational courses, 3.5% of inmates completed the program, 8.6% did not complete the program, 1.6% participated but had unknown outcomes, and 17.4% did not participate. Unknown information made up 68.9% of the sample. For drug treatment, .6% of offenders completed the program, .4% participated but did not complete the program, 1.0% participated but had unknown outcomes, and 11.8% did not participate. Unknown information made up 86.2% of the sample. For alcohol treatment, 1.3% completed the program, 1.4% did not complete the program, 1.0% had participated but had unknown outcomes, and 12.7% did not participate. Unknown information made up 83.7% of the sample.
!
Table 2. Descriptive Statistics of Study Variables ! ! DEPENDENT VARIABLE N percentage Mean SD Rearrested Not Rearrested 6894 4187 62.2% 37.8% .6221 .48487 INDEPENDENT VARIABLES COMMITMENT
Alcohol Treatment Did Not Participate Participated but Not Completed Participated and Completed 4011 462 415 36.2% 4.2% 3.7% .2634 .60360
Drug Treatment Did Not Participate Participated but Not Completed Participated and Completed 3736 129 183 33.7% 1.2% 1.7% .1223 .44474 Educational Courses Did Not Participate Participated but Not Completed Participated and Completed 4423 3203 1802 39.9% 28.9% 16.3% .7220 .76357
Vocational Courses Did Not Participate Participated but Not Completed Participated and Completed 5734 2920 1236 51.7% 26.4% 11.2% .5452 .70566 CONTROL VARIABLES Sex Male Female 10356 725 94.2% 5.8% .0654 .24729 Race White Black 5181 5900 46.8% 53.5% .4361 .3806 .49897
Age at Release Continuous 11081 --- 33.1230 9.56121
Violent Offense Yes No 5155 5926 46.5% 53.5% .4652 .49881
Alcohol Abuser Yes No 2461 1160 22.2% 10.5% .6796 .48099 Drug Abuser Time Served Yes No Continuous 3715 671 11081 84.7% 15.3% --- .8470 27.1537 .40931 32.87126
Table 3. Relationship to Drug Treatment Programs and Instance of Rearrest by means of Chi-Square Test (n=4048)
Approx. Sig.: Relationship among variables exists at p<.05
Cramer’s V: V≤.3 it is a weak relationship, V≥.4 it is a strong relationship as it is closer to 1.
(%): Shows percentages of cross tabulation counts between independent variable and dependent variable.
Table 4. Relationship to Alcohol Treatment Programs and Instance of Rearrest by means of Chi-Square Test (n=4888)
Approx. Sig.: Relationship among variables exists at p<.05
Cramer’s V: V≤.3 it is a weak relationship, V≥.4 it is a strong relationship as it is closer to 1.
(%): Shows percentages of cross tabulation counts between independent variable and dependent variable. : Shows percentages of cross tabulation counts between independent variable and dependent variable.
DID NOT PARTICIPATE PARTICIPATED BUT NOT COMPLETED PARTICIPATED AND COMPLETED
Phi Cramer’s V Approx. Sig. .059 .059 .001 Not Rearrested 36.5% 38.0% 50.3% Rearrested 63.5% 62.0% 49.7% DID NOT PARTICIPATE PARTICIPATED BUT NOT COMPLETED PARTICIPATED AND COMPLETED
Phi Cramer’s V Approx. Sig. .056 .056 .001
Not Rearrested 35.8% 38.5% 45.3%
Rearrested 64.2% 61.5% 54.7%
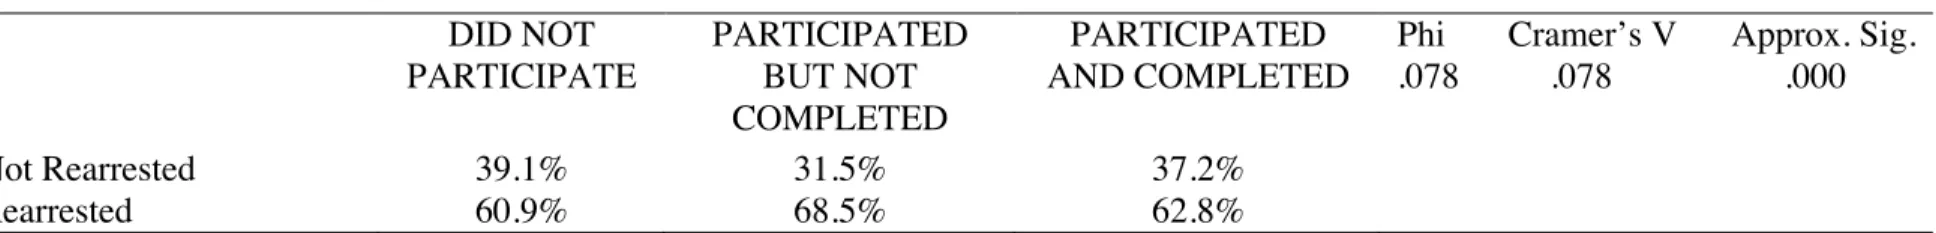
Table 5. Relationship to Vocational Courses and Instance of Rearrest by means of Chi-Square Test (n=9890)
Approx. Sig.: Relationship among variables exists at p<.05
Cramer’s V: V≤.3 it is a weak relationship, V≥.4 it is a strong relationship as it is closer to 1.
(%): Shows percentages of cross tabulation counts between independent variable and dependent variable. : Shows percentages of cross tabulation counts between independent variable and dependent variable.
Table 6. Relationship to Educational Courses and Instance of Rearrest by means of Chi-Square Test (n=9428)
Approx. Sig.: Relationship among variables exists at p<.05
Cramer’s V: V≤.3 it is a weak relationship, V≥.4 it is a strong relationship as it is closer to 1.
(%): Shows percentages of cross tabulation counts between independent variable and dependent variable DID NOT PARTICIPATE PARTICIPATED BUT NOT COMPLETED PARTICIPATED AND COMPLETED
Phi Cramer’s V Approx. Sig. .078 .078 .000 Not Rearrested 39.1% 31.5% 37.2% Rearrested 60.9% 68.5% 62.8% DID NOT PARTICIPATE PARTICIPATED BUT NOT COMPLETED PARTICIPATED AND COMPLETED
hi Cramer’s V Approx. Sig. .023 .023 .085
Not Rearrested 37.7% 35.4% 37.7%
Rearrested 62.3% 64.4% 62.3%
Bivariate Analysis
All independent variables were tested using Chi-square analysis to determine if a
significant relationship existed between prison program participation and the instance of rearrest. The strength of relationships was measured using Phi and Cramer’s V for association. All results are shown below in tables below.
Bivariate Results
Table 3 demonstrates that offenders who participated in and completed drug treatment programs were less likely to be rearrested than those who did not participate in drug treatment programs. Of the offenders who completed drug treatment programs, 50.3% were not rearrested within the three year follow up period compared to the 36.5% who did not participate in the program. Of those who participated but did not complete the program, 38% were rearrested within the three year follow up period. These results indicate a strong relationship between program completion and outcome success with the likelihood of rearrest decreasing as program participation increases.
Program participants who completed alcohol treatment programs were less likely rate than those who did not participate or complete the program. Of those that completed the alcohol treatment program, 54.7% were rearrested, versus 61.5% of those that participated but did not complete the program, and 64.2% of those that did not participate in the program. These results indicate a strong relationship between program completion and outcome success with the likelihood of rearrest increasing by nearly 10% for those who did not participate in alcohol treatment compared to those who completed alcohol treatment.
For vocational courses, offenders who participated in but did not complete the courses were less likely to be rearrested than those who did not participate and those who completed. For offenders who participated but did not complete vocational courses, 31.5% were not rearrested compared to 39.1% of those who did not participate, and 37.2% of those who completed the courses. These results could be due to several factors. First, some inmates could have been released before getting the opportunity to complete vocational courses. Also, it could mean that the vocational programs from this time period were simply not effective at increasing the chances of successful reentry for offenders.
The results for educational courses were statistically insignificant in explaining the relationship between instance of rearrest and program participation. Offenders who did not participate in educational courses were rearrested at the same rate as those who completed educational courses (62.3%). Offenders who participated but did not complete the program were most at risk for rearrest with 64.4% rearrested within the three year follow up period.
Table 7. Multi-Variate Analysis - Logistic Regression – Alcohol Treatment and Instance of Rearrest
Black=1, Violent Offense=1 B: Coefficient for the Constant S.E.: Standard Error
Exp(B): Odds Ratio
DV: Rearrest
Variables B S.E. Wald Sig. Exp(B)
(n=4888) Block 1 Alcohol Participation Alcohol Completion Block 2 (n=4888) Alcohol Participation Alcohol Completion -.116 -.394 -.026 -.325 .101 .104 .108 .112 1.310 14.391 .059 8.432 .252 .000 .809 .004 .891 .674 .974 .723 Male -.597 .115 26.826 .000 .550 Black .795 .064 155.786 .000 2.214 Age at Release -.047 .004 175.252 .000 .954 Violent Offense Time Served Block 3 (n=2491) Alcohol Participation Alcohol Completion Male Black Age at Release Violent Offense Time Served Alcohol Abuser Drug Abuser -.566 .002 -.102 -.325 -.447 .726 -.041 -.493 -.002 .001 .709 .069 .001 .142 .147 .157 .089 .005 .096 .002 .108 .125 67.896 3.185 .521 4.921 8.050 66.893 60.390 26.498 1.192 .000 32.118 .000 .074 .470 .027 .005 .000 .000 .000 .275 .992 .000 .568 1.002 .903 .722 .640 2.067 .959 .611 .998 1.001 2.031
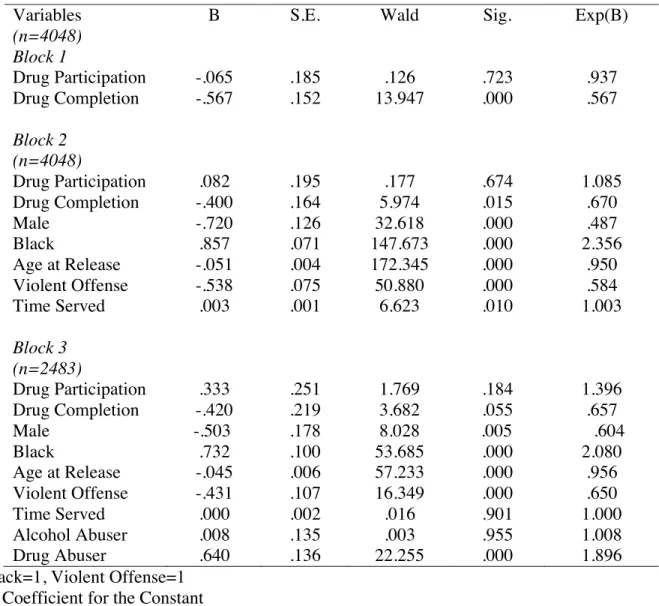
Table 8. Multi-Variate Analysis - Logistic Regression – Drug Treatment and Instance of Rearrest
Black=1, Violent Offense=1 B: Coefficient for the Constant S.E.: Standard Error
Exp(B): Odds Ratio DV: Rearrest
Variables B S.E. Wald Sig. Exp(B)
(n=4048) Block 1 Drug Participation Drug Completion Block 2 (n=4048) Drug Participation Drug Completion -.065 -.567 .082 -.400 .185 .152 .195 .164 .126 13.947 .177 5.974 .723 .000 .674 .015 .937 .567 1.085 .670 Male -.720 .126 32.618 .000 .487 Black .857 .071 147.673 .000 2.356 Age at Release -.051 .004 172.345 .000 .950 Violent Offense Time Served Block 3 (n=2483) Drug Participation Drug Completion Male Black Age at Release Violent Offense Time Served Alcohol Abuser Drug Abuser -.538 .003 .333 -.420 -.503 .732 -.045 -.431 .000 .008 .640 .075 .001 .251 .219 .178 .100 .006 .107 .002 .135 .136 50.880 6.623 1.769 3.682 8.028 53.685 57.233 16.349 .016 .003 22.255 .000 .010 .184 .055 .005 .000 .000 .000 .901 .955 .000 .584 1.003 1.396 .657 .604 2.080 .956 .650 1.000 1.008 1.896
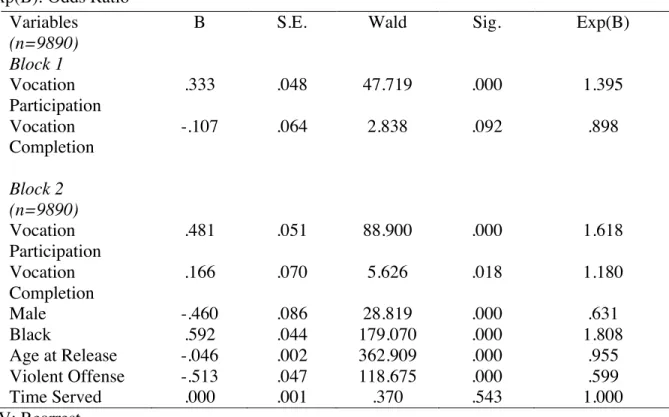
Table 9. Multi-Variate Analysis - Logistic Regression – Vocational Courses and Instance of Rearrest
Black=1, Violent Offense=1 B: Coefficient for the Constant S.E.: Standard Error
Exp(B): Odds Ratio
DV: Rearrest
Variables B S.E. Wald Sig. Exp(B)
(n=9890) Block 1 Vocation Participation Vocation Completion Block 2 (n=9890) Vocation Participation Vocation Completion .333 -.107 .481 .166 .048 .064 .051 .070 47.719 2.838 88.900 5.626 .000 .092 .000 .018 1.395 .898 1.618 1.180 Male -.460 .086 28.819 .000 .631 Black .592 .044 179.070 .000 1.808 Age at Release -.046 .002 362.909 .000 .955 Violent Offense -.513 .047 118.675 .000 .599 Time Served .000 .001 .370 .543 1.000
Table 10. Multi-Variate Analysis - Logistic Regression – Educational Courses and Instance of Rearrest
Black=1, Violent Offense=1 B: Coefficient for the Constant S.E.: Standard Error
Exp(B): Odds Ratio DV: Rearrest
Variables B S.E. Wald Sig. Exp(B)
(n=9428) Block 1 Education Participation Education Completion Block 2 (n=9428) Education Participation Education Completion .101 .001 .278 .165 .048 .058 .051 .062 4.372 .001 29.487 7.079 .037 .981 .000 .008 1.106 1.001 1.321 1.180 Male -.416 .087 22.802 .000 .660 Black .566 .045 156.320 .000 1.762 Age at Release -.046 .087 344.222 .000 .955 Violent Offense -.468 .048 94.349 .000 .626 Time Served -.001 .001 .625 .429 .999
Multi-Variate Analysis
For the binary logistic regression, did not participate was used as a reference category for each table. In addition, alcohol and drug abuser were only included in the alcohol and drug treatment analyses.
Alcohol Treatment
Table 7 examines the relationships between alcohol treatment and the different predictor and control variables. For the multi-variate analysis, alcohol treatment was performed three separate times each of which included different control variables within the regression. When examining Block 1, results show that individuals who complete alcohol treatment while incarcerated are 32.6% less likely to be rearrested than those who do not participate in alcohol treatment. There is no significant relationship between alcohol participation and rearrest, and the relationship remains insignificant even when accounting for control variables. The relationship between alcohol completion and rearrest is significant indicating that those who completed the program were less likely to recidivate.
When factoring in control variables for Block 2, the model suggests that males are significantly more likely to be rearrested than females. In fact, controlling for other variables in the model the males are 45% more likely to be rearrested than females. Rate of rearrested for Blacks was 79.5% more likely than for Whites. Age is also significantly associated with rearrest. The older an offender was the less likely they were to recidivate (4.6%). Violent crime is also significantly related to rearrest. Violent crime offenders were 43.2% less likely to be rearrested. For Block 3, where n=2491, the model suggests that drug abusers are 70% more likely to be rearrested than non-drug abusers with a significant relationship.
Drug Treatment
Table 8 examines the relationships between drug treatment and different predictor and control variables. Block 1 indicates a significant relationship between drug treatment completion during incarceration and instance of rearrest upon release with those completing the program 43.3% less likely to be rearrested. For Block 2, males were 51.3% more likely to be rearrested than females. Blacks were also statistically significant with the likelihood of rearrest 85.7% higher than for Whites. Age is significantly associated with being rearrested with each year of age reducing rearrest by approximately 5%. Furthermore, violent crime is significantly related to rearrest with 41.6% of offenders less likely to be rearrested. For Block 3, where n=2483, the model suggests a significant relationship between drug abusers and rearrest. In fact, when controlling for drug abusers, results indicate that non-drug abusers are 64% less likely to be rearrested than drug abusers.
Vocational Courses
Table 9 examines the relationships between vocational courses and different predictor and control variables. Block 1, which only examines the participation and completion, indicates that there is no significant relationship between completion and rearrest. The analysis
surprisingly indicates a significant relationship between participation and instance of rearrest upon release increasing the likelihood of rearrest by 39.5%. According to the model, 36.9% of males are more likely than females to be rearrested. Also, the rate of Blacks being rearrested was 80.8% higher than for Whites. Age is also significantly associated with being rearrested with each year of age reducing rearrest by approximately 4.5%. For those who committed a violent crime the likelihood of rearrested decreased 40.1%. The model indicates that there is no significant relationship between time served and instance of rearrest.
Educational Courses
Table 10 examines the relationships between educational courses and different predictor and control variables. Block 1, which only examines the participation and completion, indicates that there is no significant relationship between completion and rearrest. According to the model, males being rearrested was 34% more likely than for females. Also, Blacks being rearrested was 76.2% than for Whites. Age is also significantly associated with each year of age reducing rearrest by approximately 4.5%. Those who committed a violent crime decreased the likelihood of rearrest by 37.4%. The model indicates that there is no significant relationship between time served and instance of rearrest. Once controlling for other variables, completion of education courses becomes significant (P=.008).
Unexpectedly, for those who participated in vocational and educational courses, instances of rearrest increased. When examining the relationship between participation levels in all four treatment programs and the instance of rearrest, the significance level increases when adding in control variables. This is known as the suppression effect. The most generally accepted
definition of a suppressor variable is a variable that increases the predictive validity of another variable (or set of variables) by its inclusion in the regression equation (MacKinnon, Krull, & Lockwood, 2000). Therefore, a situation in which the magnitude of the relationship between an independent variable(s) and dependent variable(s) becomes larger when a third variable is included would indicate suppression (MacKinnon et. al. 2000). Furthermore, the when adding in the control variables findings were similar across all four models.
CHAPTER V CONCLUSION
The finding of this study indicate that commitment improves recidivism outcomes for offenders who completed alcohol and drug treatment programs but not for those in vocational and educational programs. Recidivism was higher among those that participated in educational and vocational programs compared to those that did not participate. There was no difference between those that completed the program and those that did not participate. The objective of treatment programs is to address the issue of addiction, which if successful, one would assume the benefits of remaining sober would outweigh the cost of returning to prison. This could be a potential explanation for why alcohol and drug treatment programs had higher success rates. Chriss (2007), states that commitment serves as a function of goal attainment.
Unpredictably, social bond theory does not explain the results for educational and vocational courses. The variations of programs across study cities could explain the unexpected results for educational and vocational programs. Furthermore, potential positive impact of these programs was masked because better control variables, such as measure of educational
attainment prior to incarceration, were needed. Differential association theory could be used to explain the results of educational and vocational programs. This theory postulates that through interaction with criminal individuals, one is likely to become more criminal. Associating with other offenders in post-secondary and trade programs could increase the chance of recidivism by strengthening the association with other criminals who might not be utilizing the program for a positive purpose.
The results for control variables remained constant across all four programs. African Americans and younger individuals had higher rates of recidivism. Those who committed violent crimes had lower rates of recidivism compared to those who committed non-violent crimes. Also, drug abusers had higher rates of recidivism whereas alcohol abusers were not significant. These findings are in keeping with past research for race, gender, age, and offense type, but the finding regarding time served was surprising. Though it likely indicates that this measure was problematic without more nuanced controls for offense type.
Limitations Of The Study
One of the limitations of this study is the exclusion of the attachment, involvement, and belief as a part of the theoretical framework for social bond theory. Involvement was not used in this study because it is used to theorize how presently involved not antecedently involved individuals are. The variables in this dataset were strictly limited to physical and demographic attributes of the inmates, prison programs, and criminal records before and after release. This made it difficult to measure for attachment, involvement and belief. However, while this research does not offer a complete test of social bond theory, it allows insight into one of the most
important aspects of social bond theory; commitment. The application of commitment also distinguishes this study from previous literature in that it specifically examines the role of commitment in relation to prison program completion.
Furthermore, this research analyzed data from the Bureau Justice of Statistics, which included historic information on inmates from thirty-two different states from 1994. Although this is one of the most comprehensive recidivism datasets, and there was a three-year follow-up period, new data is available as part of the recidivism series. To examine current standards of
prison programs it would be beneficial for future research to conduct a similar analysis on newer recidivism data. Also, it was difficult to examine Ethnicity (Hispanics) because of the amount of missing data included in that variable.
While looking at the impacts of level of educational attainment on program outcomes would be valuable, it is beyond the scope of the current project. An analysis done in 1994 looked at participants and nonparticipants of education programs. Findings indicated that inmates at the lowest levels of educational attainment benefit most from education programs (as indicated by lower recidivism rates) (Adams et al. 1994). Although the findings of this study are significant, more research is needed to understand why those at the lower levels of education benefit more from education and vocation programs. Adams et al. 1994, noted that present research cannot explain why inmates at lower educational levels seemingly benefit from educational services, though it may be that participating in education programs improves self-image of the
educationally disadvantaged by giving them new skills (Adams et al. 1994).
Discussion and Future Research
Future research could aid in the implementation of new policy by addressing one of the main issues of substance abuse: mental health and substance abuse. Examining inmates with physical and/or mental health conditions who participate in drug and alcohol treatment, and what correlation, if any, that has on successful reentry for ex-offenders would be beneficial for future research. If there are limitations to the potential impact of correctional programs on reentry success, it is likely due to other offender needs not being addressed such as their drug or alcohol dependency (Gaes 2008).
Furthermore, a mixed-methods approach in gathering data would prove beneficial for future research and policy implications. Collecting self-report surveys or questionnaires regarding the needs of inmates (during incarceration and post-release), along with state and federal information, would be one of the most exhaustive recidivism datasets to date. A mixed-methods approach would also give awareness to the needs of offenders from the offenders themselves. The vast majority of prisoners will be released back into the community, and if we are not doing everything possible to ensure individuals become functioning members of society, the odds of successful re-entry dramatically decrease.
By incarcerating individuals for wrongdoings, it is assumed that we create a safe and functional society, but with a disproportionate recidivism rate, and the vast majority of offenders returning to the community this assumption is often proven incorrect. Future policy implications should address the unmet needs many offenders face when trying to improve their chances of successful re-entry. In paraphrasing Bobby Jindal, Governor of Louisiana at the time; without education, job skills, and other basic services, inmates are likely to repeat the same steps that brought them into prison in the first place (2015).
REFERENCES
Adams, Kenneth., Katherine J. Bennett, Timothy J. Flanagan, James W. Marquart, Steven J. Cuvelier, Eric Fritsch, Jurg Gerber, Dennis R. Longmire, and Velmer S. Burton, Jr. “A Large-Scale Multidimensional Test of the Effect of Prison Education Programs on Offender’s Behavior.” 1994. The Prison Journal 74(4): 433-449.
Aos, Steve., Miller, Marna, Drake, Elizabeth. 2006. “Evidence-Based Public Policy Options to Reduce Future Prison Construction, Criminal Justice Costs, and Crime Rates.” National Criminal Justice Reference Service 218591:44.
Beck, L. James., and Hoffman, B. Peter. 1976. “Time Served and Release Performance: A Research Note.” Journal of Research in Crime and Deliquency.
Berg, T. Mark., and Beth H. Heubner. “Reentry and the Ties that Bind: An Examination of Social Ties, Employment, and Recidivism.” Justice Quarterly 28(2):382-410.
Cartier, Jerome., David Farabee, and Michael L. Prendergast. 2006. “Methamphetamine Use, Self-Reported Violent Crime, and Recidivism Among Offenders in California Who Abuse Substances.” Journal of Interpersonal Violence 21:435-445.
Chappell, A. Catheryn. 2004. “Post-Secondary Correctional Education and Recidivism: A Meta-Analysis of Research Conducted 1990-1999.” Journal of Correctional Education 55(2): 148-169.
Chriss, J. James. 2007. “The Functions of the Social Bond.” Sociological Quarterly 48(4):689-712.