© Krishi Sanskriti Publications
http://www.krishisanskriti.org/jceet.html
Office Automation in Construction Management
Using Data Visualization Environment
Ankit Pusadkar1 and A.R. Kambekar2 1,2
Department of Civil Engineering, Sardar Patel College of Engineering, Andheri (W), Mumbai-58 E-mail: [email protected], [email protected]
Abstract—The reality of today's Construction business is that 70%
of the data needed to run any organization is trapped on paper and paper equivalents such as word documents, PDFs and printable forms. The data which when needed is simply not making its way into the critical systems. This resulting “information gap” is costing lost revenue opportunities, high operating costs and increased compliance risk. The bottom line is project data get disorganized with lack of control of constant flow of documents, invoices which could have a detrimental effect on the business.
This paper expresses effective way for integrated project collaboration using Java based construction automation software. This software is suite of integrated applications that a company can use to collect, store, manage and interpret data from many construction activities. This platform ensures that project meet cost, time and quality expectations with help of organized collaboration between all personals in an integrated manner. This will ensure proper utilization of resources to effectively communicate project data and information and highlight their relationship which leads to improved decision making process.
Keywords: Construction office automation, Construction project
management, Construction software.
1. INTRODUCTION
The construction industry has been described as a data-rich, but information poor environment. In course of any typical project, construction manager need to deal with vast amount of ever-changing data which then analyzed timely to control the proceedings of construction activities [1]. Due to the large volume of data, vital issues relating to important activities could be overlooked. This results in the failure of judicious handling of important situations at critical stages of any project. Construction managers must be provided with meaningful information extracted from project control data to gain insights into actual project performance and make more informed decisions in complex environments. Much of the research on construction data has focused on how to access, integrate, and consolidate voluminous data into inter-organizational database systems [2,3]. In this vast complex construction environment, lack of adequate visual representations can affect project proceedings, causing costly errors and interrupted disillusioned project management.
Rethinking Construction is coordinating all industry activities to create collaborative ways of working. This collaborative way of working aims to create the best value for the client and user by eliminating waste, involving various parties to co-operate early in the design and construction process [4]. Raw data when organized into an informative form, can be turned into meaningful information. Presenting the information coherently and communicated visually can bring the difference in construction management domain.
The adoption of visual planning tools for project management is very slow despite the fact that such techniques facilitate planners and stakeholders to visualize the project execution process and identify problems that may occur before construction takes place. Advancements in virtual reality are capable of handling complex models and can change the culture of the construction industry [5,6]. During various stages of a project, practitioners are faced with the need to easily and quickly make decisions. These decisions are primarily based on the data and information that can be derived from the very large datasets required to represent the various facets of a project. How best data/information can be presented from these large datasets is a fundamental research question. This question is particularly important in the AEC/FM community, because data and information visualization tools are directly usable by practitioners for improving decision-making [7,8,9].
The Construction Management Association of America defines CM as “a discipline and management system specifically created to promote the successful execution of capital projects for owners” CMAA 2001.To cope with the lack of visual representations in the construction management domain we propose to use Java based construction management software to provide collaborative environment which will clarify the complicated structure of data, eliminate confusing factors, and identify key elements.
Construction Project Collaboration
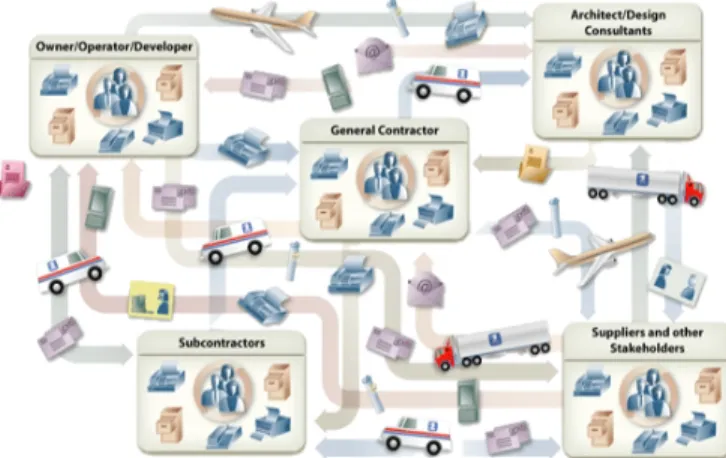
Every major project relies on a complex network of owners, engineers, construction managers, architects, contractors and sub-contractors. In this complex chain of personals shown in
Fig. 1, any slight miscommunication or failure of one of the element to deliver as promised dedicated services can lead to disorganized project proceedings. So it is of vital importance that organized collaboration between all personals must occur in an integrated manner, ensuring that concern project meets cost, time and quality expectations in order to provide project success and profitability. Integrated project collaboration helps to provide most effective way to quickly share drawings, documents, emails, and contracts.
Fig. 1: Complex Network of Managers, Architects and Contractors
Research Motivation
After discovering Internet as the new revolutionary phenomenon in twentieth century, industry once hailed the Internet as a revolution. Those who have studied construction project management, after viewing vast scope they agree that there is a need to replace redundant paper based systems with centralized Web based project management system (WPMS) where project data are held until the project team member needs to use them. Researchers have identified numerous benefits to online collaboration and communication technologies.
These benefits include the productivity enhancement of communication between project participants, reduction in delays, increased awareness of project issues by all parties, ease of access and retrieval of project information. Several organizations that have different roles on a construction project can be brought together with help of WPMS to create one incorporated team. There are many construction personals who seek efficiency and cost savings for designers, Engineers and contractors to adopt integrated WPMS.
2. METHODOLOGY
Data and Information Granularity/Quality
Granularity refers to the level of aggregation or decomposition that is useful for communicating information to project participants and for extracting meaning insights from the
generated data. There is no doubt that construction project produces enormous amounts of data. But ‘big data’ isn’t just about volume. After all, researchers and industrialist in various fields have been coping with very large amounts of data for many years. Big data is also about complexity and speed, and is often characterized by the ‘3 Vs’ -
Large volumes of data, High-velocity data flows, and
Wide variety of data, especially unstructured and semi-structured data such as text and images.
It is essential to define the correct level of detail by considering appropriate data range or granularity. Range and granularity of data is important for effective visualization. This also act as a source of reference for resolving potential conflicts. Despite advancements in visualization, it is still challenging to efficiently process large amount of data and visualize the only required subsets. In this visualization environment, information related to project is been held in different subsets such as Schedule, Daily status, Document log, Employee information, Email correspondence, Company information, Manpower resources, Material resources along with inventory controlling, Equipment log etc.
Computing data to establish relationship
The rapid improvements in technologies have provided engineers with powerful methods of storing, processing, sharing, retrieving and visualizing data. These improvements have made visualization as a growing and essential part in many areas, such as monitoring for progress, productivity, safety, and virtual walk through. In spite of the feasibility of visualization techniques, it is still challenging to efficiently process the massive data collected from the construction sites, which could include planning, scheduling or controlling data. Before visualizing the data it is essential to efficiently filter, prioritize, and relate it. So it is necessary that we should be able to classify the data and establish relationships and inter-dependencies among different components to better manage large amounts of project control data.
With help of extensive analysis, based on the findings from literature, we should be able to investigate various models to understand data analysis process, their current representation of data, visualization scheme adopted in the model to support the decision-making process.Large volume of data can easily reach hundreds of megabytes depending on the size of a construction site and the next level of challenge is to update visualization in real-time to assure the data authenticity for dynamic construction environments.
Interaction of data to manage data flow
It is essential to apply data fusion and conversion to satisfy user’s needs. Identifying those challenges across typical steps of a project delivery that can possibly be solved using vital interaction among vast volume of data. Proper data interaction will lead to successful project controlling. While managing
data flow, resulting knowledge gap can be successfully discussed at individual stages within a project delivery.
Development of Interactive Visualization Schemes
Visualization scheme can act as an interface between construction data and manager, by providing a platform to quickly perceive entire data sets at a glance and easily understand their underlying meanings. Employing the user-centered design approach, we should identify critical factors in the development of visualization schemes, while focusing on Data and Information Granularity/Quality
Computing data to establish relationship Interaction of data to manage data flow
This scheme should ensure that human visual perception and human information processing must be considered while establishing the interface.
Construction Automation is a management software - usually a suite of integrated applications that a company can use to collect, store, manage and interpret data from many construction activities which includes,
Daily status Resources management Document management Email Correspondence Project collaboration Personal notes
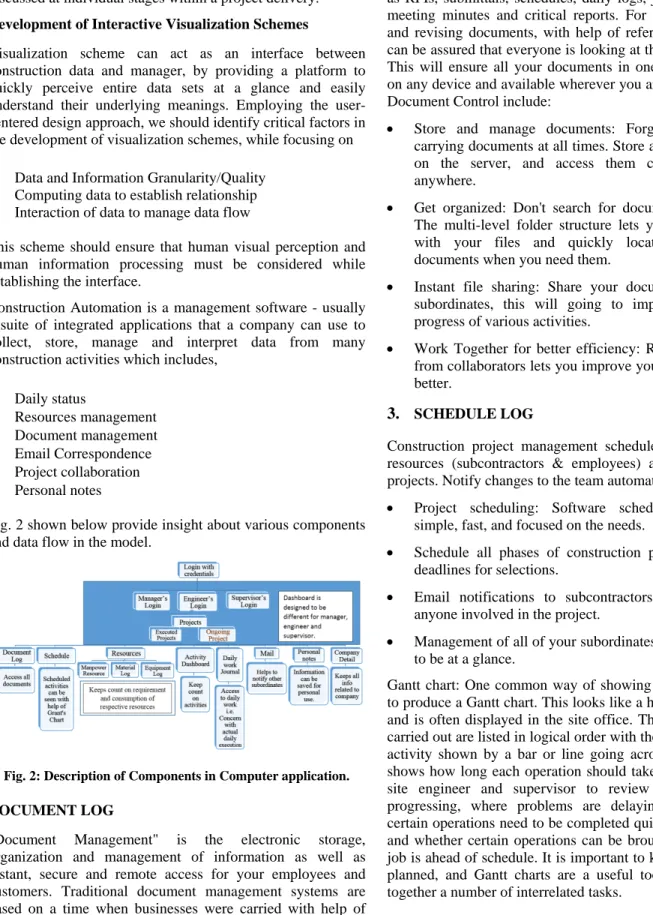
Fig. 2 shown below provide insight about various components and data flow in the model.
Fig. 2: Description of Components in Computer application.
DOCUMENT LOG
"Document Management" is the electronic storage, organization and management of information as well as instant, secure and remote access for your employees and customers. Traditional document management systems are based on a time when businesses were carried with help of paper trails alone.
Share, control, and manage large quantities of documents such as RFIs, submittals, schedules, daily logs, job photos, safety, meeting minutes and critical reports. For storing, reviewing and revising documents, with help of reference number, you can be assured that everyone is looking at the same document. This will ensure all your documents in one place, accessible on any device and available wherever you are. Key benefits of Document Control include:
Store and manage documents: Forget the hassle of carrying documents at all times. Store all your documents on the server, and access them conveniently from anywhere.
Get organized: Don't search for documents in the pile. The multi-level folder structure lets you stay organized with your files and quickly locate the important documents when you need them.
Instant file sharing: Share your documents with other subordinates, this will going to improve the rate of progress of various activities.
Work Together for better efficiency: Real time feedback from collaborators lets you improve your slides faster and better.
3. SCHEDULE LOG
Construction project management schedules for all of your resources (subcontractors & employees) across all of your projects. Notify changes to the team automatically.
Project scheduling: Software scheduling module is simple, fast, and focused on the needs.
Schedule all phases of construction projects, meetings, deadlines for selections.
Email notifications to subcontractors, employees, and anyone involved in the project.
Management of all of your subordinates & resources need to be at a glance.
Gantt chart: One common way of showing these processes is to produce a Gantt chart. This looks like a horizontal bar chart and is often displayed in the site office. The operations to be carried out are listed in logical order with the duration for each activity shown by a bar or line going across the chart. This shows how long each operation should take. It is used by the site engineer and supervisor to review how the job is progressing, where problems are delaying work, whether certain operations need to be completed quicker than planned, and whether certain operations can be brought forward if the job is ahead of schedule. It is important to know how jobs are planned, and Gantt charts are a useful tool to help you fit together a number of interrelated tasks.
4. RESOURCES
Resources will record all available manpower, material, equipment with the company. It will ensure record of all rented machineries and equipment as per project with help of proper daily based data entry. Resources includes mainly three tabs namely,
Manpower resource Material log Equipment log
Manpower tab will ensure recording of all the workers, supervisors, engineers, managers according to their daily role and working hours. Mainly it will ensure proper data related to all the daily wages based workers
Material log will record daily reporting of material received, utilized on the site, and will help to notify the scarcity. This will help to ensure proper availability and keep count on respective project site on daily basis. Equipment log will ensure keeping record of all the pre-owned equipment and machineries and also to record their positioning with respect to various project sites. This will also record machineries taken on rent basis to ensure log of operating hours on daily basis. 5. DAILY WORK JOURNAL
The Daily Work Journal will record all important information that relates to the project activity, including shown in table below:
Table 1: Daily work journal entries
Journal Entries Build a detailed narrative of site conditions.
Weather Conditions
Record temperature, precipitation, wind and ground conditions
Visitors Identify days when visitors were on site. Activities Track task progress, start and completion dates Subcontractor
/Labor
Classify labor by type, and record Details about performance and attendance. Equipment Itemize onsite equipment and specify usage. Events Describe occurrences that fall outside the area
of work-in-progress such as, conflict, accidents, unknown conditions or any notable event.
Daily Work Journal will record all important information with help of various windows shown in Fig. 3.
Fig. 3: Data Entry window for Domain daily work Journal in Model.
6. FIELD MANAGEMENT FEATURES
Duplicate Entries: Acknowledging that day-to-day activities may not change greatly, users can duplicate a previous day’s entry and make modifications, saving time and allowing the user to concentrate efforts on new activities.
Roll-up Summaries: Using coding relationships, the Daily Work Journal can create a summary report combining multiple vendor reports.
Reports and Sorting Capabilities: The ability to sort data by any number of criteria allows users to view journal entries by company or contact and by time period.
Permanent Record: Once reviewed and accepted, daily journal entries become part of the project’s permanent record that can be relied on as a source of truth for analyzing performance, processing payments or settling disputes.
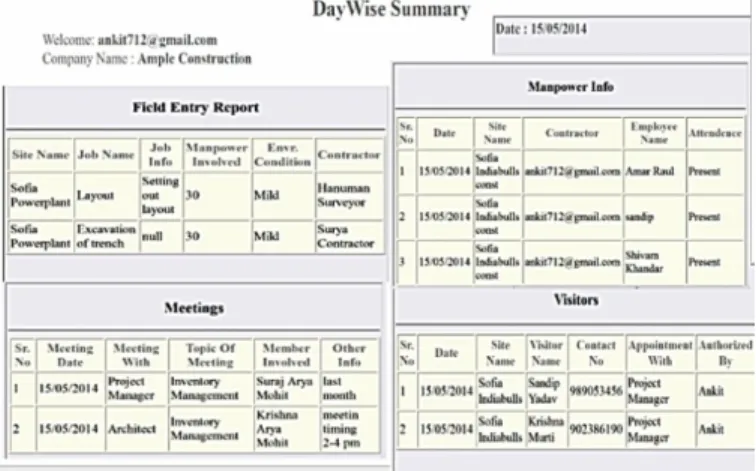
Fig. 4 provides auto generated report with help of daily data entry. This generated report can be used by managers for analyzing situations at site.
Fig. 4: Day wise Summary Report
7. ACTIVITY DASHBOARD
Dashboard provides an instant view of items requiring your attention or follow-up from others. The dashboard highlights complete path of the activity and all related coordinates involves in the process. This allows project managers quickly move from activity to activity in order to effectively respond to the fast-changing demands of their jobs.
This activity dashboard will be designed such that respective employer’s decision and time consumed to execute certain activity will be highlighted in a bigger process. This will help them to ensure importance of certain task in whole bigger process and to make individual accountable for it.
Dashboard will ensure respective attachment and other documents to be available to the concerned authority which will help to speed up the process.
8. EMAIL CORRESPONDENCE
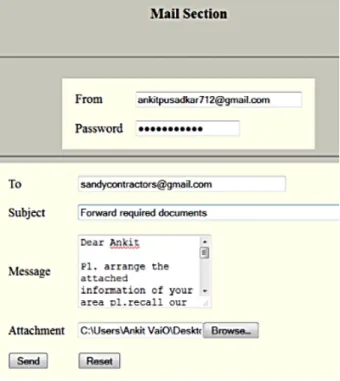
Email contains a designed format to mail other concerned employee regarding any manner of discussion with arrangement of attachments as shown in Fig. 5. This feature can be utilized to help with the conversations regarding any complex situations to simplify.
Email makes up 90% of correspondence in today's construction environment. Employees need an easy method to identify critical email content. Emails, attachments, and the entire message thread should be tracked automatically without constant intervention from the end user. Content Management integrates seamlessly with Emails for correspondence management. Email can be sent to other coordinates regarding any issues and importantly the past conversation can also be viewed whenever required.
Fig. 5: Email Correspondence
9. COMPANY DETAILS
Company info provides information regarding company i.e. overview, owner’s message, management team, vision and mission, certifications etc. Employee log include all information related to the employee with his contact info. This conveys information about branch offices along with their corresponding addresses and contact info.
Company Info Employees Contacts
Personal notes
Personal notes section is to record any information or sticky notes in the application. This helps individual as a reminder or alarm. Personal notes tab is designed for personal use only. 10. RECOMMENDATIONS
The ideal situation is one in which the owner leads by implementing the system and requires WPMS in the contract on the project. However, In India, many owners as well as contractors are not familiar with utilizing WPMS or do not have enough knowledge or understanding. If the owner cannot be a leader for the successful implementation, Contractors could take their place because they operate a large role on the project, afterwards they can recommend WPMS to owners and the design team. If a leader requires WPMS be used on a project, he should prepare a support system such as training or workshops to help users to understand the benefits of using WPMS.
The effort to implement the new system is often a burden for team members who are required to use it by contract or for owners who do not have experience with WPMS. The issues could be resolved by setting up a meetings to discuss what kind of system should be utilized or how beneficial the system is on a project. The effort for implementation of WPMS can be successful on a project level basis if each project has established project specific goals. Based on the research to date, it seems that there are three main categories that need to be addressed when implementing Web-based collaboration systems: people, program and process.
People
For successful implementation, there needs to be support from upper management and the leaders of the primary user organizations. Role of owners are vital for successful championing for WPMS. It is also clear that project team level champions be cultivated to use the system and integrate it into their daily work lives.
Program
From a user interface and customer service perspective, the software and hardware tools have to be easy to implement. It has been observed that if the project team members do not feel comfortable using the system, they should feel free to abandon the software to revert back to the traditional way of doing things. The technology also has to be reliable. If the user interface is intermittent or the software frequently crashes, users will abandon the system for another process that is more reliable. The goal then is to make the new system the easiest way to get things done.
Process
For successful implementation, the new technology must be integrated into the daily work processes of the users. If the
software tool becomes an add-on to existing processes, it will be the last on the list for its utilization in project. However, if the software tool is integral to the daily work processes of the management team, it will become instrumental.
11. CONCLUSION
Construction involves many tedious ever changing activities, which day wise produces vast volume of data. The information generated in each day need to be addressed with help of prior importance to the key vital data and selective negligence. There are many resources which works in tandem for effective successful completion and to ensure that project meets cost, time and quality expectations.
This Java based application provides a healthy environment to all construction personals users to easily make sense of large amounts of data and see the wealth of information that lies within, which have the potential of providing the construction management community with the foundation to begin solving the “data-rich, information-poor” problem.
Data visualization is a powerful paradigm in capturing and telling a project’s as-built story from various perspectives, including working conditions encountered and distribution of problems in time and space.
REFERENCES
[1] Chiu C. Y., and Russell A.D. (2011). “Design of a construction management data visualization environment: A top–down approach”, Automation in Construction, 20 (4), 399-417.
[2] Hanlon, E. J. and Sanvido, V. E. (1995), “Constructability Information Classification Scheme,” Journal of Construction Engineering and Management, Vol. 121, Issue 4, 337-345. Kang, L. S. and Paulson, B. C. (1997), “Adaptability of Information Classification Systems for Civil Works,” Journal of Construction Engineering and Management, Vol. 123, Issue 4, 419-426.
[3] Kang, L. S. and Paulson, B. C. (2000), “Information
Classification for Civil Engineering Projects by Uniclass,” Journal of Construction Engineering and Management, Vol. 126, Issue 2, 158-167.
[4] Rafiq, M. Y., and M. J. Riley. "Rethinking IT for rethinking construction." Bridges10, no. 40704 (2003): 20.
[5] Marasini, Ramesh, John Dean, and NashwanDawood.
"Application of visualisation tools in project management in construction industry: Innovation and challenges." In Computing in Civil Engineering (2007), pp. 91-102. ASCE, 2007.
[6] Korde, T., Wang, Y. and Russell, A. (2005). “Visualization of Construction Data”, Proc., 6th Construction Specialty Conference, Canadian Society of Civil Engineers, Toronto, Canada.
[7] GolparvarFard M., Staub-French S., Po B. and Tory M. (2006). “Requirements of a mobile interactive workspace for design development and coordination.” Proc., ICCCBE, Montreal, QC [8] Chiu, Chao-Ying, and Alan D. Russell. "Design of a
construction management data visualization environment: A top–down approach." Automation in Construction20, no. 4 (2011): 399-417.