Haptic Glyphs (Hlyphs) - structured haptic objects
for haptic visualization
Jonathan C. Roberts and Keith Franklin
Computing Laboratory, University Of Kent, UK
E-mail: [email protected], [email protected]
Abstract
Haptic devices can be used to visualize information. As well as representing tangible surfaces and forces to enhance virtual training simulators for instance, haptic devices have been used to realize tactile versions of diagrams and visualizations (such as line graphs and bar charts). Such depictions enable blind or partial sighted users to perceive and understand information. However, there are multiple challenges when presenting information tactically: (1) it is difficult to understand a summary of the information, and (2) it is challenging to represent multivariate information through these haptic representations. In this paper we present how hlyphs (haptic versions of the graphical glyph) can be created, describe design guidelines, and detail how they can be used to represent both summaries and multivariate information.
1.
Introduction
Everyday we (as humans) understand information through each of our senses, for instance, we instantly understand the load on our computer by viewing a load-balance graph; we hear people advancing down a corridor long before we see them; we perceive that our lunch is cooked because we feel the heat radiating from it. Likewise it is possible to represent and hence perceive information through any medium including touch. There are many devices that can create forces that can be felt (from force-feedback positional information on the PhantomTM to the Logitech iFeel
mouse). Information can be mapped into these forces, such that the user can feel the information.
There are several reasons why it is useful to represent information using touch. First, the representations may enable blind or partially sighted users to perceive the presented information; second, the haptics can be used alongside traditional forms of information presentation in order to enhance and re-enforce the displayed content.
The challenge for a developer is to find a successful mapping that effectively realizes the complexity of the information in the haptic environment in a way that users can perceive. Haptics have been incorporated
into previously developed graphical rendering; the haptics augment and enhance the graphic experience (such as used in medical training simulators). Other researchers have focused on generating appropriate tactile representations of diagrams and plots to enhance accessibility of this information. Researchers have taken inspiration directly from the visual counterparts and generated, for instance, haptic line-graphs and haptic plots. These are ‘equivalence designs’ [19] as their form is equivalent to the visual domain.
In the same way we draw inspiration from the visual domain and develop a haptic variant of the glyph. Thus, this paper introduces the concept of Hlyphs as a new way to visualize information through touch.
Glyphs are commonly used in visualization. Simply, glyphs are graphical shapes or symbols that convey meaning. Commonly, various parts of the shape can be used to represent different values. An early example is the face glyph by Chernoff [6]. In this glyph different parts of the face realize different attributes of the data (the face shape, nose length, mouth length etc each representing different values of the data). Glyphs are different from icons in two fundamental ways: (1) icons have one unique association, whereas glyphs simultaneously encode multiple values, and (2) the form of an icon is constant, whereas the specific appearance of a glyph depends on the applied data, where the orientation, length of adornments or quantity and form of embellishments may be altered. For example, by selecting an icon symbolizing a filing cabinet the operating system will launch a file browser (the operating system associates one action with each icon), whereas a wind arrow glyph on a weather map represents both the direction of the wind (by changing the orientation of the arrow) and its speed (through the length of the arrow).
One important aspect to note is that the glyphs are structured and self-contained objects; they are abstractions of the information. In graphic realization the users’ eyes saccadically scan to understand the whole object. However, such synoptic visualizations are inevitably more difficult with haptic representations, because it is difficult for the user to
Figure 1. Example glyphs. (a,b) Star glyphs. (c) Chernoff faces [6], where different parts of the face can be mapped to different attributes. (d) Stick figure glyphs [17][20]. (e) InfoBug [7] shows an overview of software components, such as the number of lines of code, errors in the code, quantity of added code etc. (f) C-glyph developed for external/internal link visualization of webpage results [4].
quickly tour over the whole tactile area in order to understand an overview of the information. Hence the glyphs may be able to facilitate quick understanding as they are self-contained objects and the user need only browse through a small contiguous and contained space
Another fact is that the glyphs represent multivariate values. Thus, it should be beneficial to the user to understand multiple values in a small, enclosed area, restraining the user from getting lost.
Finally the position and location of the glyph is often important, which matches well with many of the haptic devices that naturally depict position information through kinesthetic movement.
Haptic visualization is still in its infancy, and there is the need for small, self-contained, well-structured, haptic objects: hlyphs. We believe that these hlyphs will be useful to enhance accessibility and also can be usefully utilized to depict information in a multimodal environment.
This paper introduces Haptic Glyphs (hlyphs) it gives an overview of glyphs and haptic visualization (section 2), in particular describing haptic icons (tactons) and their difference to hlyphs. We present design guidelines for hlyphs (section 3) and present two examples (section 4).
2.
Background & Related Work
In this section we first review graphical glyphs, drawing inspiration and learning from the application and use of graphical glyphs. Second we review haptic visualization.
2.1
Graphical Glyphs
There are many forms of graphical glyphs. We categorize them into two groups: (1) iconic or symbolic glyphs; (2) texture oriented glyphs that are fabricated from individual elements and appear as textures.
Many of the symbolic glyph designs mimic physical objects, for example, abstract star glyphs [25], stick
figures [17][20], arrows and boxes [4][26] to more personified face [6] and bug glyphs [7], see Figure 1. Most of these are used to represent multivariate information where various adornments relate to different parameter values. For instance, the InfoBug glyph [7] (Figure 1c) was developed for software visualization and depicts aspects of the code development (such as number of lines of code, errors in the code etc). While others, however, are used to realize errors or uncertainty (these can be imagined as being error-bars on the visualization). Wittenbrink et al [29] for example, have developed various arrow glyphs to represent uncertainty in flow fields. These uncertainty glyphs allow the user to understand the accuracy of the displayed data.
Texture glyphs, on the other hand, utilize pixel-point visualization techniques [1][12]. They are not symbolic of any real-world phenomenon but generate a textured appearance in a small-encompassed space.
Another important aspect is the placement of the glyphs. Matthew Ward [26] discusses strategies of glyph placement. These include, data-driven (where data is used to place the glyphs, such as utilized by Boukhelifa et al [4]), and structure-driven (where the structure implies connection or order, such as spreadsheet [1] or the radial or raster patterns on the pixel glyphs [1][12]).
Sometimes the placement of the glyph does not necessarily need to present any additional information, and the task of the glyph is to realize an overview or summary of the information. For example, box-plots [22][23] sometimes known as box-and-whisker-plots are used to realize the statistical distribution of the data, Figure 2.
In summary, there are many forms of glyphs and potentially developers could design haptic versions of these designs. For instance, we could envisage various textures being grouped together to create a haptic texture hlyph, or generating a synoptic box-plot hlyph. In fact, we believe that synoptic hlyphs are important, because by developing haptic variants of the box-plot glyphs or at least summary glyphs, users may be able to understand an overview of the information without the need to saccadically move over the whole graph, and getting lost in their exploration.
2.2
Haptic Visualization
In this section we review guided (passive), unguided (active) and constrained presentation.
Much the same way as data is mapped into graphic symbols in a graphic visualization, so in a haptic visualization the data is exchanged into a haptic form. In essence one could argue that the same processes that occur in visualization need to be applied in haptic visualization. Indeed, Bertin [2] discusses the general process of exchanging the content into the container. Obviously the content is the data, and his container was graphic symbols however the same principles apply if the container were haptic variables. These variables include position, friction, vibration, and attraction/ repulsion. Therefore, by applying the same principal to the dataflow pipeline of visualization design [19], we define that likewise, to generate a haptic visualization the data needs to be (1) selected, to choose what information is being demonstrated, then (2) processed or enhanced to get it into an appropriate range or form to be displayed (e.g. the data may be aggregated or normalized), and finally (3) the information is exchanged into an appropriate haptic variable. The haptic variables that are usable obviously depend on the haptic device being used.
In fact, because the user of a haptic visualization needs to move and explore the information (much the same way we saccadically view graphics) we propose that information can be mapped into a haptic visualization in one of three ways: guided, unguided and constrained presentation [19]. The first two methods are also known as passive and active methods respectively as described by Enriquez [8]. Both passive and active methods of representation are defined from the user perspective.
Guided/Passive haptic representation is where the user is passive and the system actively moves or vibrates to represent the information. Alternatively, the user may be guided round the visualization to make sure that they visit and understand key points in the depiction [19].
Various vibrotactile or force-feedback devices can be used to generate passive representations. For instance, Enriquez and MacLean [8] studied haptic icons with a vibrotactile actuator that realized different frequencies and waveforms. Brewster and Brown [5] also use vibrotactile devices and introduce tactons: “the user feels the Tacton then recalls its meaning rather than having the meaning described in Braille (or speech or text)”. Tactons are similar in construction to Earcons (auditory icons) [3]. Brewster and Brown [5] describe a tacton example where “a high frequency pulse that increases in intensity could represent [a] Create [option of a menu]” and “a lower frequency
pulse that decreases in intensity could represent Delete”. They go on to explain Transformational Tactons, where different properties can be mapped onto a different tactile parameter; for example “if transformation tactons were used to represent files in a computer … the file type could be represented by rhythm, size by frequency…”[5]. Transformation tactons are similar in goal to Hlyphs, but the foremost concern of tactons is to realize identity (similar to an icon) whereas the main aim of hlyphs is to realize quantitative and qualitative information, moreover, transformation tactons are passive while the hlyphs we have developed are active representations.
Unguided/Active representation is when the user moves and explores the information freely: the user is being active. The glyphs in this paper are active realizations – where the user actively explores the presented information. Oakley et al [15] describe haptic widgets. They apply haptic forces to various icons in order to enhance the feedback experience in a user interface. By augmenting the current interface with haptics a performance increase can be gained. Constrained navigation. The properties of the system as a whole can contain a mixture of both passive and active methods. For instance the user can be guided to a particular point of interest in the world and allowed to explore freely within certain constraints. Roberts et al [19] describe a metaphor of a museum tour, where the user is directed to a pertinent and hopefully interesting part of the visualization (directed as on a museum tour) and allowed to roam freely to investigate (left to discover the contents of this room).
3.
Hlyph Design Principles
By considering the aforementioned related work on glyphs and haptic visualization, and appropriate design rules [14] we propose the following design principles for hlyphs.
Structured design. Choose a well thought-out design, one that is easily understandable and perhaps mimics a physical object or personifies something. Many glyphs are easily memorable because they are allegories or symbolic, for instance Chernoff faces [6] or InfoBug [7]. The form of the object is important, because some forms may be more difficult to explore than others. Oakley et al [15] state, “…it is also important to consider its shape, and the likely path a user will take over it. For instance … diagonal motion is more difficult than horizontal or vertical motion”.
It is feasible to imagine the use of textured hlyphs, where a different texture patch related to a different
parameter of the data and the values being mapped onto different texture gradients, for instance Fritz and Barner [10] describe how various haptic textures can be created.
Compound/Multifacited design. Each glyph is made of many parts; likewise the hlyph should be made of many parts. Each of the parts can be used to encode different variables. Various designs are perceivable; perhaps they may have multiple adornments (such as the star glyph) or multiple attachments (such as InfoBug) that can encode information.
There are many challenges with mapping the information into haptic variables and much research is still needed in this area; for instance, readers may like to think how to map qualitative, quantitative or even nominal information into the haptic domain. The range of each of these haptic variables is much less than visual counterparts, for instance, Brewster and Brown [5] suggest (collated from various researchers) that a maximum of nine levels of vibrating frequency can be perceived to be different and that 28dB seems to be the useful amplitude maximum (after which perception deteriorates). Furthermore, there has been little research into the interference of each of these variables, or to which variables are more dominant when used together. More research needs to be achieved to evaluate effective mappings of these variables.
Self contained. It would be difficult for the user to effectively navigate and understand the information if the hlyph have holes (that the user may ‘escape’ through) or are defined over a large area (where the user may forget earlier parts during browsing) or be disjoint in any way.
Endogenous design. It is potentially easier to haptically explore the inside of the object rather than external designs (or at least have borders round the hlyph to stop the user escaping); this obviously goes hand-in-hand with being self-contained.
There is various research that supports this design guideline: Ramloll et al [30] found that users more easily followed the valleys, and Jansson and Billberger [11] discovered that, due to the nature of the haptic devices (such as the point based contact of a PhantomTM and the need to probe the external surface)
it is often difficult to perceive 3D objects effectively. Furthermore, Oakley et al [15] explain that objects with “...basins or haptically walled areas have typically provided the best performance improvements”.
Pre-attentive visualization. One of the aims of a visualization designer is to generate pre-attentive
visualizations [27]; that information implicitly pops-out (one red point is immediately recognizable in a sea of grey points). To date, it is unclear how to appropriately design a pre-attentive non-visual representation because there has been little research into prioritization of various haptic variables. Further research needs to be done. However striving for pre-attentive visualizations should be a design goal of haptic visualization.
Conceptual mappings. Following on from the pre-attentive design goal, the user should implicitly understand how the information is realized or mapped to perceive the information.
Some conceptual mappings are ambiguous, especially the polarity of the mapping. This readily occurs in the visual domain. For example, it can be unclear whether a darker color will be perceived as a larger value and a lighter color as a lower value, or whether the vise versa mapping will be perceived. Walker and Lane [24], discussing sonification mappings, explained that sighted users mapped high pitches to high values, whereas blind users mapped the reverse[14]. They conjectured that blind participants were using utilizing a model of money – they imagined dropping a bundle of banknotes, which would make a low-pitched sound. Likewise, haptic mappings may be ambiguous, for example, it may be difficult to perceive whether up or down maps to a greater value.
Perceived affordance. “A good designer makes sure that appropriate actions are perceptible and inappropriate ones invisible” [14]. In other words, the design should allow the user to implicitly know ‘what to do’, and how to navigate and explore the information space. For instance, the hlyph should not have any hidden parts that are difficult to reach or impossible to find.
4.
Hlyph Examples
We have imagined various hlyphs and explain two realizations below.
4.1
The Synoptic hlyph
One of the challenges with haptics is to understand a summary of the whole information, for instance, there are many challenges to visualizing graph structures. First, it is difficult to represent detailed graphs; second, it is often confusing to realize graphs with multiple intersections because the user does not understand which line they are following. Researchers such as Ramloll et al [30] utilize sound to provide an overview or to augment the haptic information; however in these multimodal realizations it is still
difficult to perceive the whole. Way and Barner [28] explain “the exploration by a blind person of a tactile graphic generally is performed in two stages. First the entire image is explored as a whole, providing a general tactile overview. Second, the details of the tactile image are explored”. Thus synoptic information is important.
The constrained exploded view as shown in Figure 3 and detailed in [19] is a hlyph that realizes summary information of the graph. This work utilized the PhantomTM force-feedback device. Four hlyphs can be placed together on a work-surface to provide the synoptic view of the graph, as they are similar in usage to the box-plot.
The vertical hlyph (Figure 3a) provides a view on the maximum and minimum values of the graph. The second hlyph (Figure 3b) realizes the turning points; each maximum and minimum turning point is represented by a raised or lowered section of the floor, respectively. The user can explore along the groove to discover the location of each turning point in relation to the others. The third hlyph (Figure 3 c) depicts how the gradient changes, which is realized by a slope, i.e. with a positive gradient the floor slopes upward, and with a negative gradient the floor slopes downward. Riedel and Burton [18] showed that users easily perceive the gradients; however, as the gradient decreased the error increased, interestingly Reidel and Burton reported that with horizontal objects the users tended to believe they were declined. The fourth hlyph (Figure 3d) depicts the roots of the graph, and the fifth hlyph (Figure 3e) depicts any intersection with other graphs; ridges in the floor present the information. This model successfully represents synoptic representation of the whole graph, however, this model is not without its challenges, as it is still hard to
compare turning points, and the user must navigate between each hlyph. Potentially a single hlyph could be designed to realize synoptic information of the whole.
4.2
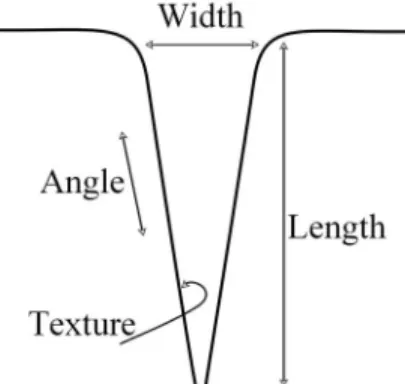
The Cavern Hlyph
The cavern hlyph is a symbolic representation of a cavern, Figure 4. The information is mapped onto various attributes of the cavern, such as the width of the cavern entrance, the depth of the hole, the incline of the tunnel or the texture of the cavern wall. This is an example of an active hlyph.
5.
Summary & Future work
This paper introduces the concept of Haptic Glyphs (Hlyphs) as structured haptic objects for haptic visualization. Glyphs are fundamentally different to icons and hence hlyphs are different to tactons. We foresee many applications for these structured haptic objects, such as for augmented visualization, where they could be applied in a way similar to the usage of popups in a graphical user interface – such that if the user wishes to receive more information on a particular visualization then they can switch into the hlyph representation – or even as accessible realizations, giving synoptic information to the users.
We have included some design guidelines for hlyphs, based on related work and appropriate design procedures, and we have presented two example forms. We are currently further developing these hlyphs and integrating them into specific data visualizations.
In fact, there is much general research to do, especially in regard to haptic visualization. In particular analysis needs to be carried out in order to analyze the range of the haptic variables, their interference with other haptic variables and other non-visual variables such as sound, as well as investigating the perceived polarity of these variables. Indeed, more
Figure 3. A screenshot of our ‘constrained exploded view’ as detailed in [23]. This is made up of multiple hlyphs where each realizes summary information of the graph.
Figure 4. A schematic showing the cavern hlyph. Various values of the date may be mapped to various aspects of the object.
specifically which metaphors and what designs make effective hlyph representations.
6.
References
[1] J. Beddow. “Shape coding of multidimensional data on a microcomputer display”, Proc Vis '90. IEEE. 238-246. [2] J.Bertin “Semiology of Graphics”, The University of
Wisconsin Press. 1983
[3] M.Blattner, D.Sumikawa, R.Greenberg, “Earcons and icons: Their structure and common design principles”. Human Computer Interaction, 4, 11-44. 1989.
[4] N.Boukhelifa, J.C.Roberts, P.J.Rodgers “Multiform Glyph Based Search Result Visualization”. Proc Information Visualization 2002 (IV2002), 549-554. IEEE, July 2002.
[5] S.Brewster and L.M.Brown. “Tactons: Structured tactile Messages for Non-Visual Information Display”. 5th
Australasian User Interface Conference AUIC2004, pp15-23. Dunedin. 2004.
[6] H. Chernoff. “The use of faces to represent points in k-dimensional space graphically”. Journal of American Statistical Association, 68:361–368, 1973.
[7] M.C. Chuah and S.G. Eick “Glyphs for Software Visualization”. Proc 5th Program Comprehension (WPC '97) pp.183-191. IEEE Computer Society. 1997.
[8] M.Enriquez and K.Maclean, “The Hapticon editor: A tool in support of haptic communication research”. Haptics Symp. 2003, LA, CA, 356-362, IEEE Press. [9] J.P.Fritz, T.P. Way, and K.E. Barner. Haptic
representation of scientific data for visually impaired or blind persons. IEEE Trans. Rehabilitation Eng, vol 12 1996
[10] J.P. Fritz and K.E. Barner, “Stochastic models for haptic texture,” in SPIE Intl. Symp on Intelligent Systems and Adv. Manufacturing - Telemanipulator and Telepresence Technologies III, SPIE Vol 3901, pp.34-44, Nov., 1996.
[11] G. Jansson, K. Billberger, “The Phantom used without
guidance”. Proc First PHANToM Users Research Symposium (PURS'99).Heidelberg, Germany. 27-30. [12] D. Keim “Designing Pixel-Oriented Visualization
Techniques: Theory and Applications”. IEEE Transactions on Visualization and Computer Graphics. Vol 6. No.1 Jan-March 2000.
[13] W. C. de Leeuw and J.J. van Wijk. “A probe for local flow field visualization”. In R.D. Bergeron G.M. Nielson, editor, IEEE Visualization '93, pages 39-45, Los Alamitos, CA, 1993. IEEE Computer Society Press. [14] D.A.Norman, The Design of Everyday Things. Basic
Books, New York, 1988.
[15] I.Oakley, A.Adams, S.Brewster and P.Gray. “Guidelines for the Design of Haptic Widgets”. Proc BCS HCI 2002, London, UK, Springer 195-212, 2002
[16] I.Oakley, S.Brewster, A.Glendye and M.M. Masters. “Haptic visualization” Human-Computer Interaction - INTERACT’99 (Volume II) S. Brewster, A. Cawsey & G. Cockton (Editors), IFIP, 1999.
[17] R. Pickett and G. Grinstein, “Iconographic displays for visualizing multidimensional data,” Proc. IEEE Conf. Systems, Man, and Cybernetics, pp. 164-170, 1988. [18] B.Riedel and A.Burton, “Perception of Gradient in
Haptic Graphs: a Comparison of Virtual and Physical Stimuli”, Eurohaptics 2001, Birmingham UK, 90-92. [19] J.C.Roberts, “Visualization equivalence for multisensory
perception”. Journal, Computing in Science and Engineering, 6(3):61-65, May 2004.
[20] J.C.Roberts, K.Franklin and J.Cullinane “Virtual Haptic Exploratory Visualization of Line Graphs and Charts”. In Mark T. Bolas, editor, Proc The Engineering Reality of VR 2002, IS&T/SPIE vol 4660B 401-410. Jan 2002. [21] S.Rose and P-C Wong. “DriftWeed - A Visual Metaphor
for Interactive Analysis of Multivariate Data”. Proc Visual Data Exploration and Analysis, IS&T/SPIE, San Jose, CA, pp.114-121. Jan 2000.
[22] E.R.Tufte. “The Visual Display of Quantitative Information”. Graphics Press, Cheshire, Connecticut. 1983
[23] J.W.Tukey, Exploratory Data Analysis. Reading, Mass., 1977
[24] B.N. Walker and D.M. Lane. “Psychophysical Scaling of Sonification Mappings: A Comparison of Visually Impaired and Sighted Listeners”. Proc. Auditory Display 2001, Espoo, Finland, July 29-August 1, 2001
[25] M.O. Ward, “Xmdvtool: Integrating multiple methods for visualizing multivariate data”. Proc. Visualization '94, p. 326-33, Washington D.C., 1994
[26] M.O. Ward “A Taxonomy of Glyph Placement Strategies for Multidimensional Data Visualization”
Information Visualization, Palgrave MacMillan. Vol 1, Issue 3/4 pp.194-210, Dec 2002
[27] C.Ware. Information Visualization Perception for Design. Morgan Kaufmann Publishers. 2000.
[28] T.Way and K.Barner, “Automatic visual to tactile translation, Parts I: Human Factors, Access Methods and Image Manipulation,” IEEE Trans. on Rehabilitation Engineering, Mar, vol 5 no. 1 pp.95-105 1997.
[29] C.M.Wittenbrink, A.T. Pang and S.K. Lodha. “Glyphs for visualizing uncertainty in vector fields”. IEEE Trans on Visualization and Computer Graphics, Vol. 2, No. 3, pages 266-279, 1996
[30] W.Yu, R.Ramloll, S.Brewster and B.Riedel, “Exploring computer-generated line graphs through virtual touch”. Proc IEEE ISSPA 2001, pp 72-75, 2001.
![Figure 2. Box plot, after Tukey [23]](https://thumb-us.123doks.com/thumbv2/123dok_us/11067013.2993303/2.918.505.779.612.696/figure-box-plot-after-tukey.webp)