Washington University in St. Louis
Washington University Open Scholarship
Arts & Sciences Electronic Theses and Dissertations Arts & Sciences
Spring 5-15-2018
Essays in Knowledge Transfer
Leonardo Mayer Kluppel
Washington University in St. Louis
Follow this and additional works at:https://openscholarship.wustl.edu/art_sci_etds Part of theBusiness Administration, Management, and Operations Commons, and the Management Sciences and Quantitative Methods Commons
This Dissertation is brought to you for free and open access by the Arts & Sciences at Washington University Open Scholarship. It has been accepted for inclusion in Arts & Sciences Electronic Theses and Dissertations by an authorized administrator of Washington University Open Scholarship. For more information, please [email protected].
Recommended Citation
Kluppel, Leonardo Mayer, "Essays in Knowledge Transfer" (2018).Arts & Sciences Electronic Theses and Dissertations. 1550.
WASHINGTON UNIVERSITY IN ST. LOUIS
Olin Business School
Dissertation Examination Committee: Anne Marie Knott, Chair
Nicholas S. Argyres Lamar Pierce Michael D. Ryall
Ulya Tsolmon
Essays in Knowledge Transfer by
Leonardo Mayer Kluppel
A dissertation presented to The Graduate School of Washington University in
partial fulfillment of the requirements for the degree
of Doctor of Philosophy
May 2018 St. Louis, Missouri
ii
Table of Contents
List of Figures ... iv List of Tables ... v Acknowledgments... viii Abstract………….. ... x Preface………... 1 Statement of contribution ... 6Chapter 1: Vertical Integration and Information Sharing ... 7
1.1 Introduction ... 7
1.2 Theoretical development ... 11
1.2.1 Transaction cost between suppliers and producers ... 11
1.2.2 Vertical Integration ... 13
1.3 Model ... 16
1.4 Equilibrium ... 18
1.4.1 No vertical integration ... 22
1.4.2 Vertically integrated firms ... 35
1.5 Discussion ... 42
1.6 References ... 44
1.7 Figures and Tables ... 48
Chapter 2: Informational Costs of Integration ... 54
2.1 Introduction ... 55 2.2 Theoretical background ... 59 2.3 Model ... 62 2.3.1 Setup ... 64 2.3.2 Solution – No Integration... 68 2.3.3 Solution – Integration ... 75 2.4 Empirical evidence ... 79 2.5 Results ... 83 2.6 Conclusion ... 88 2.7 References ... 91
iii
Chapter 3: A new direction or lack of direction? The story of innovation with outsider
CEOs ... 110
3.1 Introduction ... 110
3.2 Background and hypotheses development ... 110
3.3 Data and methods ... 114
3.4 Results ... 123
3.5 Robustness Tests ... 125
3.6 Conclusions and implications ... 128
3.7 References ... 132
3.8 Figures and Tables ... 135
Preface references ... 147
Appendix 1: Appendix to Chapter 1 ... 151
A1. Proof that feasibility and stability implies that players cannot appropriate more than their value added ... 151
A2. Generalized bargain solution, no vertical integration... 151
iv
List of Figures
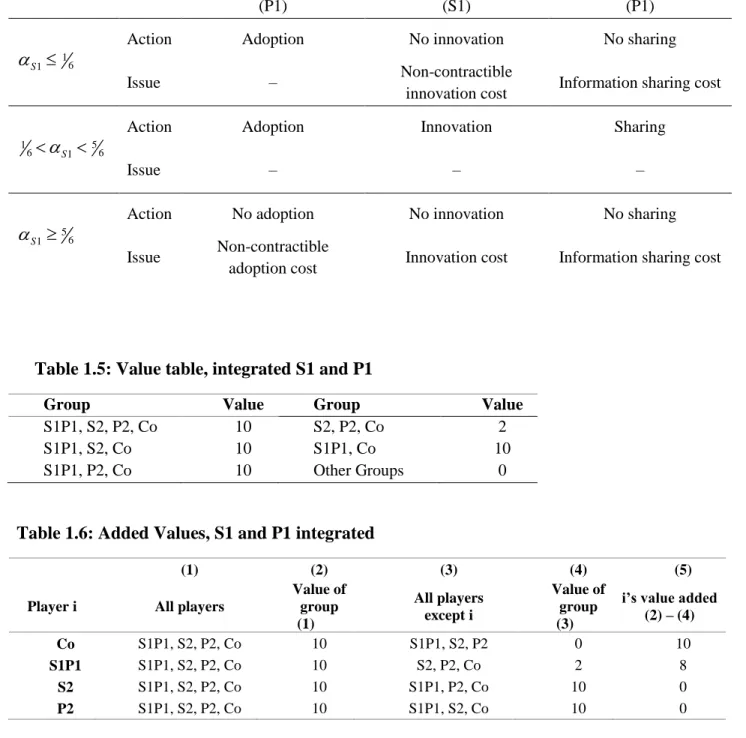
Figure 1.1: Model timing ... 50
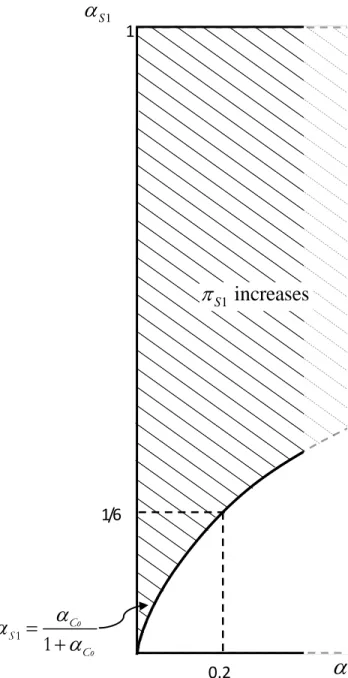
Figure 1.2: Points where S1 is better off with innovation ... 51
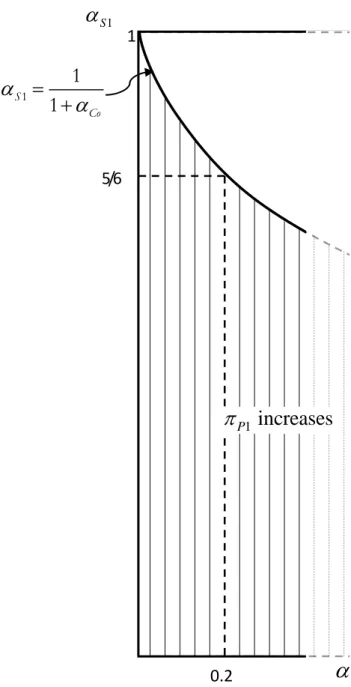
Figure 1.3: Points where P1 is better off with innovation: ... 52
Figure 1.4: Regions with information sharing ... 53
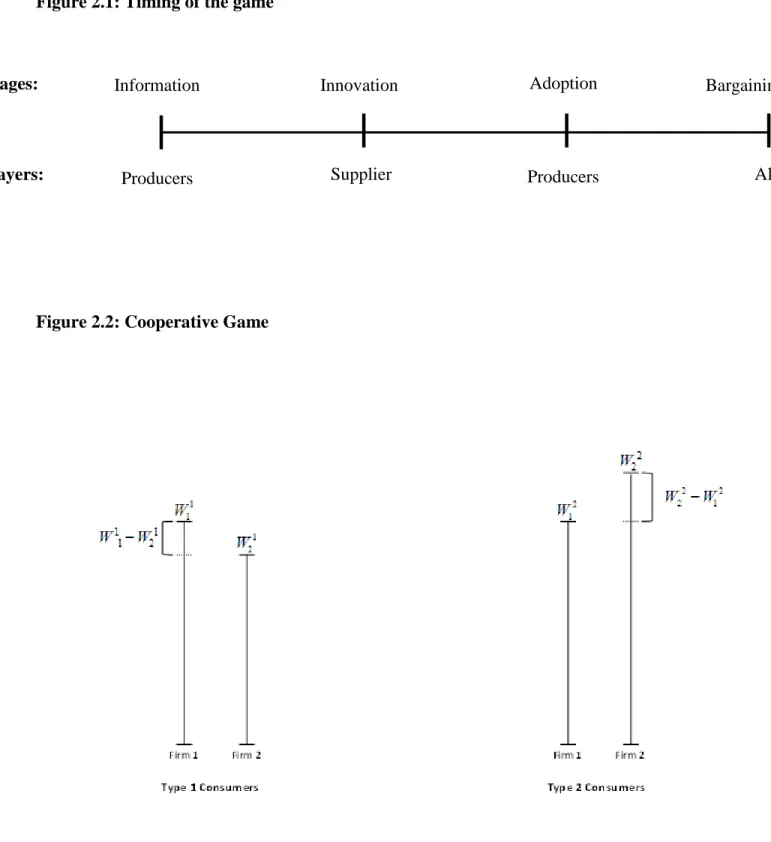
Figure 2.1: Timing of the game ... 95
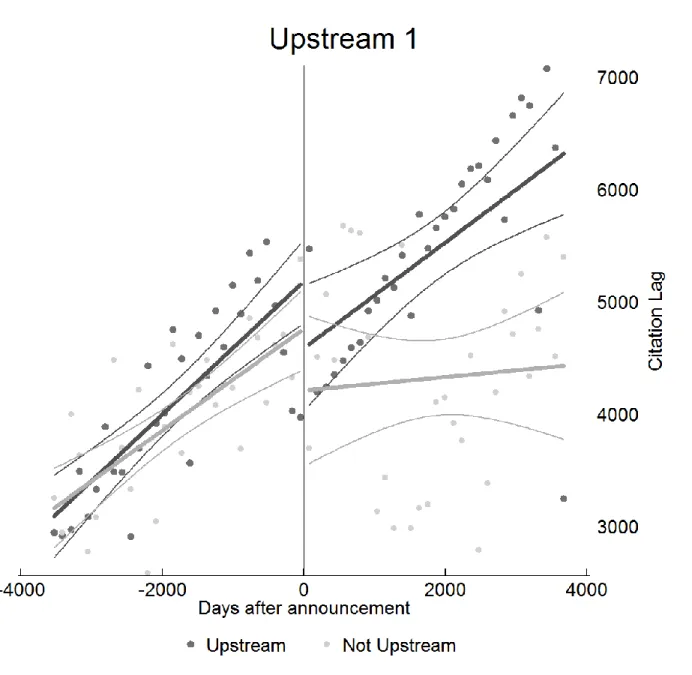
Figure 2.2: Cooperative Game ... 95
Figure 2.3: Producer 2’s information loss on market 2 with integration ... 96
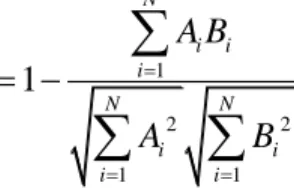
Figure 2.4: Competitor’s patents citation lag ... 97
Figure 2.5: Piecewise linear regression of the citation lag of competitors’ patents ... 99
Figure 2.6: Leads and lags, triple difference. ... 100
Figure 3.1: Change in innovation direction ... 135
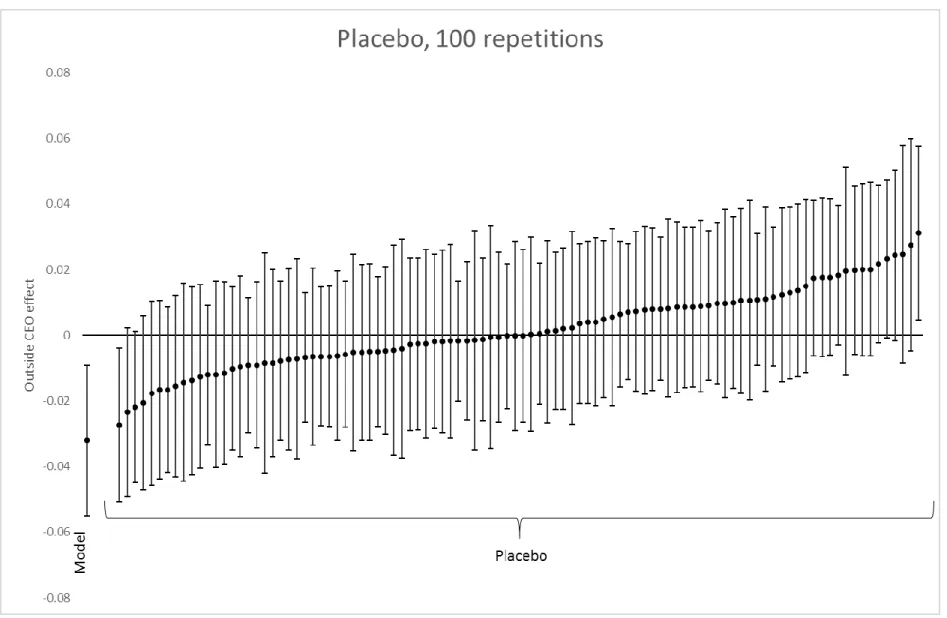
Figure 3.2: Placebo test ... 136
Figure A1.1: Increase in A, low consumer bargaining ability, no integration... 155
Figure A1.2: Beneficiaries of increase in A, medium consumer bargaining ability, no integration ... 158
Figure A1.3: Beneficiaries of increase in A, high consumer bargaining ability, no integration ... 160
Figure A1.4: Willingness to adopt new input, no integration. ... 162
Figure A1.5: Impact of larger A on firms’ payoffs, integration between S1 and P2. ... 171
Figure A1.6: Impact of larger A and B on firms’ payoffs, integration between S1 and P2. ... 172
v
List of Tables
Table 1.1: Product values ... 48
Table 1.2: Value table, no integration ... 48
Table 1.3: Added values ... 48
Table 1.4: No integration equilibrium summary... 49
Table 1.5: Value table, integrated S1 and P1 ... 49
Table 1.6: Added Values, S1 and P1 integrated ... 49
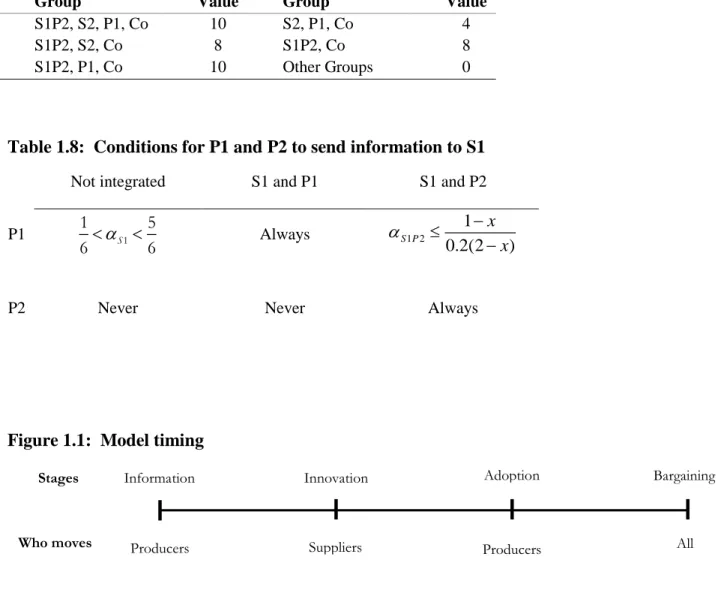
Table 1.7: Value table, integrated S1 and P2 ... 50
Table 1.8: Conditions for P1 and P2 to send information to S1 ... 50
Table 2.1: Summary statistics ... 101
Table 2.2: Effect of acquisition on competitors’ patents citation lag; citing firm is on buyer’s upstream. Regression without controls. ... 101
Table 2.3: Effect of acquisition on competitors’ patents citation lag; citing firm is not on buyer’s upstream. Regression without controls. ... 102
Table 2.4: Effect of acquisition on competitors’ patents citation lag; citing firm is on buyer’s upstream. ... 103
Table 2.5: Effect of acquisition on competitors’ patents citation lag; citing firm is not on buyer’s upstream. ... 104
Table 2.6: Effect of acquisition on competitors’ patents citation lag; triple difference. ... 105
Table 2.7: Effect of acquisition on competitors’ patents citation lag; triple difference. Patent classification fixed effect. ... 106
Table 2.8: Effect of acquisition on competitors’ patents citation lag; triple difference. Firm specific time trends. ... 107
Table 2.9: Time Lag, triple difference, patent classification fixed effect, citations not added by applicants ... 108
vi
Table 2.10: Time Lag, triple difference, patent classification fixed effect, citations
added by applicants ... 109
Table 3.1: Summary statistics ... 137
Table 3.2: Outside CEO decrease change in innovation direction ... 138
Table 3.3: Outside CEO impact on norm and firm uniqueness ... 139
Table 3.4: CEO impact on innovation direction is higher in centralized firms ... 140
Table 3.5: Outside CEO and norm change, centralized firms ... 141
Table 3.6: Outside CEO and distance from industry, centralized firms ... 142
Table 3.7: CEO impact on innovation direction is higher when they come from more distant firms ... 143
Table 3.8: Outside CEO and norm change, previous firm distance,... 144
Table 3.9: Outside CEO and distance from industry, previous firm distance ... 145
Table 3.10: Impact of outside CEO for high and low R&D intensity firms ... 146
Table 3.11: Propensity score matching ... 146
Table A1.1: Product values ... 151
Table A1.2: Value table, no integration ... 152
Table A1.3: Willingness to adopt new input, no integration. ... 161
Table A1.4: Value table, integrated S1and P1 ... 163
Table A1.5: Value table, integrated S1and P2 ... 165
Table A1.6: Impact of larger A on firms’ payoffs, integration between S1 and P2. ... 170
Table A2.1: Summary statistics, full sample ... 173
Table A2.2: Outside CEO decrease change in innovation direction, full sample... 174
Table A2.3: Outside CEO impact on norm and firm uniqueness, full sample ... 175
Table A2.4: CEO impact on innovation direction is higher in centralized firms, full sample ... 176
vii
Table A2.6: Outside CEO and distance from industry, centralized firms, full sample ... 178
Table A2.7: CEO impact on innovation direction is higher when they come from
distant firms, full sample ... 179
Table A2.8: Outside CEO and norm change, previous firm distance, full sample ... 180
Table A2.9: Outside CEO and distance from industry, previous firm distance, full
sample ... 181
Table A2.10: Impact of outside CEO for high and low R&D intensity firms, full
viii
Acknowledgments
This dissertation would not be possible without the direct and indirect support of many people.
First, I would like to thank Anne Marie Knott for her guidance and support. She was key in my
development as a scholar. I want to extend an especial thanks to Lamar Pierce, who helped me
immensely during all my academic journey. I am also indebted to my dissertation committee for
their comments, time, and patience: Nick Argyres, Michael Ryall, and Ulya Tsolmon.
I am grateful for all the knowledge spillovers resulting from being surrounded by great scholars,
in particular the strategy department: Dan Elfenbein, Jackson Nickerson, Phech Colatat, and
Tarek Ghani. Todd Zenger and Adina Sterling also left a lasting impression on my academic
career.
The support from friends is impossible to understate. Special thanks to those that were closer to
me during my PhD: Trey, Sarah, Bala, and Srinidhi. Finally, I need to thank my family. Even
though they have no idea what I am doing, they have always supported me.
Leonardo Mayer Kluppel
Washington University in St. Louis
ix
x
ABSTRACT OF THE DISSERTATION
Essays in Knowledge Transfer
by
Leonardo Mayer Kluppel
Doctor of Philosophy in Business Administration
Washington University in St. Louis, 2018
Professor Anne Marie Knott, Chair
This dissertation advances our understanding of when firms are able to get information from
outside agents and the impact of that information on innovation. In chapter one, I set up a
theoretical model that illuminates how vertical integration changes the incentives for producers
to share information with suppliers. Both transaction costs and bargain ability play major roles in
information sharing. One result from chapter one is that producers share less information with
vertically integrated suppliers. The second chapter tests this prediction, finding robust evidence
that once a supplier vertically integrates, it gains fewer spillovers from competitor producers.
Finally, the last chapter looks at how information brought by an external CEO can change the
firm’s innovation direction. The third chapter finds that external CEOs tend to shift the direction of innovation less often that internal hires.
1
Preface
Knowledge is one of the most critical assets a firm owns. For this reason, it is imperative for
strategy scholars to understand how a firm acquires, produces, and uses knowledge. Knowledge
is especially vital because firms live in dynamic environments that demand the continual
production and use of new knowledge. To create new knowledge, the firm needs to process
information (Nonaka 1994) that is generated both inside and outside its boundaries. The
information generated inside the firm is shared between individuals and groups within the firm in
an environment of shared principles (Kogut and Zander 1992) and language (Monteverde 1995),
where individuals share an identity that fosters collaboration (Kogut and Zander 1996). The
information sharing within the firm allows for finding the solution to complex problems
(Nickerson and Zenger 2004), and is thus vital for firm performance.
The information generated outside the firm does not enjoy the same protective environment.
Transfer of information from an outside agent to the firm is harder to achieve. One reason for
this difficulty is the fundamental problem with information sharing described by Arrow (1974).
The value of information is not known before the information is revealed. However, upon
revelation, the buyer could use the information without payment because information is a
nonrival good. This creates an incentive for the buyer to renege the contract after being exposed
to the information.
The difficulty of getting knowledge from outside agents does not undermine the usefulness of
information transfer. Information transfer is essential for technological innovation and product
2
al. 2010). Thus, firms should be careful when selecting information sources to maximize the
possibility that new knowledge will be created. There are many ways to acquire information
from outside agents, such as supplying firms that contain useful knowledge (Alcácer and Oxley
2014), buying firms with relevant knowledge (Hitt et al. 1991, 1996), hiring experienced
employees (Crossland et al. 2014), physically locating near information sources (Alcácer and
Chung 2007, 2014), occupying the same market as more knowleadgeable firms (Bloom et al.
2013, Knott et al. 2009), learning from investors (Dushnitsky and Lenox 2005, Dushnitsky and
Shaver 2009, Katila et al. 2008), buying R&D from other firms (Knott 2017), engaging in
alliances and joint ventures (Dyer and Hatch 2006, Mowery et al. 1998, 2014, Sampson 2007),
getting information from consumers (von Hippel 2001, Jeppesen and Molin 2003), and third
party connections (Maggie and Wan 2017, Pahnke et al. 2015, Reagans et al. 2015).
This dissertation studies two ways a firm can acquire knowledge from outside agents. The first
two chapters analyze the information a supplier gets from producers. Both chapters look at how
vertical integration changes the incentives for producers to share information with suppliers. The
third chapter focuses on how external CEOs shape the direction of innovation of the firm.
The first chapter advances a theoretical model aimed at explaining how vertical integration
between one producer and one supplier changes the incentives for other producers in the
downstream market to share information with the supplier. To achieve that objective, the chapter
uses a value capture model (Brandenburger and Stuart 1996, 2007, Gans and Ryall 2017,
Lippman and Rumelt 2003, Ryall and MacDonald 2004) to show how producers’ decisions to
share information with suppliers change when there is vertical integration in the market. The
value capture model allows the understanding of how markets’ competitive structures and players’ bargaining abilities shape the willingness for firms to share information.
3
In the model, nonintegrated suppliers will not be able to get all the useful information that
producers have. One reason for the inability of suppliers to extract all information from
producers is the costs to adopt and innovate. Both of these costs are intrinsically hard to contract
upon (Hall and Khan 2003, Howells et al. 2008), opening the door to opportunistic behavior and
creating transaction costs (Williamson 1979). The existence of transaction costs is one factor for
the decrease of information transfer from producer to supplier, but it is not the only one. High
consumer bargaining ability exacerbates the problem created by the inability to contract.
Although the transaction costs inherent to adoption and innovation inhibit the transfer of
information from one producer to the supplier, when the same costs exist between the supplier
and other producers, they help information transfer. Thus, the chapter shows how it is not enough
to look at the transaction costs between two firms to determine information transfer. We need to
account for the transaction costs between all firms to have a complete picture of the situation.
Finally, the first chapter shows that vertical integration eliminates the transaction costs between
the integrated firms, as is common in the transaction costs economics literature (Coase 1937,
Williamson 1991). This allows for the unimpeded flow of information between the integrated
firms. The downside of integration is that, by decreasing transaction costs between a producer
and a supplier, vertical integration decreases the incentives for the other producers to share
information with the integrated supplier.
Chapter two is fundamentally interested in testing the theoretical prediction that vertically
integrated suppliers get less information from the other producers in the market. This is
important since integration trades off more information from one source (the integrated
4
of vertical integration, managers have to understand which producers are the critical sources of
information for future input innovation. Because different managers will likely have different
perceptions about the critical sources of information, this can explain why firms have different
vertical structures (Kapoor 2013, Leiblein and Miller 2003).
To test empirically the hypothesis that integrated suppliers receive less information from other
producers, chapter two uses the citation lag of suppliers’ patents to producers’ patents before and after vertical integration. The idea is that citation lag proxies for the amount of information the
producers makes available to the supplier. The less information the producer offer to a supplier,
the longest it takes for the supplier to find, understand, and use the information contained in the
producer’s patents. The results from chapter two indicate that citations to other producers’ patents made by suppliers’ patents increase by about 200 days on average.
Finally, chapter three looks at how CEOs hired from outside the firm shift the direction of
innovation in their current firm. Besides having a large impact on firm performance (Mackey
2008), the CEO sits at the top of the organizational chart, a privileged position to spot resource
complementarities across all business units and to take care of long-term planning (Chandler
1962, Hambrick 1994). For that reason, the CEO position is uniquely suited for the delineation of
the firm’s innovation direction.
A firm’s innovation path depends heavily on the CEO’s experience, knowledge, and beliefs about the world (Hambrick and Mason 1984). Those characteristics can be impacted by a
multitude of experiences in the life of the CEO, from living through economic depressions
(Malmendier and Nagel 2011) to his/her functional experiences (Crossland et al. 2014). Past
5
that experiences beyond the focal firm and industry can change the CEOs commitment to the
firm’s current strategy (Hambrick et al. 1993), and strategic distinctiveness from the other industry competitors (Crossland et al., 2014). Although those results point to differences in how
external CEOs behave when making long-term decisions about the firm’s overall direction, they
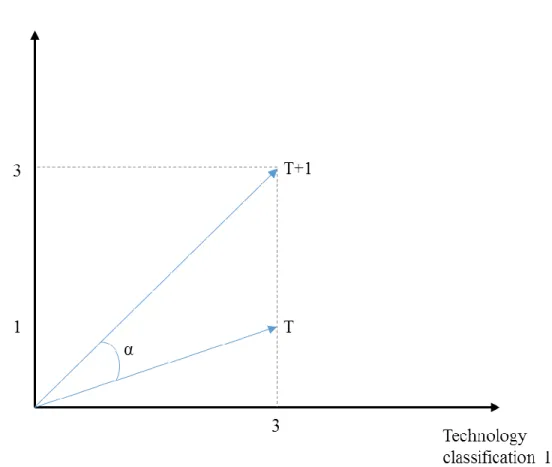
do not answer the question of how external CEOs steer the firm’s innovation. Chapter three tackles this issue by computing the change in the direction of the vector composed of the
technology classification of the firms’ patents.
Chapter three finds that, surprisingly, outside CEOs tend to change innovation direction less than
insiders. Also, this result is stronger for centralized firms with low R&D intensity, where CEOs
should have more control over the direction of innovation. Furthermore, CEOs coming from far
away firms in term of technological vectors have a stronger impact on the direction of
innovation. One possible explanation for those results is that outside CEOs lack the expertise to
change the direction of innovation optimally. Those results are in line with the findings of
Cummings and Knott (2018), who show that firms with outside CEOs respond less to CEO
incentive compensation.
In summary, this dissertation makes inroads in our understanding of when firms are able to get
information from outside agents and the impact of that information on innovation. The first two
chapters are dedicated to the impact of vertical integration on information transfer from
producers to suppliers, while the last chapter looks at how information brought by an external
6
Statement of contribution
The first two chapters of this dissertation are solo-authored, even though they benefited
immensely from comments and suggestions from many colleagues. The third chapter is
co-authored with Trey Cummings. My contributions included formulating the initial question,
gathering and cleaning part of the data, performing the statistical analysis, and writing the
chapter. Trey was fundamental in helping frame the question, gathering the outside CEO data,
7
Chapter 1: Vertical Integration and
Information Sharing
1.1
Introduction
Where should we draw the line delimiting a firm’s boundaries? Few questions in strategy have more theoretical and practical relevance. One of the reasons that lead managers to internalize
transactions that could otherwise be carried over by markets is to facilitate information transfer
between the integrated firms (Demsetz 1988, Grant 1996, Kogut and Zander 1992, 1996,
Nickerson and Zenger 2004). Indeed, empirical evidence suggests that integration increases
knowledge transfer between units and innovation output of the integrated firm (Ahuja and Katila
2001, Cassiman et al. 2005, Makri et al. 2010). Underexplored in the literature is a study of how
vertical integration impacts the integrated firm’s capability to access knowledge produced outside the firm’s boundaries. This chapter address this shortcoming by using a value capture model (Brandenburger and Stuart 1996, 2007, Gans and Ryall 2017, Lippman and Rumelt 2003,
Ryall and MacDonald 2004) to show how producers’ decisions to share information with suppliers change when there is vertical integration in the market. The value capture model allows
the understanding of how markets’ competitive structures and players’ bargaining abilities shape the willingness for firms to share information.
The model focuses on situations where producers have information about how to improve the
input manufactured by suppliers and shows that vertical integration can change how much
information a supplier can extract from producers. This is a fundamental issue, since empirical
8
(Hall et al. 2010), and suppliers, in particular, develop more technological capabilities by selling
to knowledgeable producers (Alcácer and Oxley 2014). Thus, if managers are interested in
improving the input quality over time, they need to fully understand the impact of vertical
integration on their ability to access relevant information.
The model shows that nonintegrated suppliers cannot access all the information possessed by
producers. One reason for the inability of suppliers to extract all information from all producers
is the very characteristics of the costs to adopt new inputs and the costs to innovate. Both of
those costs are intrinsically hard to contract upon, opening the door to opportunistic behavior.
This is expected from a transactions cost economics (TCE) point of view since the lack of
contractibility tends to induce caution when investing. From a pure TCE vantage point, the only
outcomes that will be implemented in a disintegrated market are the outcomes that are ex-post
beneficial to both producer and supplier.
This chapter shows that transaction costs are not the only force mediating information transfer
from producers to suppliers. The bargaining ability of the firms and consumers play a key role in
how much information the supplier expects to receive from producers. Different levels of
bargaining ability result in more or less information sharing even if we maintain constant the
contractibility issues intrinsic to the adoption and innovation costs.
This chapter also argues that it is not enough to consider only the contractibility issues between
the supplier and a producer; we need to consider the costs to write contracts between the supplier
and other producers. This dependency on the transaction cost between the supplier and the other
producers arises because increased competition in the downstream market can enable the
9
want for all producers to adopt the new input in order to increase competitive pressure
downstream. However, the transaction costs between the supplier and other producers limit the
supplier’s ability to achieve mass adoption through contracting with all producers in the downstream. Therefore, keeping the transaction costs between the supplier and a producer fixed,
the existence of widespread transaction costs helps that producer to send out information.
As an example of the effect described above, suppose that producer A is ex-post marginally
better off if it is the only producer to adopt the new input and worst off if it adopts the new input
alongside another producer. Suppose that producer B is marginally worse off if it adopts the
innovation both alone or with another producer. Finally, suppose that the supplier is better off by
having the new input being adopted by one producer, and it is much better off if both producers
adopt the innovation. If we only analyze the situation between producer A and the supplier, we
could conclude that the information will be shared by A, even with the possibility of holdup
caused by the innovation and adoption costs.
However, this conclusion depends on the possibility of the supplier to strike a contract with
producer B. If there is no holdup problem between the supplier and producer B, the supplier
could write a contract promising to compensate B after it adopts the new input. Knowing that,
producer A prefers not to send the information since that would entail innovation by the supplier
and adoption by producer B (via contract). However, if producer B and the supplier suffer from
the same holdup problems as producer A and the supplier, then the supplier could not write such
contract. Without the contract, producer B would not adopt the new input, and thus producer A
10
information available to the supplier depends not only on the transaction costs between A and the
supplier but also on the transaction cost between B and the supplier.
The difficulties faced by Flextronics (Huckman and Pisano 2010) illustrate how vertical
integration can change the incentives of other agents on the market. Flextronics was an OEM cell
phone manufacturer that deals with firms that compete in the final product market, such as
Motorola, Nokia, Kyocera, and Sony-Ericsson, among others. In 2001, Flextronics decided to
integrate cell phone design capabilities. Although Flextronics’ in-house design would be just one
more competitor in the design market, Flextronics’ old customers felt uneasy about sharing information contained in their designs. This threatened Flextronics’ existing business
relationships, suggesting that there is something different about vertical integration versus simply
supplying competitors.
Besides highlighting the importance of competitors’ transaction costs in the decision to share information, the chapter helps explain why some industries have firms with different levels of
vertical integration (Argyres and Bigelow 2010, Helfat and Campo-Rembado 2016, Kapoor
2013, Kapoor and Adner 2012). Vertical integration gives more access to the integrated producer
because it solves the opportunism threat between the integrated parties, but it can come at a cost
in information from other producers. In the example above, producer A stops sending
information to the supplier after the transaction cost between the supplier and producer B
disappears (vertical integration is a possible cause of the decrease in transaction cost between the
supplier and producer B). Thus, when considering integration, the manager has to predict which
producers contain relevant information to the supplier due to the informational tradeoff
11
have different priors and access different signals. Those different predictions will lead to
different prescriptions in terms of vertical integration.
The use of a value capture model also highlights that the decision for players to share
information depends crucially on the bargaining ability of the players involved in the game. This
is made possible thanks to the use of biform games (Brandenburger and Stuart 2007) as the
modeling tool. Biform games allow us to separate the impact of firms’ capabilities from the
effect of managers’ ability to extract value from pure bargaining situations. This can potentially be used to inform a more micro theory of information sharing and vertical integration since we
know that the managers’ cultural background can influence their ability to extract value in bargaining situations (Henrich 2000, Henrich et al. 2005, Hoffman et al. 1996).
1.2 Theoretical development
1.2.1 Transaction cost between suppliers and producers
This section shows important particularities of innovation and adoption caused by information
sent by producers to suppliers. It delineates which intrinsic transaction costs between suppliers
and producers are taken into consideration in this chapter and what causes them. Although the
process of innovation and adoption is riddled with transaction costs, it does not mean that the
only way to solve that problem is through vertical integration. Relational contracts are pointed to
in the literature as a remedy that helps alleviate exchange hazards (Dyer and Singh 1998,
Elfenbein and Zenger 2013, Greif 1993).
To see how a supplier is impacted by the ability of other producers to write a contract, we need
to recognize the particularities of innovation caused by information sharing from producers.
12
develop and efficiently produce the updated input that crystalizes the information. However,
R&D is riddled with information asymmetries, making it hard for producers to write a contract
with suppliers to undertake the investment. Evidence of the difficulty in contracting R&D with
another firm is the lack of productivity of outsourced R&D (Knott 2017). Further evidence is a
survey of research-based pharmaceutical companies operating in the United Kingdom conducted
by Howells, Gagliardi, and Malik (2008) showing that the main concern of external innovation
sourcing is the “Confidence in the contractor/partner’s ability to deliver a relevant solution.” This difficulty in contracting naturally imposes constraints on how often suppliers will innovate, and
thus how often producers will share information with suppliers.
After suppliers innovate and make the new input available, producers have to invest in the
adoption of the new input in their production line. Here again, we have a noncontractible cost,1 since adoption costs are specific to the producer. As Hall and Kahn (2003) argue:
The [adoption] costs, especially those of the non-pecuniary “learning” type, are typically incurred at the time of adoption and cannot be recovered. There may be an ongoing fee for using some types of new technology, but typically it is much less than the full initial cost. That is, ex-ante, a potential adopter weighs the fixed costs of adoption against the benefits he expects, but ex-post, these fixed costs are irrelevant because a great part of them have been sunk and cannot be recovered.
The noncontractibility of adoption costs together with the noncontractibility of the innovation
cost limits the likelihood that a disintegrated supplier will see full disclosure of information from
producers. Although disintegrated suppliers can experience decreases in information sharing
depending on the bargaining ability of players, integration can change that. Integration solves the
1 The noncontractibility of adoption costs is also present as an assumption in economic models, see Antras (2005) for one example.
13
transaction cost problem because they have special mechanisms to prevent opportunistic
behavior, such as authority (Coase 1937, Williamson 1991) and social identity (Kogut and
Zander 1992, 1996). The supplier can have access to all information from the integrated
producer, independently of bargaining ability. However, by doing so, the integrated supplier
decreases the incentives for other producers to share information with it. Without the transaction
cost, the integrated firm has the ability to adopt the innovation on the integrated producer’s final
good, and thus extract more value via the integrated supplier. This gives the other producers less
incentive to share information, avoiding the increase in competition caused by the wider
adoption.
1.2.2 Vertical Integration
There are three main theories in strategy designed to explain when firms should vertically
integrate. One of them is known as transaction cost economics (TCE), since it derives predictions
by analyzing each transaction separately to determine if they should be internalized within the
firm (Williamson 1975, 1985). Most of the TCE literature relies on firms’ inability to design a
complete contract in an uncertain environment. Some attributes of transactions, such as the need
for firm-specific investments, open the possibility for one of the parts to act opportunistically
after a contract is signed. Since it is impossible to prevent opportunistic behavior due to contract
incompleteness, firms can be better off internalizing the transaction. Hierarchies solve the
transaction problem because they have special mechanisms to prevent opportunistic behavior,
such as authority (Coase 1937, Williamson 1991) and social identity (Kogut and Zander 1992,
1996). Although TCE provides a theoretical explanation for vertical integration, it is likely not a
complete theory, as noted by Leiblein and Miller (2003). They point out that TCE predicts
14
characteristics. In reality, however, we observe considerable variance in vertical integration
among similar firms (Kapoor 2013, Leiblein and Miller 2003).
The TCE literature has, however, recognized the impact of other firms in the determination of
the optimal vertical structure. Due to scale economies, outside suppliers are able to economize in
cost if they can aggregate the demand of other firms in the market (Riordan and Williamson
1985). However, this is only true if the input sold by the supplier is not specific to a particular
firm. Thus, production costs are not independent of asset specificity. Empirical evidence
supports this theory, showing that firms that had integrated transactions after the emergence of a
dominant design (so that inputs have lower firm specificity) tend to exit the market (Argyres and
Bigelow 2007). Also, increase modularization of technologies is associated with vertical
specialization (Argyres and Bigelow 2010). In this literature, the connection between vertical
integration and other firms in the market is through economies of scale. The model in this
chapter features no economies of scale. Furthermore, this chapter focuses on the impact of
vertical integration on the supplier’s ability to access informational spillovers. The critical object
here is the producer’s decision to share information given the firm’s capabilities, bargaining abilities, and vertical structure.
One way to explain the heterogeneity in the vertical structure between similar firms is through
the resource-based view (RBV). RBV poses that firms are heterogeneous regarding resources
and capabilities (Wernerfelt 1984) and that some of those resources and capabilities are hard to
imitate or acquire (Barney 1991, Rivkin 2000). In this view, firms integrate to take advantage of
unique characteristics such as excess capacity in resources (Penrose 1959) or a unique bundle of
15
explain firm heterogeneity in vertical structure, it is not particularly well equipped to explain
changes in vertical integration over time within an industry. One example of a change in firms’ structure during industry evolution is the evidence that nascent industries tend to be more
vertically integrated than more mature industries (Helfat and Campo-Rembado 2016, Klepper
1997).
Besides TCE and RBV, the knowledge-based view (KBV) is another paradigm meant to explain
firm boundaries. Although the KBV is less developed than the other two points of view, it has
made headway in explaining the vertical structure of a firm. The KBV focuses on the integration,
generation and flow of knowledge in a firm (Grant 1996, Kogut and Zander 1992, 1996, Zenger
et al. 2011). KBV highlights the fact that information is a key component in drawing the
boundaries of the firm. Some theories in the KBV tradition focus on how the problems are
chosen to be solved by managers (Nickerson and Zenger 2004). Problems that can be
decomposed into modular parts are better solved by the market, while complex problems are
more suited to be solved by a hierarchy. Since managers have different worldviews, it is natural
that they choose to solve different problems, and therefore create firm heterogeneity. Another
explanation rooted in the KBV tradition is the role of integrative capabilities (Helfat and
Campo-Rembado 2016). From this perspective, integration is costly, but integrated firms are better at
systematic innovation. The implication is that firms should integrate depending on how much
systematic innovation they expect to happen. The decision to integrate also depends on
managers’ expectations about the future and thus can explain firm heterogeneity. Helfat and Campo-Rembado can also explain dynamics if we imagine that managers’ beliefs within an
16
however, do not usually take into consideration the impact of competitors on information
exchange between vertically linked units.
Although those theories cover a broad spectrum, they fail in understanding how information
transfer from producers to suppliers will be impacted by vertical integration. The producer’s decision to share information with a supplier depends not only on the contracting hazards
between that producer and the supplier but also on the contracting hazards between the supplier
and all producers. The impact of competing firms’ contracting hazards on information sharing is
not caused only by economies of scale, but also by the supplier’s desire to encourage widespread adoption of a new input through contracting. Furthermore, the theories of vertical integration do
not study how the agent’s bargaining ability influence information sharing.
Next, the chapter introduces the model assumptions. After that, the model is solved for markets
with no vertical integration and then for markets with vertical integration.
1.3 Model
The model presented here helps us understand how vertical integration changes the incentives for
producers to share information with suppliers. The model uses cooperative games
(Brandenburger and Stuart 1996, 2007, Gans and Ryall 2017) to look at how much value each
firm expects to gain when producers share information with suppliers. Differences in vertical
integration change how much information all producers want to relay to suppliers.
For each market, there are five players: two suppliers (S1 and S2), two producers (P1 and P2),
and one consumer (Co). Producers combine the input bought from one of the suppliers with one
17
input from firm Si with the input from firm Pj is referred to as the final product FPi j, . Since
this model focuses on information exchange and not on efficiency gains, it assumes that both
suppliers and producers have no production cost so that the total value creation depends only on
the consumer valuation of the final product. To generate positive value, a group of players needs
to contain at least the consumer and two firms: one producer and one supplier.
The choice of using only one consumer makes this model more suitable to analysis characterized
by a winner-takes-all2 market. Examples of instances are VHS, Blu-ray, and Microsoft Office, among others. The assumption of winner-takes-all also has seen implementation in the
economics and politics literature (Frank and Cook 1996, Kamien and Schwartz 1974, Sah and
Stiglitz 1987).
Before firms start to manufacture the inputs, producers P1 and P2 obtain some information that
can be used to improve the input provided by suppliers S1 and S2. That information arises from a
better understanding of the final consumer’s needs or from an insight gained while assembling
inputs into the final product. The existence of useful information from the producer to the
supplier is consistent with the fact that some producers expand their information set to intersect
with knowledge areas belonging to the supplier (Brusoni et al. 2001, Kapoor and Adner 2012,
Takeishi 2002). Besides the evidence that producers have knowledge in areas pertinent to
suppliers, Alcacer and Oxley (2014) show that suppliers learn from supplying to more and better
producers, suggesting that suppliers do make use of knowledge from producers. Together, those
papers demonstrate that producers usually have information that is useful to suppliers.
2 Some models of winner-takes-all depend on the existence of network externalities and the network characteristics (Lee et al. 2006, Lee Jeho et al. 2015).
18
Timeline. There are four stages in this game, as shown in Figure 1.1. In the informational stage,
both producers decide whether to share the input enhancing information with the suppliers. Each
producer decides to share information with each supplier individually. In the innovation stage,
suppliers S1 and S2 observe the information sent and decide if they want to produce a new input
using the information. If they decide to use the information, they invest in R&D to manufacture
an improved input that incorporates the information sent. If no producer decides to send
information, the supplier has no alternative but to offer the old input, without quality
enhancements.
The third stage is the technology adoption. At this point, producers are aware of the selection of
inputs made available by the suppliers and decide if they want to adopt the new input. If
producers decide to buy the high-quality input, they need to pay an adoption cost to be able to
use the new input on the production line. If they do not pay the adoption cost, their final products
do not get the benefits from using the improved input.
Finally, in the bargaining stage, producers buy the input, manufacture the final product and sell it
to the consumer. All players engage in a bargain to decide the allocation of created rents.
Valuation. Since the final product is composed of parts created by the supplier and the producer,
consumer valuation will vary depending on which firm sold the input and what producer created
the final product.
1.4 Equilibrium
To understand how competition influences the incentive for producers to share information with
suppliers, we need to characterize the equilibrium value distribution for each of the five players.
19
capabilities of the firms in the market as well as consumers’ characteristics. Competition is a powerful force, putting limits on how much each player is expected to appropriate, but it does
not generally pin down the equilibrium. The second force determining the equilibrium is the
bargaining ability of each player.
Competition imposes two conditions on the value distribution: feasibility and stability (Gans and
Ryall 2017, Ryall and MacDonald 2004). Feasibility requires that the sum of values distributed
to players be no higher than the total value created. Stability means that, given the value
distribution, there is no subset of players that can do better when they break from the main
coalition and bargain by themselves. Those conditions guarantee that no player will be able to
deviate from the proposed distribution of values.
More formally3, define G to be any subset of players from the set 1, 2, 1, 2, N
S S P P Co
. When the set of players G comes together, they can generate a maximum value of vG. This value vG isthe fruit of the capabilities and needs of each player in the set considered. To illustrate the
feasibility and stability requirements, it is useful to go over an illustration. Suppose that we have
a ticket scalper with a ticket. The ticket scalper gives zero value to the ticket, and so the value
generated by the ticket scalper alone is zero. Assume that the buyer, ticketless, arrive and has a
maximum value of $5 for the ticket. When the buyer is alone, she also produces zero value.
However, when the buyer and the ticket scalper are together, they can generate a total value of
$5. Therefore, we expect to see the buyer and the scalper get together and generate $5 rather than
both stay alone and generate zero each. If we assume that the addition of a player does not
decrease the value generated, as is the case in the model in this chapter, it is sensible to assume
20
that all players get together to generate the most value possible, so that the equilibrium should
feature vG, the value produced when all players are in the coalition. This is the first thing we can
say about the equilibrium of the bargaining.
We are also interested in knowing something about how much each of the players will
appropriate from this encounter. Although both players can generate $5 when they are together,
this does not imply anything about how much each player will appropriate from the $5. To
understand that, we need to introduce a notation for how much each player gets in each of the
possible coalitions. We do that by defining a function that assigns the value appropriated i for each player i. In the ticket scalper example, we could say that when the players are together, the
ticket scalper gets $3 and the buyer gets $2. Notice that not all possibilities for the function i are credible. If we want to analyze value distributions that are likely to happen in reality, we can
safely disregard distributions that are not feasible. Formally, we say that our prediction i should satisfy feasibility (14.1). This is the second thing we can say about the equilibrium.
i N i N v
(14.1)However, feasibility is not the only feature of predicted value distributions. After all, a
distribution of -$2 for the scalper and $7 for the buyer adds up to $5, and thus it is feasible. We
do not expect the scalper to pay $2 and give the ticket to the buyer because she can leave the
negotiation and get zero instead. In the scalper-buyer case, we do not expect that any of the
players get less than zero since they always have the option to walk away from the deal. This
property can be generalized with the addition of more players. Suppose that another scalper
21
gets zero by herself, we require that any equilibrium attributes to all players at least zero.
However, we also need to consider more possibilities. If a distribution gives less than $10 for the
combined value appropriated by the buyer and the scalper with the front row ticket, they have an
incentive to break from the group and negotiate alone. By breaking from the group, they can
make at least one person strictly better off. More generally, if i is the equilibrium, there should be no subgroup that would do better by breaking from the main group. This new condition is
called stability (14.2), since it requires that the equilibrium be stable when we consider all the
other possible subgroups. This is the final condition competition will impose in the equilibrium.
for all G i G i G v N
(14.2)The set of all distributions that satisfy both feasibility (14.1) and stability (14.2) is named the
core. The core for each player is usually a closed interval, not a point. To make a more precise
prediction about all players’ payoff, we need to introduce another concept: players’ bargaining ability. Each player’s bargaining ability indicates how much value the player expects to obtain
given the bounds imposed by feasibility and stability. A player with high bargaining ability
expects to appropriate nearly all value available to her given the bounds imposed by competition.
Brandenburger and Stuart (2007) introduce the confidence index to capture the bargaining ability
idea, that is, that players have different expectations about how much value each player can
appropriate in a pure bargaining situation.
Formally, the confidence index for player i is a number i between 0 and 1. The higher the i, the more certain player i is to appropriate the upper bound of the equilibrium interval of
22
appropriable rents. Let i and i be the upper and lower limits of the equilibrium rents in player i’s core. Then, the expected rents for player i are calculated by i i i(1i).
After finding the expected value appropriated by each player, the game will be solved by
backward induction, calculating players’ optimal decisions at the adoption, innovation, and
information stages.
Next, this chapter will describe the equilibrium when no firm is vertically integrated. Then it will
solve the model for integration between S1 and P1. The final analysis will be concerned with the
integration between firms S1 and P2.
The derivation of the generalized model is in the Appendix 1, but it is valuable to go over an
example. This example will be used in the rest of the chapter. Suppose that the consumer values
the different final products according to Table 1.1.
1.4.1
No vertical integration
Given how much the consumer values each final good, we can calculate the value created when
each group of players gets together. Table 1.2 shows the value created by all possible groups of
players when S1, S2, P1, and P2 are separate firms.
Bargaining. To find the equilibrium in the bargaining phase, we need to calculate the core given
the value created by all possible groups. That is, we need to characterize all allocations of value
that satisfy feasibility (14.1) and stability (14.2). From the previous discussion, we know that the
equilibrium will feature all players 1, 2, 1, 2, N
S S P P Co
, and will produce 10. This means that the consumer will buy a final product composed by the input from S1 and the input from P1.23
Before proceeding, it is useful to define one more object: added value. Each player’s added value
is how much the player brings to the table. To calculate player i s' added value, we consider the
difference in value created by all players minus the value created by all players except player i.
Value added is then a measure of how much value player i adds to the game. It can be shown
that feasibility and stability together imply that no player can get more than its added value4 (Brandenburger and Stuart 1996). The added value of each player in the example above is shown
in Table 1.3.
Since no player can obtain more than its added value, all equilibrium i have to satisfy conditions (14.3). 1 1 2 2 6 2 10 , 0 S P Co S P (14.3)
Stability requires that we take into consideration all possible coalitions. The first possibility is a
collation of one player. The one player coalitions impose the conditions that i 0 for all i, since all players can get zero by themselves. Next, we need to consider all coalitions composed
of two players. Since no coalition of two players can generate positive value, this condition
imposes that i j 0. Next, consider all coalitions of three players. There are 60 coalitions, but we do not need to worry with all of them. Any coalition that does not include a supplier, a
producer, and the consumer will generate zero value. The relevant three-player coalitions impose
the restrictions depicted in (14.4).
24
1 1
1 2
2 1
2 2
10 (value generated by S1,P1,Co) 8 (value generated by S1,P2,Co) 4 (value generated by S2,P1,Co) 2 (value generated by S2,P2,Co)
S P Co S P Co S P Co S P Co (14.4)
Next, we need to consider all coalitions with four players. The relevant conditions are shown in
(14.5).
1 1 2
1 1 2
1 2 2
2 1 2
10 (value generated by S1,P1,P2,Co) 10 (value generated by S1,P1,S2,Co) 8 (value generated by S1,P2,S2,Co) 4 (value generated by S2,P1,P2,C S P P Co S P S Co S P S Co S P P Co o) (14.5)
Finally, stability requires that the coalition of all players distribute at least 10, that is (14.6).
1 1 2 2 10
S P S P Co
(14.6)
The first conclusion from (14.6) and feasibility is that S1 P1 S2 P2 Co 10. Next, we can deduce that S2, P2 0 by (14.3) and that i 0 for all i. Substituting S2, P2 0 on (14.4) we obtain (14.7). 1 1 1 1 10 8 4 2 S P Co S Co P Co Co (14.7)
Direct substitution of S2, P2 0 on (14.5) gives us (14.8), which were already covered by (14.7).
25 1 1 1 1 10 8 4 S P Co S Co P Co (14.8)
Also, players’ added value calculated in Table 3 is the smallest upper limit possible. To see that, consider the distributions shown in (14.9). They all belong to the core, and on each of them, one
of the players is achieving their added value.
1 1 2 2 1 1 2 2 1 1 1 2 2 1 10, 0 ( ' added value) 4, 6, 0 ( 1' added value) 8, 2, 0 ( 1' added value) Co S P S P Co Co S P S P S Co P S S P P Co s S s P s (14.9)
Some restrictions are redundant. Reducing the set of restrictions to the essential restrictions gives us (14.10). 1 1 1 1 2 2 10 8 6 4 2 2 10 , 0 S P Co Co S Co P Co S P (14.10)
All the conditions shown above are driven by the structure of competition on the market, i.e., the
value generated by all possible coalitions. Note that feasibility and stability are capable of
establishing a point prediction for S2 and P2 only; all other players have a range of possibilities.
Competition by itself can determine that the consumer appropriate at least 2 and at most 10, but
cannot pin down the exact number.
Given the consumer confidence index, we can determine how much of the rents are expected to
26
appropriated by the consumer is Co 10Co2 (1Co), since the consumer’s core is between 2 and 10. If, for example, we suppose that the consumer has confidence index Co 0.2 her expected payoff will be equal to Co 3.6. The chapter will maintain the value Co 0.2 until the end of the analysis.
To completely describe the equilibrium, we need to take into consideration the other players’
confidence index. One way to do that is by assigning a confidence index for each firm in the
same fashion as the confidence index assigned to the consumer, that is, chose an exogenous
number between 0 and 1. In this case, the confidence indices would be independent of each
other, and there would be no guarantee that the sum of the equilibrium value of all players adds
up to a feasible outcome.5 This is a valid route, but it is not what this chapter does.
This chapter only considers confidence indices for S1 and P1 that are consistent, that is, that
leads to a value distribution that is ex-post feasible. If the confidence indices are consistent, then
the sum of each player’s expected value is equal to the total value generated by all players. The corollary of this requirement is that confidence indices for S1 and P1 are linked – a high
confidence index for S1 implies a low confidence index for P1. By setting up the confidence
indices in this way, the model assumes that changes in the bargaining ability of firms do not
change the amount appropriated by the consumer and thus focuses on the bargaining tensions
between firms instead of bargaining tensions between firms and consumers. Formally, let S1be the confidence index for S1 and P1be the confidence index for P1. The consistency condition in
5 For example, this approach allows all players to believe that they would appropriate all of the rents available to them (i.e., confidence index equal to 1). In this case, the consumer, S,1 and P1 would believe that they would get 10, 6 and 2, respectively. This distribution is obviously untenable ex post.
27
the example means that the sum of S1 P1 Co has to be 10. Adding this restriction results in
1 (1 1) P S , as shown in (14.11). 1 1 1 1 1 1 1 1 1 1 1 1 1 1 (8 )(1 ) 6 (4 )(1 ) 2 10 ( ) 2( ) 12 10 (2 )( ) 2 (1 ) S P Co Co S S Co P P Co S P Co S P Co S P Co P S (14.11)
The confidence index for firm P1 will be P1 1 S1 as long as Co 4. This is because if 4
Co
, then 4 Co 0 and the core for P1 will go from 4 Co P1 2 to 0 P1 2. For the derivation of the full model, please see the Appendix. Substituting the confidence indices in
our example gives us the equilibrium payoffs shown in (14.12).
1 1 1 1 1 1 2 2 6 4.4 (1 ) 2 (1 ) 0.4 3.6 0 S S S P S S Co S P (14.12)
The zero value captured by firms S2 and P2 does not necessarily mean that those firms are
actually producing in the market. Those firms can be out of the market, and the values associated
with their presence is a mere reflection of the possible value they would generate had they
decided to enter the market. The value table needs to consider all the credible entrants even if in
equilibrium they decide not to enter the market.
Although the only product FP1,1 is produced, the amount of value appropriated by firms does not
28
This makes sense, since increments of FP1,2 (FP2,1) strengthen the bargaining position for firm
S1 (P1).
Who wants innovation? Given the equilibrium above, we can ask which products each player
wants to improve. For now, suppose that the product created by S1 and P1 (FP1,1) increases its
value from 10 to 11. Let ˆi represent the new equilibrium value for player i. In this case, the new equilibrium distribution6 of values is shown on (14.13).
1 1 1 1 1 1 2 2 ˆ 7 4.2 (1 ) ˆ 3(1 ) 0.2 ˆ 3.8 ˆ ˆ 0 S S S P S S Co S P (14.13)
Note that the new equilibrium is always better for the consumer, but this is not always the case
for S1 and P1. Supplier S1 prefers the new equilibrium only when S1 1/6, as demonstrated by
(14.14). 1 1 1 1 1 1 1 1 1 ˆ 7 4.2 (1 ) 6 4.4 (1 ) 0.2(1 ) 1 6 S S S S S S S S S (14.14)
Likewise, producer P1 prefers the higher value FP1,1 when
5
1 /6
S . If the confidence index
1
S
is between 1/ and 6 5/ , both P1 and S1 will be better off with the higher quality product. If 6
29
the bargaining ability is too skewed towards either the supplier or the producer, one of the firms
would have preferred no product enhancement at all.
The cutoffs 1/ and 6 5
6
/ depend on the value of Co. More generally, we substitute
10 2 (1 )
Co Co Co
into the equilibrium values for S1 and P1 to get (14.15) and (14.16).
1 1 1 1 1 1 1 1 (8 [10 2(1 )])(1 ) 6 (6 8 )(1 ) 6 6 8 8 Co S Co Co S S S Co S S S Co Co S (14.15) 1 1 1 1 1 1 1 1 (4 [10 2(1 )]) 2(1 ) (2 8 ) 2 2 2 8 Co P Co Co S S P Co S S P Co S (14.16)
We can now replace ˆ Co 11Co2 (1Co) in the equilibrium to derive S1 and P1’s equilibrium values with a better FP1,1. This substitution yields ˆS1 6 9CoS19 Co S1 and
1 1 1
ˆP 3 S 9 Co S
. Then, S1 prefers the improved product if condition (14.17) is met.
1 1 1 1 1 1 1 1 ˆ 6 9 9 6 8 8 0 1 S S Co S Co S Co Co S Co S Co S Co S Co (14.17)
30
Figure 1.2 shows all the combinations of Co and S1 where (14.17) is true, that is, all the points where S1 is better off with higher quality FP1,1. The figure is cropped because we know
that this equilibrium is valid only if Co4, as discussed previously.
We can calculate when P1 is better off with an enhanced FP1,1 in the same fashion. By
comparing ˆP1 with P1, we can see that P1 is better off with higher quality FP1,1 when
S1 11 Co . Figure 1.3 represents this result in the confidence index space.
Finally, Figure 1.4 combines Figure 1.2 and Figure 1.3. The important issue for the discussion
here is that as the consumer appropriates more (that is, as Coincreases), the interval of S1 that sustains information transfer decreases.
It is important to notice that the efficient outcome is to have a producer manufacture the best
final products possible. Therefore, efficiency will be achieved only when both P1 and P2 send all
useful information7 they have to improve the input provided by S1.
Adoption. Now that we know how innovation on inputs influences value appropriation by firms,
we can ask in what condition would producers be willing to adopt the new input, if available. To
use a new input to manufacture the final product, the producer has to pay a cost to adapt the
production line to process the new input.
The cost incurred in the adaptation process has two special properties. First, the producer has no
experience with the improved input, since the input is new. The literature in learn by doing
shows that the cost curve tends to fall over time after the introduction of a new product (e.g.,
31
Levitt et al. 2013), suggesting that there are inefficiencies and costs associated with introducing
new products in the production line. This lack of experience with the new input means that it is
very hard to estimate how much it costs to fix all issues on the production line once a new input
is introduced.
Second, adoption cost is effectively sunk and nonredeployable (Hall and Khan 2003), raising
contracting problems caused by the potential of holdup (Williamson 1979). Once a firm invest
resources to learn how to process the new input optimally, it is hard to sell this capability to other
firms. Some of the knowledge required to adjust the production line to the new inputs will be
tacit (Conner and Prahalad 1996), while some of the know-how required to efficiently process
the new input is specific to the bundle of capabilities and routines of a particular firm.
Even if the prerequisite knowledge for a successful adoption were not tacit and completely
modular between firms, there is still a last barrier for a firm to sell this knowledge to other firms.
Information is known for having an intrinsic contractability problem (Arrow 1962), since the
value of information is not known before the knowledge is revealed. However, upon revelation,
the buyer could use the information because it is a nonrival good. This creates an incentive for
the buyer to renege the contract after being exposed to the information. For those reasons, this
chapter assumes that the supplier cannot write a contract to pa