Article
Analyzing the Effect of Corporate Environmental
Performance on Corporate Financial Performance
in Developed and Developing Countries
Sergio Manrique1 ID and Carmen-Pilar Martí-Ballester1,2,* ID
1 Business Department, Universitat Autònoma de Barcelona, 08193 Cerdanyola del Vallès, Spain; [email protected]
2 Business School, University of Edinburgh, Edinburgh EH8 9YL, UK * Correspondence: [email protected]; Tel.: +34-93-581-4425 Received: 11 July 2017; Accepted: 16 October 2017; Published: 27 October 2017
Abstract:The relationship between corporate environmental performance and corporate financial
performance has been extensively studied in developed countries, and has received less attention in developing countries. For this reason, the main objective of this paper is to examine the effect of corporate environmental performance on corporate financial performance during a global financial crisis, depending on the economic development level of the country where a firm is located. To this end, we obtain data for a sample of 2982 large firms from 2008 to 2015. We apply Petersen’s approach to these data, adjusting the standard errors for clustering by both firm and year. The results obtained show that the adoption of environmental practices significantly and positively affects the corporate financial performance in developed and developing countries. However, this effect is stronger for firms located in developing countries than those located in developed countries.
Keywords: corporate environmental performance; corporate financial performance; developing
countries; developed countries; panel data
1. Introduction
The primary goal of any for-profit firm is to maximize the value of its shareholders or owners, achieving profitability through its business activity, by producing and/or selling goods or services to consumers [1]. However, firms do have other objectives and duties [2], as they interact at and are part of a social, economic and political context, given the location of facilities and the markets served by the firm; it implies dealing with the needs and interests of different stakeholders, both internal (e.g., employees and owners) and external (e.g., suppliers, customers and communities). Nowadays, doing business is not limited to producing and selling products to customers, and firms must take care of stakeholders’ interests. The business model followed by a firm must include aspects that compose a current relevant business process usually known as Corporate Social Responsibility (CSR), as important as any other business process such as operations, finances or sales [3]. CSR can be seen as a duty than only implies costs and efforts for firms (neoclassical view), without any reward or benefit for business [1], but it can also be seen as a business engine or tool to make profits and improve firms’ performance, as stated in the stakeholders view [2] or natural resources view [4]. The environmental dimension of CSR became especially important after Rio Declaration on Environment and Development [5], which promoted sustainable development as a society priority around the world for governments, firms and individuals. Business activity generates pollution and waste that can damage natural systems, causing irreversible harms, which reduce environmental resources available to society [6]. Firms must take care of preventing and reducing their environmental impact through corporate environmental practices, which also have an impact on firms’ financial
performance, as previously studied by [7] or [8], among others; this relationship is the topic of interest in the present research.
The minimization of the environmental damages caused by business activity and the protection of the natural environment are signals of firms’ environmental performance, and have received increasing attention from society, which require firms to reduce their negative impact on environment, contributing to sustainable development [9]. Thereby, firms are expected to decrease and control the consumption of natural resources and energy, and to reduce or eliminate the production of waste and pollutants during and after the production process; firms can also develop new environmentally friendly products that minimize their ecological footprint [7]. The environmental behavior and performance of firms are given by the implementation of environmental practices, such as the mentioned above, and it is a concern for firms around the world, in both developed and developing countries. However, carrying out these environmental practices could be more complex in developing countries [10] given that their social, economic, cultural and political dynamics differ from those of developed countries [11]. Consequently, the adoption of environmental practices could affect differently the financial performance of firms located in developed and developing countries, adding a new explanatory factor to the relationship between corporate environmental performance (CEP) and corporate financial performance (CFP), which has been a topic intensely researched in the last decades.
For this reason, we revisit the study of CEP-CFP relationship, introducing a newfangled relevant aspect: the level of economic development of the country where the firm develops its business activities, according to the groups composition [12] of the World Economic Outlook, that differentiates between advanced economies (developed countries) and emerging or developing economies (developing countries). This aspect is introduced in our study by using differentiated variables of environmental score for developed and developing countries. Thus, the main objective of this paper is twofold. Firstly, we analyze the effect of corporate environmental performance on large firms’ financial performance around the world over the 2008–2015 period. Secondly, we examine the influence of environmental practices on large firms’ financial performance in developed and developing countries over the 2008–2015 period.
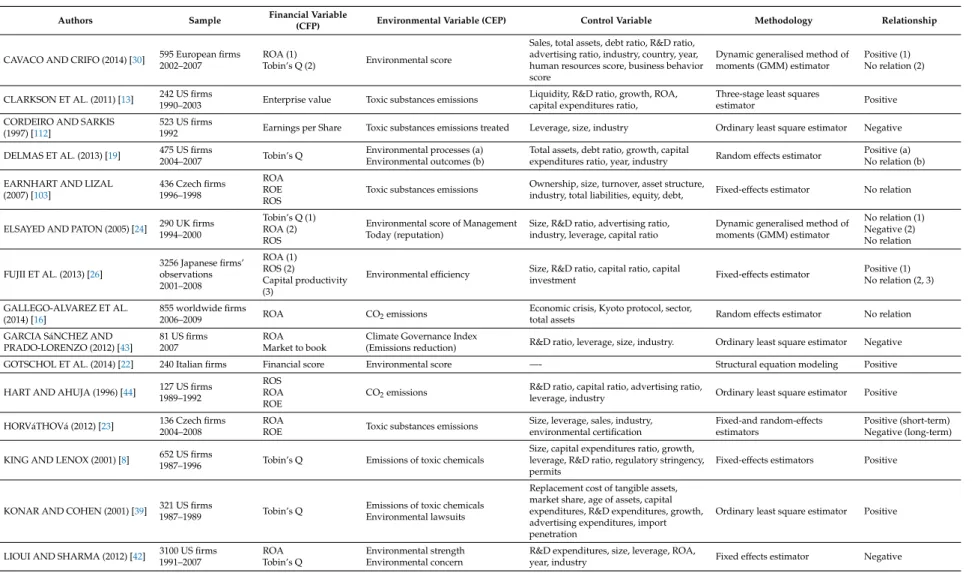
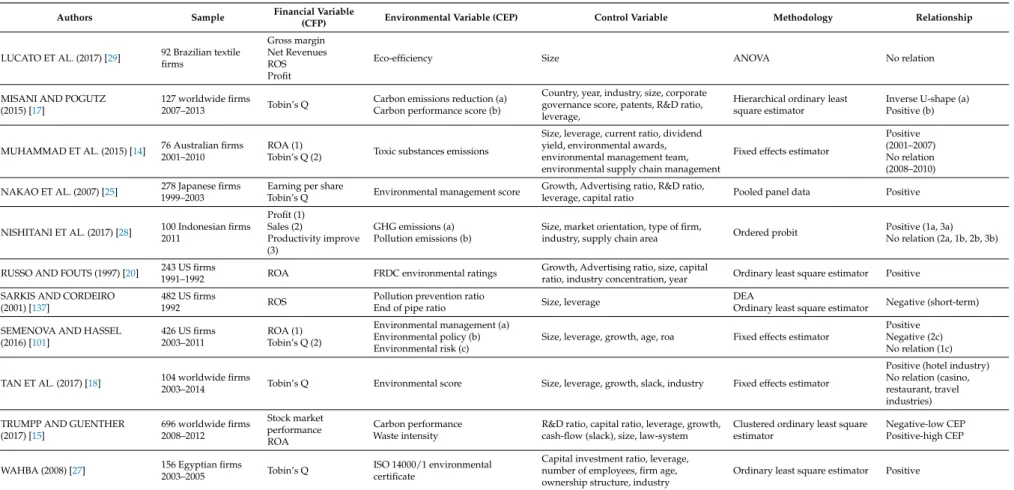
We contribute to the literature in three different ways. Firstly, while previous studies use a great variety of one-dimensional corporate environmental performance measures mainly focused on toxic substance emissions [13–17] for analyzing the effect of corporate environmental performance on corporate financial performance (see AppendixA), we apply a multidimensional construct of corporate environmental performance which provides a broader perspective of it, as in [18], whose work is focused on the tourism industry. Secondly, previous studies have examined the effect of corporate environmental performance on corporate financial performance for firms located in a single country or region such as United States [19,20], Germany [21], Italy [22], Australia [14], Czech Republic [23], UK [24], Japan [25,26], Egypt [27], Indonesia [28], Brazil [29] and European region [30], while our study includes firms located in several countries around the world as in [16–18]. Thirdly, we introduce in our model the effect of the level of economic development of the country where the firm develops its business activities on the relationship between corporate environmental performance (in the broader environmental sense) and corporate financial performance.
2. Literature Review
There have been numerous researches about the influence of the environmental behavior and performance of a firm on its financial results, using different samples and methodologies [31–34]. Unfortunately, we are far from observing consensus on this topic, as contradictory results have come out from past studies with regards to the positive, negative or neutral nature of the CEP-CFP relationship.
Relevant theories of management and corporate governance have argued in favor of a positive CEP-CFP relationship. The stakeholder-agency theory [35] states that firms can be more efficient at adjusting to external demands and concerns, by addressing and balancing the claims of several stakeholders, as part of CSR strategies that include environmental practices; this efficient adaptation
leads to better performance and better financial outcomes. More clearly, the natural-resource-based view proposes that the success of firms is directly related to its relationship with its natural environment [36], through which firms can achieve a competitive advantage based on pollution prevention, product stewardship and sustainable development; the correct administration of natural resources and capabilities guarantees firms’ performance [4]. Additionally, high levels of CFP provide firms with more resources to engage in CSR and environmental practices (slack resources) [37]. Both slack resources and good management lead firms to outperform in CEP and CFP.
Some authors have argued in support of a positive CEP-CFP link; given the results they have obtained [25–27]. One of the first studies in finding a positive significant relationship goes back to 20 years ago [38], and concluded, with a S&P 500 sample, that environmental compliance had a clear positive effect on firm’s financial measures like ROA or ROE. Beyond that, this study found that CEP had a negative effect on investor’s risk; that is, financial market investments on low pollution firms do as well as investments on high pollution firms, or even better, without investors paying a premium for investing in “green” portfolios. Studies like this one opened the door to the “Does it pay to be green?” question, answered positively in studies of 1990s US manufacturing firms [8] or 2000s Japanese manufacturing firms [25], among others. Additionally, this relationship nature can work in another way: a bad environmental performance might be negatively correlated with firm’s market value, as argued by [39], who also recognized the positive effect of CEP on the intangible assets increase, even after controlling for traditional CFP explanatory variables.
The large quantity of studies on CEP-CFP relationship going on in the last two decades motivated the appearance of meta-analyses developed by researchers who wanted to test this relationship by grouping several past studies and concluding over all of them [31,34]. Some of these meta-analyses covered several contradictory studies, and even like that, found a positive CEP-CFP relationship. Across studies, CEP has been proved to be positively correlated with CFP [40]. The strength of this positive relationship depends on several factors including research duration, used measures [7] and CEP approach: proactive or reactive [33]. Many of these studies recognize a bidirectional relationship and reject the neoclassical view of a trade-off between CEP and CFP.
The neoclassical view [1] of the CEP-CFP relationship argues that environmental practices, and CSR in general, are sources of cost for the firm, not relevant for performance [41]. This is specially truth in the short term [23], when having a good environmental performance only implies incurring in additional costs, however, the benefits of CEP on CFP might emerge in the long term. From this perspective, the only relevant effect of CEP is related to more costs for the firm, which leads to poorer financial results [42,43]. Some firms may deal with this negative CEP-CFP relationship only for legal compliance reasons. This classical view is supported in some studies, no matter the time lag; Reference [42] indicates that the direct effect of environmental corporate social responsibility (firms’ strengths and concerns) on both accounting-based and market-based financial performance measures is negative. Meta-analysis studies have also suggested that negative CEP-CFP links come up especially when using simple correlation analysis and portfolio studies [31].
Additionally, there have been studies that concluded that this relationship nature depends on the sample analyzed. A study conducted by [44], with a S&P 500 industry-balanced sample of production firms, found a positive relationship between pollution reduction and CFP for high polluting firms, while the relationship remained insignificant for low polluting firms. In this case, pollution reduction (CEP), when significant, produced positive changes on performance specifically for the subsequent 2 years observed. However, some authors have found a negative effect of CEP on CFP for the first subsequent year, turning into positive later on [23]. In some cases, the direct effect of CEP on CFP might be negative, but the indirect effect might be positive [42], when considering the CEP-R&D interaction, for instance, since environmental practices foster R&D efforts, which lead to value creation at firms. The analysis of this topic has also leaded to more complex studies, like one conducted for Japanese firms [26], which found a significant inverted U-shaped relationship between ROA and environmental performance, indicating that the positive effect of CEP (CO2emissions) on CFP increases until a point
in which financial performance starts being negatively affected. CEP increases CFP through sales growth (profitability), but has a negative effect on capital productivity.
In the case of non-conclusive meta-analysis studies, the research method has been proved to affect the results regarding the CEP-CFP relationship [31]. For instance, the relationship is more likely to be found negative when using simple correlation coefficients or portfolio studies, and positive when using advanced econometric models. This study also points out the importance of time coverage in the results of the analysis. Moreover, positive CEP-CFP links are more commonly found in common law countries than in civil law countries.
The contradictory and relative results of several studies regarding CEP-CFP relationship moved the attention from the “Does it pay to be green?” question [6,7,32,44] to the “When does it pay to be green?” question, which has been answered using different explanatory and control variables, as seen in this section (also see AppendixA). In the case of our study, the “Where does it pay to be green?” question arises given our analysis of the economic development level of the country in which the firm is located and its effect on the CEP-CFP relationship, issue on which we will hypothesize and execute tests below.
3. Hypotheses
A growing number of firms are implementing environmentally-friendly business practices [45] to preserve the natural environment [46]. The adoption of environmental activities involves an increase in costs for firms, reducing their marginal net benefits [47]. This contravenes the primary objective of shareholder wealth maximization postulated in neoclassical economic theory [1,41]. However, the integration of environmental strategies into core business strategy allows firms to develop valuable, inimitable and non-substitutable organizational resources and capabilities [48], enabling firms which own them to create competitive advantage [49,50] by (1) improving the efficiency and productivity in their production processes, which reduces the input and waste disposal costs, improving long-term corporate financial performance from the natural-resource-based view [36,44]; and/or (2) differentiating their products which are made in an environmentally responsible way and/or integrate environmentally-friendly characteristics. This attracts consumers and other key stakeholders with environmentally-friendly behavior, raising the revenues and therefore the corporate financial performance according to instrumental stakeholder theory [51,52]. Therefore, we hypothesize that:
Hypothesis 1 (H1). Corporate environmental performance (CEP) positively influences corporate financial performance (CFP).
The environmental practices adopted by firms could be determined by the economic development stage of the country where they are located, differing for developed and developing countries [53,54]. Many emerging and developing countries have an institutional framework characterized by weaker environmental regulatory, normative and cognitive pressures [55] compared with developed countries [56], which influences the way in which firms manage their resources [57] and the relations with their key stakeholders [11] according to institutional theory [58].
From a regulatory perspective, governments promote laws, rules, norms and sanctions for firms to reduce their pollution emissions using pollution control technology and, thus, complying with legally established pollution thresholds [59]. Firms failing to carry out these environmental requirements are penalized, fined or may even lose their operating licenses [60] in developed countries [13], while the lack of resources to enforce environmental government regulations and monitor business activities in many developing and emerging countries [61,62] could mean that firms with low enforcement of environmental regulation [54], which produce environmental damage, have never been fined [63].
Weak environmental regulation, characterized by a lack of severe environmental penalties, does not generate incentives for firms located in developing countries to adopt environmental management systems that reduce the environmental footprints of their business activities, since environmental
compliance costs may exceed expected benefits [64] according to neoclassical economic theory [1,41]. On the contrary, the stringent environmental regulatory pressures, characteristic of developed countries, could lead firms to innovate [56,65], allowing them to generate competitive advantages [59], by developing valuable green resources and capabilities intended to (1) reduce risks while saving costs and/or differentiate their products from a resource-based view perspective [36] and (2) improve the firm’s image [56], aligning core business strategy with the interests of key green stakeholders according to instrumental stakeholder theory [2,66–68], which would increase corporate financial performance. Thus, the different levels of environmental regulatory pressures cause firms located in developed countries with a greater focus on stringent environmental regulations to exhibit higher corporate environmental performance [69,70], and therefore higher corporate financial performance [44], than firms in developing and emerging countries with weak environmental regulatory pressures.
The avoidance of economic and legal sanctions, as well as pressures from civil society, investors and financial institutions, could encourage firms to adopt voluntary environmental strategies in developed countries [71,72], anticipating stricter regulatory requirements [59]. Meanwhile, the weak formal regulation in developing countries exerts an important influence on firms, which adopt voluntary environmental strategies [9]. Thus, external stakeholders, such as professional and trade associations, academic institutions, supranational and national entities and industry initiatives [55], exert normative pressures in order to promote environmental values and norms of conduct that firms may voluntarily adopt, encouraged by non-coercive mechanisms such as public attention, peer industry pressures and the embarrassment of noncompliance [73]. These non-coercive mechanisms used by external stakeholders to pressure firms to implement environmental practices could differ depending on the economic development level of the country where the firm is located [62].
Civil society shows a strong concern for environmental issues in developed countries [62], while its environmental awareness is emerging gradually in developing countries [74,75], still being backward [62], which allows the formers to exert stronger pressure on firms than civil society in developing countries [76]. Specifically, environmental NGOs, consumer associations, local communities and the media share information about corporate environmental behavior with consumers [77,78]. Consumers in developed countries, concerned about the environmental impact of business activities [79], are willing to pay more for environmentally-friendly products [80], demand for which grows as factors such as consumer’s income, education and environmental awareness levels increase [81]. In developing countries, consumers are sympathetic to environmental issues [76], however, their primary concern is to overcome poverty [76]. For this reason, their purchasing decisions are mainly driven by the price of the products [82], avoiding buying environmentally-friendly products because they are usually more expensive [62,83].
Firms do not only face pressures from consumer markets to generate new environmentally-friendly products and procedures but also from financial markets [84]. Financial institutions and investors are starting to consider environmental issues as an important part of good corporate governance [85]. Different financial institutions around the world have adhered to the United Nations Environment Programme-Finance Initiative (UNEP-FI), by means of which they commit to integrating environmental and social issues into their business operations [86]. Thus, banks located in developed and developing countries are beginning to take into account the firms’ environmental risks in order to avoid financing polluting activities, offering loans to finance clean technologies and/or produce new environmentally-friendly products [87]. This allows banks to reduce credit risk and responsibilities derived from the environmental pollution of their clients, while improving their reputation. With the same objective of reducing environmental risks, individual investors react positively to the news of superior corporate environmental performance, and negatively to the announcement of adverse environmental incidents influencing the firms’ market value in developed and developing countries [88,89].
However, institutional investors such as pension funds and mutual funds lead the financial markets, trading a large percentage of stock listed on the Stock Exchange around the world [90]. An increasing number of these institutional investors are integrating environmental, social and
corporate governance (ESG) criteria to manage their portfolios, an important part of socially responsible investment (SRI) assets belonging to green funds domiciled in developed countries [91,92]. This indicates that firms located in developed countries integrating environmental practices into their core business strategy are more likely to obtain financial resources from green financial markets than those in developing countries. Thus, the normative pressures from civil society and financial markets to adopt environmental activities are stronger for firms in developed countries than for firms in developing countries. Consequently, firms in developed countries could make higher environmental investments than firms in developing countries, which gives arise to extra expenses without creating income, the former thus reducing their short-term profits according to neoclassical economic theory [1].
However, firms in developed countries implement voluntary environmental initiatives for developing a set of valuable and inimitable green organizational capabilities and resources that allow them to achieve a sustainable competitive advantage from a natural-resource-based view [36]. These superior environmental abilities may be focused on (1) developing new environmental technologies and services and/or (2) producing new environmentally-friendly products. Innovation in the environmental production process and/or green products requires high investments that firms recover in the medium- and long-term [7] by (1) enhancing resource efficiency, which saves production costs, improving firms’ profits in the medium- and long-term from a natural-resource-based view [36]; and (2) satisfying the expectations and claims of their key stakeholders, which allows firms to build a good relationship with them. This provides firms with legitimacy, improving their reputation, which reduces the cost of capital from green banks and investors while attracting environmentally conscious consumers, who are willing to pay more for green products [56], improving corporate financial performance in the medium- and long-term from an instrumental stakeholder theory [51].
On the contrary, firms in developing countries, with emerging environmental awareness, may implement voluntary environmental initiatives that require unsophisticated and inexpensive technology and processes [93]. This allows firms to improve production efficiency, resulting in large environmental impact reductions relative to costs, leading firms to gather “low-hanging fruits” and thus increasing short-term corporate financial performance without increasing price of products to consumers [44]. As corporate environmental performance improves, the unsophisticated technology used could become standard in an industry and firms would need to make high investments in more significant changes in processes, including new production technology [44] in order to reduce their environmental footprint. This involves an important increase in environmental costs, ceteris paribus income, because consumers are not willing to pay more for green products, which reduces corporate financial performance from a neoclassical economic theory.
The good financial performance of environmentally leading firms could exert a cognitive pressure on other firms that seek to gain environmental legitimacy by mimicking the environmental management practices that successful firms have implemented [94,95]. Developed-country firms receive stronger pressures to adopt environmental activities from policy-makers or governments, civil society and financial markets than those in developing countries, which encourages more firms in developed countries to implement environmental management practices, prevalent among environmental and reputational indexes (such as Fortune Global 500, FTSE4Good Global, among others), with respect to firms in developing countries. This implies that pressures toward mimetic isomorphism are stronger for developed-country firms than for developing-country firms, meaning that more firms in developed countries achieve environmental legitimacy by mimicking environmental practices of leading environmental movers than in developing countries.
Recently, developed-country firms adopting environmental strategies could develop rare and inimitable resources and capabilities that would allow firms to reach competitive advantages by satisfying the environmental expectations of their stakeholders, from instrumental stakeholder theory, by (1) enhancing the efficiency of the resources used in the production process, reducing costs; and/or (2) producing new environmentally-friendly products that attract potential green clients, increasing the income and therefore the corporate financial performance in the long term from
a natural-resource-based view. Recently, developing-country firms implementing environmental activities could implement environmental practices that require lower investments while increasing the production efficiency [93], reducing production costs, which allows them to offer consumers environmentally-friendly products without increasing prices. This improves corporate financial performance in the short term.
Given that firms in developed countries, concerned about environmental issues, receive strong regulatory, normative and cognitive pressures that encourage them to integrate environmental strategies into the core business strategies to achieve competitive advantages, while firms in developing countries with emerging environmental awareness receive weak regulatory, normative and cognitive pressures that encourage them to integrate environmental strategies that save costs in the early phase of implementation, we hypothesize that:
Hypothesis 2a (H2a).The adoption of environmental practices allows firms in developed countries to enhance their corporate financial performance.
Hypothesis 2b (H2b).The adoption of environmental practices allows firms in developing countries to improve their corporate financial performance.
Hypothesis 2c (H2c).The effect of corporate environmental performance on corporate financial performance is stronger in developed countries than in developing countries.
4. Research Method
In this section, we describe the research method followed to test the aforementioned hypotheses. 4.1. Sample
To test the hypotheses, we have a database of large firms in different developed and developing countries around the world from 2008 to 2015, covering a long-term period. For these firms, we have data regarding environmental scores, return on assets (ROA), Tobin’s Q, cash flow, current assets-liabilities ratio, debt-assets ratio, total assets, R&D expenses, capital expenditure, net sales, industry, geographical region, country’s level of economic development. Data used in this analysis do not include micro, small and medium-sized enterprises (SME’s) in accordance with the European Commission definition [96], which specifies that SME’s should not exceed EUR 43 M of total balance sheet assets; all firms included in our study are large (>EUR 57 M of total assets). Firms from the financial industry (insurance companies, banks, etc.) are excluded from our study as in previous studies by [39,97,98], due to their specific legislation and measurement methodology for accounting and financial measures. We winsorize the extreme low and high 0.5% of the data mentioned to account for outliers, as in [99]. The environmental data were extracted from ASSET4 database, and the financial and accounting data from Worldscope database, both DataStream databases (by Thomson Reuters). The level of economic development comes from International Monetary Fund-IMF classification [12]. The ASSET4 database enjoys recognition for its complete ratings of social responsibility, including environmental, corporate governance, economic and social dimensions, providing objective, comparable and systematic extra-financial information that is assessed by independent external social audits [100]. This database, founded in 2003, collects and compiles publicly available information on firms’ CSR strategies using 750 individual data points, combined into over 280 key performance indicators from over 4612 large firms distributed around the world and belonging to several industries. The ASSET4 database has been used in [15,18,101,102], among others. On the other hand, Worldscope database provides information on over 58,000 firms, with more than 37,000 of them active, which are included in this database on meeting at least one of these criteria: (1) their market capitalization must be greater than US$100 million; (2) they must be a member of one or more global or local indexes; (3) they must be
quoted on many stock markets; and (4) they must have high visibility. It contains historical data obtained from annual reports of publicly traded companies from around the world from 1980.
After combining environmental data from ASSET4 database, financial data from Worldscope database, and economic development level from IMF, we end up with an unbalanced panel sample of 2982 firms, for which information is available for at least three consecutive years between 2008 and 2015 due to methodological issues, and 17,723 firm-year observations with complete data.
4.2. Dependent Variable
The dependent variable of our model is corporate financial performance (CFP), which is measured through (1) an accounting-based measure such as Return on Assets (ROA), which reflects the short-term CFP [103]; and (2) a market-based measured, such as Tobin’s Q, which reflects the long-term CFP [19]. From an accounting perspective, ROA is assessed as the ratio between net income of the firm and the book value of total assets [24]. This variable represents the capacity of the firm’s assets to generate benefits, without considering the firm’s debt and tax burden. From a market perspective, Tobin’s Q is measured as the market value of the firm, divided by the book value of total assets [8]. This variable represents the firm’s performance in the market, given the relationship between the in-practice market price of exchanging the firm’s existing assets and the accounting price of the firm’s assets taken from its balance sheets.
4.3. Independent Variables
The independent variable of our model is corporate environmental performance (CEP), measured through a sector-neutral index that reflects the success degree of environmental practices implemented over the firms’ supply chain (inputs, processes, outputs) and the outcomes obtained (e.g., in terms of emissions), as in [18]. Through ASSET4, Thomson Reuters provides data on over 5000 companies about environmental, social and governance (ESG) performance, with an equal-weighted rating of companies’ financial and extra-financial health. Our CEP measure is based on the environmental pillar of ESG score, which approaches the impact of companies on living and non-living natural systems; it reflects how well a company uses best management practices to avoid environmental risks and capitalize on environmental opportunities to generate long term shareholder value. This environmental score covers three categories:
Emission reduction: It measures commitment and effectiveness of a company’s management for reducing environmental emissions in the production and operational processes, and reflects the capacity to reduce air emissions (e.g., greenhouse gases, NOx and SOx), hazardous waste, water discharges or its impact on biodiversity, and to partner with environmental organisations to mitigate the impact of the company in the community.
Product innovation: It measures commitment and effectiveness of a company’s management for supporting research and development of eco-efficient products and services, and reflects the capacity to reduce environmental costs and burdens for customers, creating new market opportunities with new environmental technologies/processes and dematerialized, eco-designed products with extended durability.
Resource reduction: It measures commitment and effectiveness of a company’s management for achieving an efficient use of natural resources in the production process, and reflects the capacity to reduce the use of materials, water or energy, and to improve supply chain management by finding more eco-efficient solutions in production.
Thus, our corporate environmental performance (CEP) measure integrates an environmental management dimension focused on environmental processes and an environmental operational dimension focused on outcomes as recommended by [99]. This allows us to overcome the limitation produced by the use of one-dimensional corporate environmental performance measures focused on environmental outputs (e.g., CO2emissions), given that firm’s internal efforts to address environmental issues could also affect corporate financial performance [19,33].
ESG data is collected on more than 500 separate data points from multiple sources such as company reports, fillings and websites, NGO websites, CSR reports and media outlets. The ASSET4 environmental score is given in percent units (100 = 100%) with positive scaling. It consists of 70 boolean and metric KPIs which are given a relative level of importance—weight—at each of the 52 industries, based on its reporting accuracy, objective measurability and independent information content; each company’s environmental score equals the sum of the products of each KPI’s score and weight. Finally, raw scores are converted to ratings through statistical normalization and each company is assigned a percentile rank.
As independent variables, we also introduce CEPAC, including the above-mentioned environmental scores corresponding to firms located in developed countries (according to IMF classification), while CEPDC integrates the corporate environmental scores corresponding to firms located in developing countries (according to IMF classification). These independent variables allow us to examine the effect of corporate environmental performance on corporate financial performance for developed and developing countries, respectively. To avoid multicollinearity problems, CEPAC and CEPDC variables are not included in the regression model together with the CEP variable. 4.4. Control Variables
In order to avoid the possibility of obtaining biased estimations due to the omission of relevant variables, we include in the regression models several control variables commonly used in the analysis of CEP effect on CFP (see AppendixA). These variables are: firms’ slack resource, firms’ leverage, firms’ size, firms’ research and development expenses, firms’ capital expenditure, firms’ growth, firms’ market power, the economic sector in which the firms operate and the region in which firms’ headquarters are located. Previous research reveals, based on slack resources theory [37], that firms’ available funds allow them to invest in environmental activities, what improves their corporate environmental performance, and shows a credible signal of environmental commitment to key stakeholders increasing firms’ financial performance. This conclusion has been supported by studies in developed and developing countries such as: Reference [104] in China, Reference [14] in Australia and Reference [51] from a multi-country perspective. Therefore, we control for firm’s slack resources using the CashFlow and CurrentRatio variables measured through the funds or cash flows from operations over sales and the assets-liabilities ratio, respectively [42].
Previous research has not reached a consensus regarding the effect of firms’ leverage on corporate financial performance. References [43,105] find a positive relationship in the US and Egyptian geographical market, respectively, indicating that firms increasing their debt levels to improve their production processes and/or to reduce the environmental footprint of their business activities increase their corporate financial performance, as in [102]; On the other hand, Reference [106,107] in the Japan geographical market and [108] from a multi-country perspective show a negative connection, indicating that high debt levels influence firms’ ability to meet their financial obligations [104], what negatively affects corporate financial performance. Hence, we control the level of debt by means of the Leverage variable, measured as the total debt of the firm divided by its total assets, being a proxy for the firm’s risk [43].
Prior empirical studies suggest that large firms tend to exhibit diseconomies of scale, because of complex processes of decision-making, coordination and resource allocation and costly structural changes, and find a negative association between firm size and corporate financial performance [101,109]. Therefore, we control for firm size (Lsize), calculated as the natural logarithm of firm’s total assets [109]. Additionally, it is often asserted that firms with high investments in research and development projects achieve competitive advantages through innovation [110], increasing their corporate financial performance. Many studies examine research and development expenses as a determinant of financial performance and find a positive association [30,109]. Hence, we control for research and development intensity (R&D) assessed by dividing research and development expenses of the firm by its total sales revenue [17].
Another variable that has been used frequently for examining the relationship between corporate environmental performance and corporate financial performance is firm’s capital intensity. Specifically, References [20,47] show a negative connection indicating that firms purchasing capital equipment from suppliers usually require large amounts of money, which leads to higher costs and thus reduces corporate financial performance. Therefore, we control for firm’s capital intensity (Capital) measured as the capital expenditure to total sales revenue ratio [27]. Furthermore, empirical studies analyzing corporate financial performance and corporate environmental performance relationship have observed a positive association between sales growth and corporate financial performance [18,103]. Firms, which make economies of growth and innovation emerge, generate profitable growth [111] and economic value (by increasing their sales base). Hence, we control for growth of the firm, measured as the sales growth in a one-year period [13]. Given that the sales growth could lead firms to increase their market share, we also control for the market power of the firm (MarketShare) calculated as firm’s total sales revenue to total industry sales ratio [39].
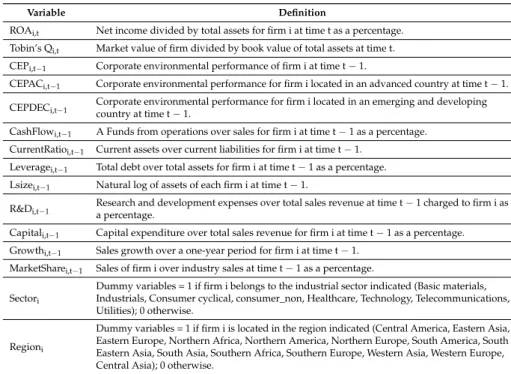
The industry to which the firm belongs is another determinant of corporate financial performance [15,42] due to different intensity of competition among industries and pressures from their stakeholders. Accordingly, we control for the economic sector (Industry) to which a firm belongs through a dummy variable [112]. The region where a firm is located also determines the level of institutional pressure to adopt environmental practices promoted by different environmental programmes [113,114]. Institutional pressures influence environmental regulations, which affect environmental actions. Flexible environmental regulations lead to win-win opportunities, explaining regional differences between corporate environmental performance and corporate financial performance [7]. Therefore, we control for firm’s location (Region), represented by a dummy variable in accordance with United Nations classification [115]. Table1summarizes these variables.
Table 1.Definition variables.
Variable Definition
ROAi,t Net income divided by total assets for firm i at time t as a percentage.
Tobin’s Qi,t Market value of firm divided by book value of total assets at time t.
CEPi,t−1 Corporate environmental performance of firm i at time t−1.
CEPACi,t−1 Corporate environmental performance for firm i located in an advanced country at time t−1.
CEPDECi,t−1 Corporate environmental performance for firm i located in an emerging and developingcountry at time t−1.
CashFlowi,t−1 A Funds from operations over sales for firm i at time t−1 as a percentage.
CurrentRatioi,t−1 Current assets over current liabilities for firm i at time t−1.
Leveragei,t−1 Total debt over total assets for firm i at time t−1 as a percentage.
Lsizei,t−1 Natural log of assets of each firm i at time t−1.
R&Di,t−1 Research and development expenses over total sales revenue at time ta percentage. −1 charged to firm i as
Capitali,t−1 Capital expenditure over total sales revenue for firm i at time t−1 as a percentage.
Growthi,t−1 Sales growth over a one-year period for firm i at time t−1.
MarketSharei,t−1 Sales of firm i over industry sales at time t−1 as a percentage.
Sectori
Dummy variables = 1 if firm i belongs to the industrial sector indicated (Basic materials, Industrials, Consumer cyclical, consumer_non, Healthcare, Technology, Telecommunications, Utilities); 0 otherwise.
Regioni
Dummy variables = 1 if firm i is located in the region indicated (Central America, Eastern Asia, Eastern Europe, Northern Africa, Northern America, Northern Europe, South America, South Eastern Asia, South Asia, Southern Africa, Southern Europe, Western Asia, Western Europe, Central Asia); 0 otherwise.
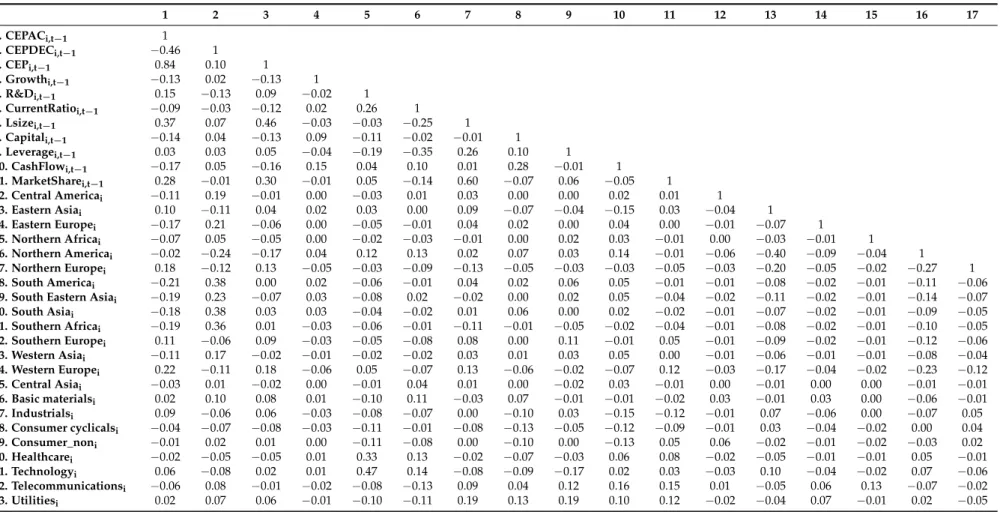
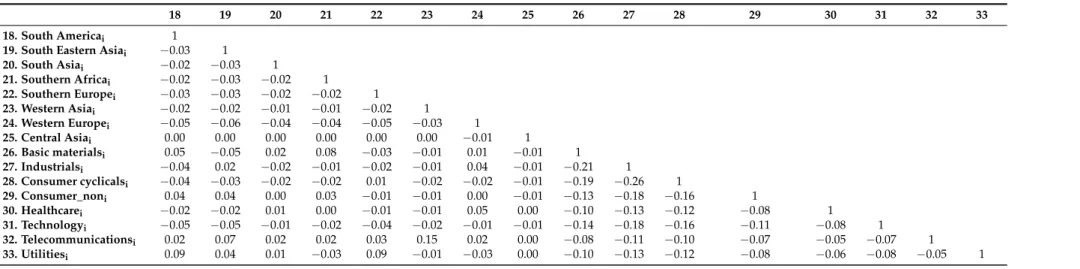
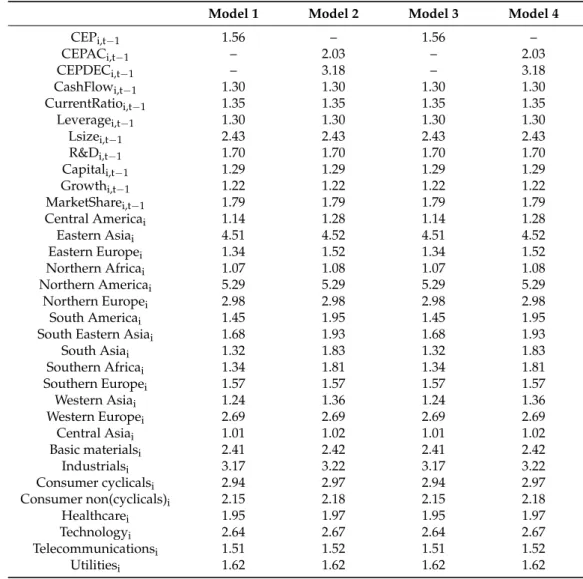
Tables2–5present the descriptive statistics for the above-mentioned variables. In Table6we report the correlation matrix for independent and control variables. The correlation coefficients between the set of independent and control variables used in the same regression are less than 0.80, indicating that the threat of multicollinearity is limited [51]. The analysis of variance inflation factors (VIF), shown in Table7, confirms that our estimations do not suffer from multicollinearity problems given that all of the VIF values are less than 10 [51].
Table 2.Descriptive statistics during 2009–2015 period.
Variable Observations Mean Standard Deviations Minimum Maximum
ROAi,t 17,723 5.95 7.47 −48.93 40.61 TobinsQi,t 17,723 1.27 0.97 0.07 8.04 CEPi,t−1 17,723 54.91 31.33 8.67 95.08 CEPACi,t−1 15,364 55.95 31.72 8.67 95.08 CEPDECi,t−1 2359 48.13 27.73 9.38 94.79 CashFlowi,t−1 17,723 16.22 14.64 −484.79 79.15 CurrentRatioi,t−1 17,723 1.79 1.23 0.27 14.88 Leveragei,t−1 17,723 25.02 16.83 0.00 86.76 Sizeai,t−1 17,723 9770 17,600 57.1 170,000 R&Di,t−1 17,723 2.09 4.73 0.00 41.61 Capitali,t−1 17,723 11.22 22.34 0.10 866.18 Growthi,t−1 17,723 0.10 0.25 −0.67 3.62 MarketSharei,t−1 17,723 0.28 0.58 0.00 8.40
aValues are expressed in millions of Euros.
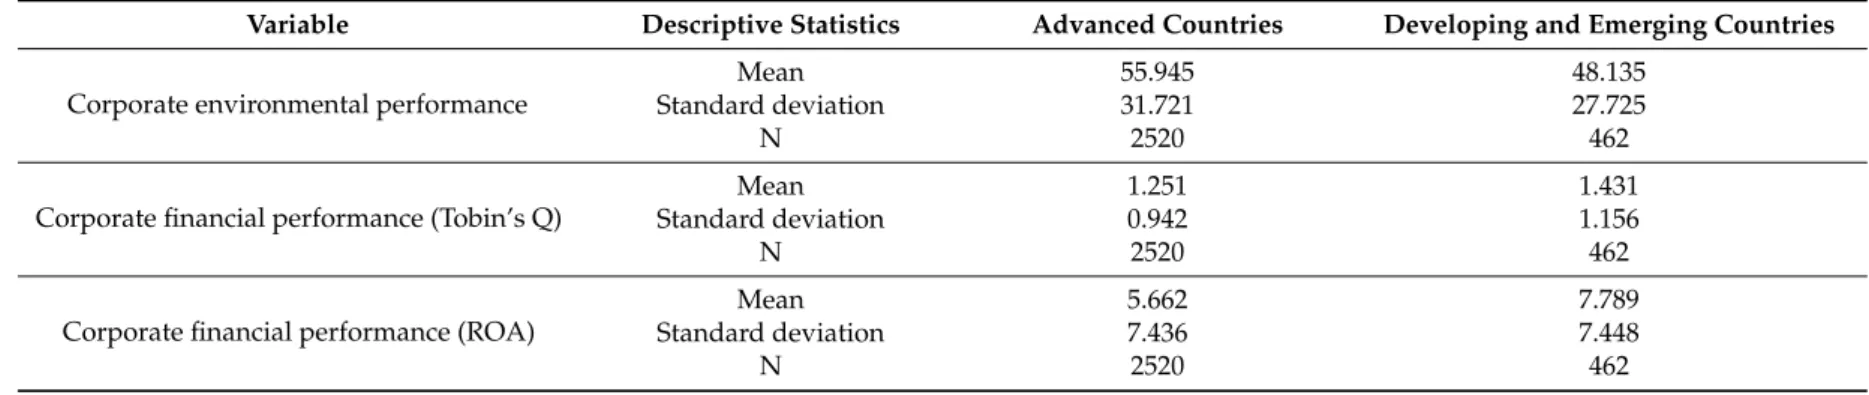
Table 3.Descriptive statistics by country’s economic development.
Variable Descriptive Statistics Advanced Countries Developing and Emerging Countries
Corporate environmental performance
Mean 55.945 48.135
Standard deviation 31.721 27.725
N 2520 462
Corporate financial performance (Tobin’s Q)
Mean 1.251 1.431
Standard deviation 0.942 1.156
N 2520 462
Corporate financial performance (ROA)
Mean 5.662 7.789
Standard deviation 7.436 7.448
Table 4.Descriptive statistics by industrial sector.
Industrial Sector Number of Observations
Number of Firms
Corporate Environmental Performance (CEP)
Corporate Financial Performance (Tobin’s Q)
Corporate Financial Performance (ROA)
Mean Standard Deviation Mean Standard Deviation Mean Standard Deviation
Basic materials 2459 424 61.22 29.34 1.10 0.76 4.45 8.21 Consumer cyclical 3368 563 49.48 32.79 1.41 1.15 6.98 7.78 Consumer non-cyclical 1726 292 55.44 30.86 1.55 1.11 7.32 6.99 Energy 1683 296 45.33 29.13 1.05 0.63 3.51 8.88 Healthcare 1016 170 48.55 33.23 1.89 1.21 8.70 6.68 Industrials 3935 650 58.53 29.99 1.13 0.85 5.56 6.08 Technology 1824 305 56.81 33.23 1.42 1.12 6.76 8.42 Telecommunications Services 683 115 52.70 32.00 1.30 0.76 7.63 6.31 Utilities 1029 167 62.84 26.10 0.85 0.32 4.03 4.32 Total 17,723 2982 54.91 31.33 1.27 0.97 5.95 7.47
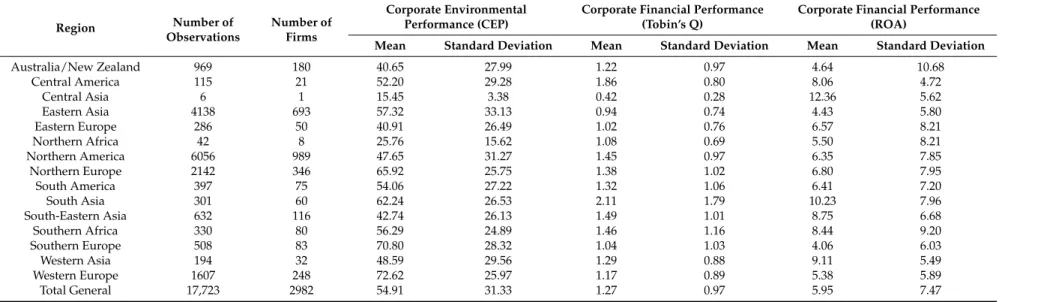
Table 5.Descriptive statistics by region.
Region Number of Observations Number of Firms Corporate Environmental Performance (CEP)
Corporate Financial Performance (Tobin’s Q)
Corporate Financial Performance (ROA)
Mean Standard Deviation Mean Standard Deviation Mean Standard Deviation
Australia/New Zealand 969 180 40.65 27.99 1.22 0.97 4.64 10.68 Central America 115 21 52.20 29.28 1.86 0.80 8.06 4.72 Central Asia 6 1 15.45 3.38 0.42 0.28 12.36 5.62 Eastern Asia 4138 693 57.32 33.13 0.94 0.74 4.43 5.80 Eastern Europe 286 50 40.91 26.49 1.02 0.76 6.57 8.21 Northern Africa 42 8 25.76 15.62 1.08 0.69 5.50 8.21 Northern America 6056 989 47.65 31.27 1.45 0.97 6.35 7.85 Northern Europe 2142 346 65.92 25.75 1.38 1.02 6.80 7.95 South America 397 75 54.06 27.22 1.32 1.06 6.41 7.20 South Asia 301 60 62.24 26.53 2.11 1.79 10.23 7.96 South-Eastern Asia 632 116 42.74 26.13 1.49 1.01 8.75 6.68 Southern Africa 330 80 56.29 24.89 1.46 1.16 8.44 9.20 Southern Europe 508 83 70.80 28.32 1.04 1.03 4.06 6.03 Western Asia 194 32 48.59 29.56 1.29 0.88 9.11 5.49 Western Europe 1607 248 72.62 25.97 1.17 0.89 5.38 5.89 Total General 17,723 2982 54.91 31.33 1.27 0.97 5.95 7.47
Table 6.Correlation matrix for regression variables. 1 2 3 4 5 6 7 8 9 10 11 12 13 14 15 16 17 1. CEPACi,t−1 1 2. CEPDECi,t−1 −0.46 1 3. CEPi,t−1 0.84 0.10 1 4. Growthi,t−1 −0.13 0.02 −0.13 1 5. R&Di,t−1 0.15 −0.13 0.09 −0.02 1 6. CurrentRatioi,t−1 −0.09 −0.03 −0.12 0.02 0.26 1 7. Lsizei,t−1 0.37 0.07 0.46 −0.03 −0.03 −0.25 1 8. Capitali,t−1 −0.14 0.04 −0.13 0.09 −0.11 −0.02 −0.01 1 9. Leveragei,t−1 0.03 0.03 0.05 −0.04 −0.19 −0.35 0.26 0.10 1 10. CashFlowi,t−1 −0.17 0.05 −0.16 0.15 0.04 0.10 0.01 0.28 −0.01 1 11. MarketSharei,t−1 0.28 −0.01 0.30 −0.01 0.05 −0.14 0.60 −0.07 0.06 −0.05 1 12. Central Americai −0.11 0.19 −0.01 0.00 −0.03 0.01 0.03 0.00 0.00 0.02 0.01 1 13. Eastern Asiai 0.10 −0.11 0.04 0.02 0.03 0.00 0.09 −0.07 −0.04 −0.15 0.03 −0.04 1 14. Eastern Europei −0.17 0.21 −0.06 0.00 −0.05 −0.01 0.04 0.02 0.00 0.04 0.00 −0.01 −0.07 1 15. Northern Africai −0.07 0.05 −0.05 0.00 −0.02 −0.03 −0.01 0.00 0.02 0.03 −0.01 0.00 −0.03 −0.01 1 16. Northern Americai −0.02 −0.24 −0.17 0.04 0.12 0.13 0.02 0.07 0.03 0.14 −0.01 −0.06 −0.40 −0.09 −0.04 1 17. Northern Europei 0.18 −0.12 0.13 −0.05 −0.03 −0.09 −0.13 −0.05 −0.03 −0.03 −0.05 −0.03 −0.20 −0.05 −0.02 −0.27 1 18. South Americai −0.21 0.38 0.00 0.02 −0.06 −0.01 0.04 0.02 0.06 0.05 −0.01 −0.01 −0.08 −0.02 −0.01 −0.11 −0.06
19. South Eastern Asiai −0.19 0.23 −0.07 0.03 −0.08 0.02 −0.02 0.00 0.02 0.05 −0.04 −0.02 −0.11 −0.02 −0.01 −0.14 −0.07
20. South Asiai −0.18 0.38 0.03 0.03 −0.04 −0.02 0.01 0.06 0.00 0.02 −0.02 −0.01 −0.07 −0.02 −0.01 −0.09 −0.05 21. Southern Africai −0.19 0.36 0.01 −0.03 −0.06 −0.01 −0.11 −0.01 −0.05 −0.02 −0.04 −0.01 −0.08 −0.02 −0.01 −0.10 −0.05 22. Southern Europei 0.11 −0.06 0.09 −0.03 −0.05 −0.08 0.08 0.00 0.11 −0.01 0.05 −0.01 −0.09 −0.02 −0.01 −0.12 −0.06 23. Western Asiai −0.11 0.17 −0.02 −0.01 −0.02 −0.02 0.03 0.01 0.03 0.05 0.00 −0.01 −0.06 −0.01 −0.01 −0.08 −0.04 24. Western Europei 0.22 −0.11 0.18 −0.06 0.05 −0.07 0.13 −0.06 −0.02 −0.07 0.12 −0.03 −0.17 −0.04 −0.02 −0.23 −0.12 25. Central Asiai −0.03 0.01 −0.02 0.00 −0.01 0.04 0.01 0.00 −0.02 0.03 −0.01 0.00 −0.01 0.00 0.00 −0.01 −0.01 26. Basic materialsi 0.02 0.10 0.08 0.01 −0.10 0.11 −0.03 0.07 −0.01 −0.01 −0.02 0.03 −0.01 0.03 0.00 −0.06 −0.01 27. Industrialsi 0.09 −0.06 0.06 −0.03 −0.08 −0.07 0.00 −0.10 0.03 −0.15 −0.12 −0.01 0.07 −0.06 0.00 −0.07 0.05 28. Consumer cyclicalsi −0.04 −0.07 −0.08 −0.03 −0.11 −0.01 −0.08 −0.13 −0.05 −0.12 −0.09 −0.01 0.03 −0.04 −0.02 0.00 0.04 29. Consumer_noni −0.01 0.02 0.01 0.00 −0.11 −0.08 0.00 −0.10 0.00 −0.13 0.05 0.06 −0.02 −0.01 −0.02 −0.03 0.02 30. Healthcarei −0.02 −0.05 −0.05 0.01 0.33 0.13 −0.02 −0.07 −0.03 0.06 0.08 −0.02 −0.05 −0.01 −0.01 0.05 −0.01 31. Technologyi 0.06 −0.08 0.02 0.01 0.47 0.14 −0.08 −0.09 −0.17 0.02 0.03 −0.03 0.10 −0.04 −0.02 0.07 −0.06 32. Telecommunicationsi −0.06 0.08 −0.01 −0.02 −0.08 −0.13 0.09 0.04 0.12 0.16 0.15 0.01 −0.05 0.06 0.13 −0.07 −0.02 33. Utilitiesi 0.02 0.07 0.06 −0.01 −0.10 −0.11 0.19 0.13 0.19 0.10 0.12 −0.02 −0.04 0.07 −0.01 0.02 −0.05
Table 6.Cont.
18 19 20 21 22 23 24 25 26 27 28 29 30 31 32 33
18. South Americai 1
19. South Eastern Asiai −0.03 1
20. South Asiai −0.02 −0.03 1 21. Southern Africai −0.02 −0.03 −0.02 1 22. Southern Europei −0.03 −0.03 −0.02 −0.02 1 23. Western Asiai −0.02 −0.02 −0.01 −0.01 −0.02 1 24. Western Europei −0.05 −0.06 −0.04 −0.04 −0.05 −0.03 1 25. Central Asiai 0.00 0.00 0.00 0.00 0.00 0.00 −0.01 1 26. Basic materialsi 0.05 −0.05 0.02 0.08 −0.03 −0.01 0.01 −0.01 1 27. Industrialsi −0.04 0.02 −0.02 −0.01 −0.02 −0.01 0.04 −0.01 −0.21 1 28. Consumer cyclicalsi −0.04 −0.03 −0.02 −0.02 0.01 −0.02 −0.02 −0.01 −0.19 −0.26 1 29. Consumer_noni 0.04 0.04 0.00 0.03 −0.01 −0.01 0.00 −0.01 −0.13 −0.18 −0.16 1 30. Healthcarei −0.02 −0.02 0.01 0.00 −0.01 −0.01 0.05 0.00 −0.10 −0.13 −0.12 −0.08 1 31. Technologyi −0.05 −0.05 −0.01 −0.02 −0.04 −0.02 −0.01 −0.01 −0.14 −0.18 −0.16 −0.11 −0.08 1 32. Telecommunicationsi 0.02 0.07 0.02 0.02 0.03 0.15 0.02 0.00 −0.08 −0.11 −0.10 −0.07 −0.05 −0.07 1 33. Utilitiesi 0.09 0.04 0.01 −0.03 0.09 −0.01 −0.03 0.00 −0.10 −0.13 −0.12 −0.08 −0.06 −0.08 −0.05 1
Table 7.Results of variance inflation factor (VIF).
Model 1 Model 2 Model 3 Model 4
CEPi,t−1 1.56 – 1.56 – CEPACi,t−1 – 2.03 – 2.03 CEPDECi,t−1 – 3.18 – 3.18 CashFlowi,t−1 1.30 1.30 1.30 1.30 CurrentRatioi,t−1 1.35 1.35 1.35 1.35 Leveragei,t−1 1.30 1.30 1.30 1.30 Lsizei,t−1 2.43 2.43 2.43 2.43 R&Di,t−1 1.70 1.70 1.70 1.70 Capitali,t−1 1.29 1.29 1.29 1.29 Growthi,t−1 1.22 1.22 1.22 1.22 MarketSharei,t−1 1.79 1.79 1.79 1.79 Central Americai 1.14 1.28 1.14 1.28 Eastern Asiai 4.51 4.52 4.51 4.52 Eastern Europei 1.34 1.52 1.34 1.52 Northern Africai 1.07 1.08 1.07 1.08 Northern Americai 5.29 5.29 5.29 5.29 Northern Europei 2.98 2.98 2.98 2.98 South Americai 1.45 1.95 1.45 1.95
South Eastern Asiai 1.68 1.93 1.68 1.93
South Asiai 1.32 1.83 1.32 1.83 Southern Africai 1.34 1.81 1.34 1.81 Southern Europei 1.57 1.57 1.57 1.57 Western Asiai 1.24 1.36 1.24 1.36 Western Europei 2.69 2.69 2.69 2.69 Central Asiai 1.01 1.02 1.01 1.02 Basic materialsi 2.41 2.42 2.41 2.42 Industrialsi 3.17 3.22 3.17 3.22 Consumer cyclicalsi 2.94 2.97 2.94 2.97 Consumer non(cyclicals)i 2.15 2.18 2.15 2.18 Healthcarei 1.95 1.97 1.95 1.97 Technologyi 2.64 2.67 2.64 2.67 Telecommunicationsi 1.51 1.52 1.51 1.52 Utilitiesi 1.62 1.62 1.62 1.62
5. Modelling the Effect of Corporate Environmental Performance (CEP) on Corporate Financial Performance (CFP)
To examine the relationship between corporate environmental performance and corporate financial performance, we employ Equations (1) and (2) below, which combine time series of environmental performance and financial performance across firms, obtaining a panel data set:
CFPi,t=α+β1×CEPi,t−1+β3a×CashFlowi,t−1+β3b×CurrentRatioi,t−1+β4× Leveragei,t−1+β5×Lsizei,t−1+β6×R&Di,t−1+β7×Capitali,t−1+β8×Growthi,t−1+β9×
MarketSharei,t−1+β10×Industryi+β11×Regioni+ηI+εi,t
(1)
CFPi,t=α+β2a×CEPACi,t−1+β2b×CEPDECi,t−1+β3a×CashFlowi,t−1+β3b× CurrentRatioi,t−1+β4×Leveragei,t−1+β5×Lsizei,t−1+β6×R&Di,t−1+β7×Capitali,t−1+
β8×Growthi,t−1+β9×MarketSharei,t−1+β10×Industryi+β11×Regioni+ηI+εi,t
(2)
where CFPi,tis either ROA or Tobin’s Q for firm i at time t; CEPi,t−1represents corporate environmental performance for firm i at time t −1 for all companies around the world; CEPACi,t−1is corporate environmental performance at time t−1 for each firm i located in an advanced country; CEPDECi,t−1is corporate environmental performance at time t−1 for each firm i located in a developing or emerging country; CashFlowi,t−1denotes the ratio of funds from operations over net sales for firm i at time t−1; CurrentRatioi,t−1represents the slack financial resources measured by the ratio of current assets to
current liabilities for firm i at time t−1; Leveragei,t−1represents a firm’s financial risk measured by the debt-to-asset ratio; Lsizei,t−1represents the natural logarithm of total assets expressed in euros for firm i at time t−1; R&Di,t−1denotes the research and development expenses in relation to sales revenue for firm i at time t−1; Capitali,t−1indicates the capital expenditures over sales revenue for firm i at time t−1; Growthi,t−1 represents the change in annual net sales for firm i at time t− 1; MarketSharei,t−1denotes the net sales of firm i at time t−1 as a proportion of total sales in its industry; Industryidenotes a dummy variable which takes the value of 1 if the firm i belongs to the industrial sector indicated and 0 otherwise; Regioniis a dummy variable taking a value of 1 if the firm i is located in the region indicated and 0 otherwise;βare the parameters;ηiis a firm-specific fixed effect andεi,tis the error term.
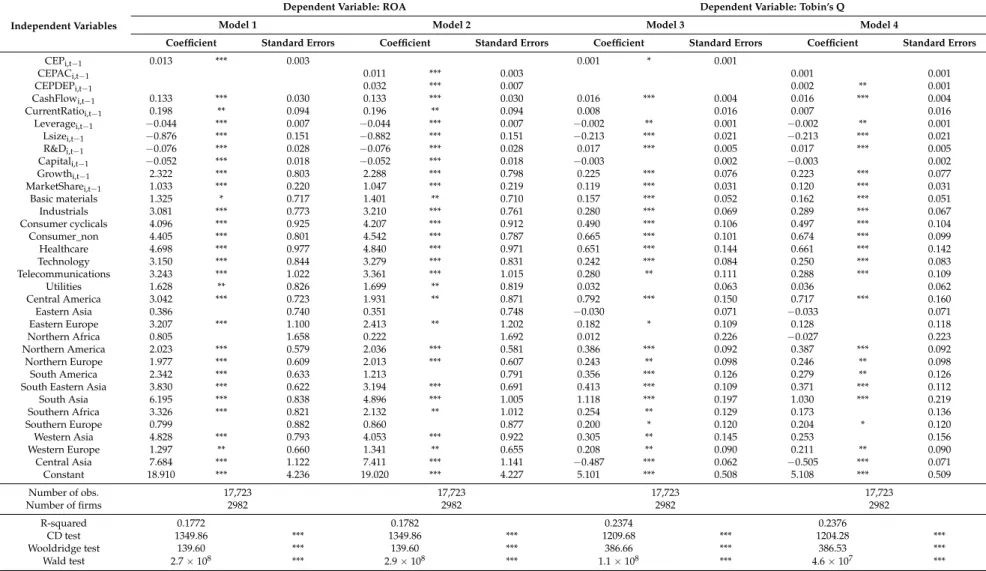
We use Petersen’s [116] approach, adjusting the standard errors for clustering by both firm and year. This technique allows us to obtain efficient and robust estimators by correcting for heteroscedasticity, serial- and cross-sectional correlation present in the residuals of all models proposed in this paper. We check the existence of heteroscedasticity in the residuals of the regression models, implementing the modified Wald test for groupwise heteroscedasticity [117,118], the results of which indicate that we must reject the null hypothesis of homoscedasticity, as shown in Table8. We also analyze the presence of serial correlation in the idiosyncratic errors, using the Wooldridge test proposed by [119,120], the results of which show first-order autocorrelation in all models, as shown in Table8. Moreover, the presence of cross-sectional dependence in the residuals of all models is detected after applying the Pesaran [121] test, as shown in Table8. Consequently, the results of the traditional fixed-effect, Fama and MacBeth, random effect and traditional OLS estimations, may be biased [116]. To overcome these three issues, we implement the Petersen [116] approach, including the industry fixed-effects in our models, using the Thomson Reuters 10-business classification and region fixed-effects and the United Nations region classification to control for industry and region-specific shocks to financial performance, respectively. Time fixed effects are not included in our model in order to avoid collinearity problems, as mentioned by [122]. To minimize simultaneity bias due to the fact that corporate financial performance and corporate environmental performance are simultaneously determined, which generates endogeneity problems, we use one-year lag explanatory variables, as in [14].
Table 8.Results of regression analysis.
Independent Variables
Dependent Variable: ROA Dependent Variable: Tobin’s Q
Model 1 Model 2 Model 3 Model 4
Coefficient Standard Errors Coefficient Standard Errors Coefficient Standard Errors Coefficient Standard Errors
CEPi,t−1 0.013 *** 0.003 0.001 * 0.001 CEPACi,t−1 0.011 *** 0.003 0.001 0.001 CEPDEPi,t−1 0.032 *** 0.007 0.002 ** 0.001 CashFlowi,t−1 0.133 *** 0.030 0.133 *** 0.030 0.016 *** 0.004 0.016 *** 0.004 CurrentRatioi,t−1 0.198 ** 0.094 0.196 ** 0.094 0.008 0.016 0.007 0.016 Leveragei,t−1 −0.044 *** 0.007 −0.044 *** 0.007 −0.002 ** 0.001 −0.002 ** 0.001 Lsizei,t−1 −0.876 *** 0.151 −0.882 *** 0.151 −0.213 *** 0.021 −0.213 *** 0.021 R&Di,t−1 −0.076 *** 0.028 −0.076 *** 0.028 0.017 *** 0.005 0.017 *** 0.005 Capitali,t−1 −0.052 *** 0.018 −0.052 *** 0.018 −0.003 0.002 −0.003 0.002 Growthi,t−1 2.322 *** 0.803 2.288 *** 0.798 0.225 *** 0.076 0.223 *** 0.077 MarketSharei,t−1 1.033 *** 0.220 1.047 *** 0.219 0.119 *** 0.031 0.120 *** 0.031 Basic materials 1.325 * 0.717 1.401 ** 0.710 0.157 *** 0.052 0.162 *** 0.051 Industrials 3.081 *** 0.773 3.210 *** 0.761 0.280 *** 0.069 0.289 *** 0.067 Consumer cyclicals 4.096 *** 0.925 4.207 *** 0.912 0.490 *** 0.106 0.497 *** 0.104 Consumer_non 4.405 *** 0.801 4.542 *** 0.787 0.665 *** 0.101 0.674 *** 0.099 Healthcare 4.698 *** 0.977 4.840 *** 0.971 0.651 *** 0.144 0.661 *** 0.142 Technology 3.150 *** 0.844 3.279 *** 0.831 0.242 *** 0.084 0.250 *** 0.083 Telecommunications 3.243 *** 1.022 3.361 *** 1.015 0.280 ** 0.111 0.288 *** 0.109 Utilities 1.628 ** 0.826 1.699 ** 0.819 0.032 0.063 0.036 0.062 Central America 3.042 *** 0.723 1.931 ** 0.871 0.792 *** 0.150 0.717 *** 0.160 Eastern Asia 0.386 0.740 0.351 0.748 −0.030 0.071 −0.033 0.071 Eastern Europe 3.207 *** 1.100 2.413 ** 1.202 0.182 * 0.109 0.128 0.118 Northern Africa 0.805 1.658 0.222 1.692 0.012 0.226 −0.027 0.223 Northern America 2.023 *** 0.579 2.036 *** 0.581 0.386 *** 0.092 0.387 *** 0.092 Northern Europe 1.977 *** 0.609 2.013 *** 0.607 0.243 ** 0.098 0.246 ** 0.098 South America 2.342 *** 0.633 1.213 0.791 0.356 *** 0.126 0.279 ** 0.126
South Eastern Asia 3.830 *** 0.622 3.194 *** 0.691 0.413 *** 0.109 0.371 *** 0.112
South Asia 6.195 *** 0.838 4.896 *** 1.005 1.118 *** 0.197 1.030 *** 0.219 Southern Africa 3.326 *** 0.821 2.132 ** 1.012 0.254 ** 0.129 0.173 0.136 Southern Europe 0.799 0.882 0.860 0.877 0.200 * 0.120 0.204 * 0.120 Western Asia 4.828 *** 0.793 4.053 *** 0.922 0.305 ** 0.145 0.253 0.156 Western Europe 1.297 ** 0.660 1.341 ** 0.655 0.208 ** 0.090 0.211 ** 0.090 Central Asia 7.684 *** 1.122 7.411 *** 1.141 −0.487 *** 0.062 −0.505 *** 0.071 Constant 18.910 *** 4.236 19.020 *** 4.227 5.101 *** 0.508 5.108 *** 0.509 Number of obs. 17,723 17,723 17,723 17,723 Number of firms 2982 2982 2982 2982 R-squared 0.1772 0.1782 0.2374 0.2376 CD test 1349.86 *** 1349.86 *** 1209.68 *** 1204.28 *** Wooldridge test 139.60 *** 139.60 *** 386.66 *** 386.53 *** Wald test 2.7×10⁸ *** 2.9×10⁸ *** 1.1×10⁸ *** 4.6×10⁷ ***
6. Results and Discussion
To estimate the direct effect of corporate environmental performance on corporate financial performance, we employ a panel data model proposed by [116]. We develop four regression models. Model 1 and model 3 report the effect of corporate environmental performance on corporate financial performance, measured by return on assets (ROA) and Tobin’s Q, respectively. Model 2 and model 4 analyze the effect of corporate environmental performance for firms located in developing and emerging countries and for firms located in advanced countries on short-term profitability (ROA) (model 2), and on long-term profitability (Tobin’s Q) in model 4. Table 8shows the results of the regression analysis, checking the hypotheses.
Hypothesis H1 predicts that firms with higher corporate environmental performance outperform firms with lower corporate environmental performance. Our results show that prior corporate environmental performance has a significant and positive effect on return on assets in model 1 (β1= 0.013,p-value < 0.01), as in [26,44], and Tobin’s Q in model 3 (β1= 0.001,p-value < 0.10), as in [25]. These results indicate that the benefits of adopting environmental activities exceed the cost derived from implementing them. Therefore, investment in environmental practices could produce a win-win situation, as suggested by [20,25]. These findings support our hypothesis H1, which is consistent with the instrumental stakeholder theory [68] and the natural-resource-based view [4,36]. This positive and significant effect is found for firms in developed and developing countries, as predicted by hypotheses H2a and H2b, when corporate financial performance is assessed by the return on asset (ROA) measure. However, this effect is stronger for firms in developing and emerging countries than for firms in developed countries in model 2 (β2a= 0.011,p-value < 0.01;β2b= 0.032,p-value < 0.01) and in model 4 (β2a= 0.001,p-value > 0.10;β2b= 0.002,p-value < 0.05), which does not support our hypothesis H2c. While one unit increase in corporate environmental performance of firms located in advanced countries generates, on average, a 1.1% increase of ROA growth rate, one unit increase in corporate environmental performance of firms located in developing and emerging countries produces, on average, a 3.2% increase of ROA growth rate, ceteris paribus. In a similar way, one unit increase in corporate environmental performance of firms located in advanced countries is associated, on average, with a 0.1% increase in Tobin’s Q, but not significant, while one unit increase in corporate environmental performance of firms located in developing and emerging countries produces, on average, a 0.2% significant increase in Tobin’s Q,ceteris paribus. This could be due to the fact that firms located in developing and emerging countries may be at an early phase of environmental activity adoption, which allows them to pick ‘low-hanging fruits’ by introducing recycling practices, switching off appliances, checking for and correcting leaks in the production processes, among others [44]. These initial practices are easy to implement, require little time and generate short-term profits with relatively little financial investment, improving firms’ return on assets (ROA). This could contribute to maintaining the good expectations for firms’ future financial performance, improving their Tobin’s Q.
Firms located in developed countries could be at a more advanced stage of environmental practice implementation that requires changes to production processes by incorporating new production technology, which involves raising capital and technology investments [44], reducing short-term benefits and, therefore, firms’ return on assets (ROA) in relation to those obtained by firms at an early phase of environmental practice implementation. These advanced environmental practices may (1) imply important costs which cannot be offset by a premium price since many consumers may not be willing to pay more for environmentally-friendly products during global financial crisis periods and/or (2) not be aligned with core business strategies and, therefore, not contribute to providing competitive advantages, because investors do not expect these firms to reach high long-term financial performance (Tobin’s Q) on adopting them. This is consistent with [48] from the instrumental stakeholder theory [68] and natural-resource-based-view [36], but inconsistent from the neoclassical economic perspective [1].
The available (slack) resources positively influence corporate financial performance as in [51]. There is a positive and significant effect of the Cash Flow variable on corporate financial performance in all models (β3a_model1 = 0.133,p-value < 0.01;β3a_model2 =−0.133,p-value < 0.01;
β3a_model3 = 0.016, p-value < 0.01; β3a_model4 = 0.016, p-value < 0.01). These results indicate that firms with high cash flow are less dependent on (1) external capital markets, which allows them to reduce financing costs and improve short-term corporate financial performance (ROA); and (2) shareholders, which allows managers to implement riskier environmental research and development projects that require long-term investment horizons [110], generating competitive advantages according to the slack resources theory [123,124] and, therefore, improving long-term corporate financial performance (Tobin’s Q).
We also find a positive and significant effect of the CurrentRatio variable on the corporate financial performance variable, as measured by return on assets (ROA) in model 1 (β3b_model1 = 0.198, p-value < 0.05) and in model 2 (β3b_model2 = 0.196,p-value < 0.05), in opposition to [14]. However, this relationship is not significant, as corporate financial performance is measured by Tobin’s Q variable in model 3 (β3b_model3 = 0.008,p-value > 0.10) and in model 4 (β3b_model4 = 0.007,p-value > 0.10), as in [14] for a similar period. These findings indicate that firms with a high current ratio outperform firms with little ability to meet immediate financial resources in the short term, because the former are able to meet their short-term payment requirements while the latter could need to increase their debts in order to ensure the payment of commitment expenses, reducing their short-term corporate financial performance (ROA). Investors could assume that this disparity between current assets and current liabilities is the consequence of a financial crisis or a temporary situation, because they do not take it into account on making their investment decisions, and therefore it does not affect long-term corporate financial performance (Tobin’s Q).
The level of leverage negatively and significantly affects corporate financial performance in all models (β4_model1 =−0.044,p-value < 0.01;β4_model2 =−0.044,p-value < 0.01;β4_model3 =−0.002, p-value < 0.05;β4_model4 =−0.002,p-value < 0.05). Thus, firms with high leverage must pay interest on their debt, which increases their financial expenses, reducing their short-term profitability (ROA). Furthermore, the high level of debt leads managers to reject (environmental) research and development projects [104] that could generate competitive advantages in the long term. The loss of research and development investment projects and the need to meet their financial obligations mean that high-leveraged firms are perceived by the market as too risky [33], which negatively influences their long-term expected profitability (Tobin’s Q). This finding is consistent with those achieved by [107].
As shown in Table8, our results show a negative and significant relationship between firm size and corporate financial performance variables in all models (β5_model1 =−0.876,p-value < 0.01; β5_model2 = −0.882, p-value < 0.01; β5_model3 = −0.213, p-value < 0.01; β5_model4 = −0.213, p-value < 0.01). Thus, the largest firms obtain the worst financial performance. We can explain this result in two ways. On the one hand, the largest firms could have diseconomies of scale in their operations. On the other hand, the lack of flexibility prevents the largest firms from making rapid changes in their structures, systems and values to adapt them to industry shocks generated by the economic crisis [125,126]. This finding is consistent with [127].
We also find (1) a positive and significant effect of research and development expenditure relative to the sales variable on corporate financial performance measured by Tobin’s Q in model 3 (β6_model3 = 0.017,p-value < 0.01) and model 4 (β6_model4 = 0.017,p-value < 0.01); and (2) a negative and significant influence of research and development expenditure relative to the sales variable on return on assets (ROA) in model 1 (β6_model1 =−0.076,p-value < 0.01) and model 2 (β6_model2 =−0.076,p-value < 0.01), as in [47]. Firms with higher investments in (environmental) research and development projects improve their long-term corporate financial performance as mentioned by [128,129], but decrease their short-term corporate financial performance, as pointed out by [130]. This could be because (environmental) research and development projects led by firms in our sample require initially high investments, which increases costs for firms, reducing their profits and, therefore, their short-term profitability (ROA). The benefits of these (environmental) projects materialize in the long term [131], since these R&D projects allow firms to enhance their knowledge and, subsequently, their product and process innovation [132], generating long-term value creation