Identification of Bacteria by Matrix-Assisted Laser Desorption
Ionization–Time of Flight Mass Spectrometry
Delphine Martiny,aLaurent Busson,aIngrid Wybo,bRachid Ait El Haj,aAnne Dediste,aand Olivier Vandenberga,c Department of Microbiology, Saint-Pierre University Hospital & Jules Bordet Institute, Brussels, Belgiuma
; Department of Microbiology and Infection Control, Universitair Ziekenhuis Brussel, Vrije Universiteit Brussel, Brussels, Belgiumb
; and Infectious Diseases Epidemiological Unit, Public Health School, Université Libre de Bruxelles, Brussels, Belgiumc
This study compared the performance of three matrix-assisted laser desorption ionization–time of flight mass spectrometry sys-tems: Microflex LT (Bruker Daltonics, Bremen, Germany), Vitek MS RUO (Axima Assurance-Saramis database; bioMérieux, Marcy l’Etoile, France), and Vitek MS IVD (bioMérieux). A total of 1,129 isolates, including 1,003 routine isolates, 73 anaerobes, and 53 bacterial enteropathogens, were tested on the Microflex LT and Axima Assurance devices. The spectra were analyzed us-ing three databases: Biotyper (Bruker Daltonics), Saramis, and Vitek MS (bioMérieux). Among the routine isolates requirus-ing
identification to the species level (nⴝ986), 92.7% and 93.2% were correctly identified by the Biotyper and Vitek MS databases,
respectively. The Vitek MS database is more specific for the identification ofStreptococcus viridans. For the anaerobes, the
Bio-typer database often identifiedFusobacteriumisolates to only the genus level, which is of low clinical significance, whereas 20%
of theBacteroidesspecies were not identified or were misidentified by the Vitek MS database. For the enteropathogens, the poor
discrimination betweenEscherichia coliandShigellaexplains the high proportion of unidentified organisms. In contrast to the
Biotyper database, the Vitek MS database properly discriminated all of theSalmonella entricaserovar Typhi isolates (nⴝ5).
The performance of the Saramis database was globally poorer. In conclusion, for routine procedures, the Microflex LT and Vi-tek-MS systems are equally good choices in terms of analytical efficiency. Other factors, including price, work flow, and lab activ-ity, will affect the choice of a system.
F
or decades, potentially pathogenic bacteria have routinelybeen identified in clinical laboratories using biochemical and phenotypic analyses, which usually require a time commitment ranging from a few hours to several days. Manual analyses are time-consuming, and semiautomated methods require large amounts of biological material, which can be a major disadvan-tage for the identification of fastidious microorganisms. Molecu-lar methods have been demonstrated to have complementary value, but they are not practical for routine use due to their high cost.
The first studies regarding the identification of bacteria by ma-trix-assisted laser desorption ionization–time of flight mass spec-trometry (MALDI-TOF MS) were conducted toward the end of the 1990s (13). However, many years passed before the first com-mercial applications of this technology became available; this de-lay was due primarily to the lack of robust informatic tools and efficient databases. The technology was first made available as a research tool (20, 21), and it was commercialized for use in private and public laboratories in 2008.
An abundant collection of literature now highlights the many benefits that result from the use of this technology. Using only a small portion of a colony and a drop of matrix solution, MALDI-TOF MS can accurately identify bacteria within a few minutes at a moderate cost (25, 30, 31). Although the technique has proven to be valuable for the identification of common bacteria, numerous studies have recently shown that it is a promising tool that can also be used for species that are usually difficult to identify, such as yeasts, anaerobes, and fastidious microorganisms (2, 3, 12, 16, 17, 22, 32). The ability of MALDI-TOF MS to directly identify
bacte-ria in positive blood cultures also enhances the quality of patient management (11, 15, 19, 33, 34).
Therefore, MALDI-TOF MS is an important new technology and medical microbiologists are aware that this tool will revolu-tionize their practice and will soon replace most of the traditional identification methods (4, 6, 27).
In our laboratory, the Microflex LT system was first
imple-mented as a diagnostic method for ourCampylobacterNational
Reference Center activity (22). Since December 2010, it has been used as our main diagnostic method and has allowed us to rou-tinely identify more than 90% of the bacterial isolates in our clin-ical samples.
Until April 2011, only Bruker Daltonics had commercialized a Conformité Européenne (CE)-marked MALDI-TOF MS system. In Europe, two manufacturers are now commercializing research
use only (RUO) andin vitrodiagnostic (IVD) MALDI-TOF MS
systems.
The main aim of this study was to evaluate and compare the performance of these systems in terms of their analytical accuracy
Received4 October 2011Returned for modification4 November 2011 Accepted28 January 2012
Published ahead of print8 February 2012
Address correspondence to Delphine Martiny, delphine_martiny@stpierre-bru.be.
Supplemental material for this article may be found athttp://jcm.asm.org/. Copyright © 2012, American Society for Microbiology. All Rights Reserved.
doi:10.1128/JCM.05971-11
on May 16, 2020 by guest
http://jcm.asm.org/
and practicality to determine which system is the best option for use in a routine bacteriology laboratory.
MATERIALS AND METHODS
Population.The specimens tested were collected from hospitalized and ambulatory patients at the Jules Bordet Institute and Saint-Pierre Univer-sity Hospital in Brussels, Belgium.
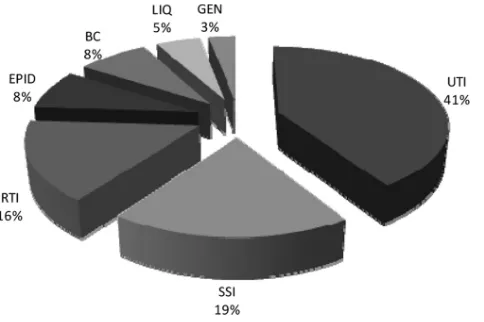
Bacterial isolates.From January to March 2011, a random selection of bacterial isolates that were recovered from multiple clinical sources, in-cluding wounds, urine, blood, tissue, biopsy specimens, and the respira-tory tract, were prospectively included in this study. The distribution of the origins of the isolates is summarized in Fig. 1.
The samples were cultured using a variety of medium types that are traditionally used in our practice, including cystine lactose electrolyte-deficient, methicillin-resistantStaphylococcus aureus, Columbia, Mac-Conkey, mannitol, and chocolate agars. For the two most frequently iso-lated species, the percentage of correct species identification was evaluated for each culture medium and is presented in Fig. 2.
All of the specimens were incubated overnight at 36⫾1°C. In addition to this random selection, collection strains were added to ensure the coverage of anaerobes and enteric pathogens. The isolates of both panels were stored frozen prior to their identification.
The anaerobe panel, previously collected in a university hospital for a susceptibility survey, included 75 strains covering 28 species of 13 differ-ent genera (8). Although the anaerobes were of various origins, they were derived primarily from blood cultures and abdominal samples. After thawing, the isolates were subcultured twice on Schaedler 5% sheep blood agar (BD, Franklin Lakes, NJ) and incubated for 48 h at 36⫾1°C under anaerobic conditions with an Anoxomat WS 80 device (Mart BV, Lich-tenvoorde, The Netherlands). Two strains (one ofCampylobacter rectus
and one ofClostridium septicum) were not recovered from this panel (dead strains).
The enteropathogen panel included 53 strains that were received in the context of routine activities or as quality controls. This panel covered 20 species of 10 different genera. Most of the isolates were recovered from stool samples, with the exception of oneAeromonas veroniistrain that was isolated from a rectal biopsy specimen. The strains were subcultured twice onto selective medium or Columbia agar, depending on the species.
Routine identification.Following Gram staining, the first identifica-tion method that was used was MALDI-TOF MS performed on an RUO Microflex LT (Bruker Daltonics). If the resulting identification was not included in the validation file (see the supplemental material) or the iden-tification score was poor (⬍2), traditional methods such as biochemical tests, API, or the Vitek system (bioMérieux) were used. In cases of uncer-tain identification, molecular methods were also used (see the supplemen-tal material). Anaerobes were previously identified by gas-liquid chro-matographic analysis of their cellular fatty-acid composition using the microbial identification system; if needed, this procedure was comple-mented with biochemical and enzymatic tests. Enteropathogenic species were identified using biochemical and serological tests or commercial methods (API system, Vitek card). Moreover, most of the strains were submitted to national reference laboratories (see the supplemental mate-rial).
MALDI-TOF MS analysis.For the purposes of this study, all of the isolates were smeared in double deposit by the same operator for both the Microflex LT and Axima Assurance analyses. No extraction with formic acid was performed. The spectra acquired using the Microflex LT system were analyzed with the Biotyper spectral database. The spectra acquired with the Axima Assurance system were first analyzed with the Saramis database (Vitek MS RUO system) and thereafter with the Vitek MS data-base (Vitek MS IVD system).
Bruker Daltonics MALDI-TOF MS analysis.The “direct transfer” procedure recommended by the manufacturer was used to identify strains with the Microflex LT. A portion of a colony in the exponential growth phase was smeared onto a 96-well target plate, and after drying, it was covered using 1l of␣-cyano-4-hydroxycinnamic acid (CHCA) matrix solution. When it was dry, the target plate was loaded into the machine, FIG 1Distribution of the origins of the 1,003 routine isolates tested in this
study. RTI, respiratory tract infections; SSI, skin and soft tissue infections; LIQ, normally sterile body fluids; UTI, urinary tract infections; EPID, epidemiolog-ical samples (methicillin-resistantS.aureusand extended-spectrum -lacta-mase screening); GEN, genital tract infections; BC, blood cultures.
FIG 2Influence of the growth medium on the percentage of correct species identifications for the two most frequently isolated species. CAP, colistin aztreonam blood agar plate; CLED, cystine lactose electrolyte-deficient agar; COL, Columbia agar; ESBL, chromogenic screening plate for the detection of extended-spectrum-lactamase-producing organisms; MAC, MacConkey agar; MAN, mannitol agar; MRSA, chromogenic screening plate for detection of methicillin-resistantS.aureus.
on May 16, 2020 by guest
http://jcm.asm.org/
[image:2.585.44.286.65.226.2] [image:2.585.51.539.545.683.2]which was equipped with a 337-nm nitrogen laser. The spectra were re-corded in the linear mode in a mass range of 2 to 20 kDa and subsequently analyzed using MALDI Biotyper Automation Control and Biotyper 2.0 software. At the time, the database included 3,740 spectra from 319 genera and 1,946 species. This database exists as both an IVD and an RUO tool; however, only the latter system was used in this study. Because the data-base (Biotyper) is the same in both configurations, the results would have been the same if they had been derived from the IVD version. Both the anaerobic and enteropathogenic isolates were analyzed using the MALDI Biotyper Realtime Classification and Biotyper 3.0 software. Compared with the previous version, the Biotyper 3.0 software provides additional information on the isolate identification via the “matching hints” func-tion. Some identification results are accompanied by a comment inform-ing the user of the limitations of the technique (e.g., species that are diffi-cult to discriminate, species included in the same bacterial complex or group, species for which additional tests are needed. . .). The complete list of matching hints is provided by the manufacturer upon request. At that time, the database included 3,995 entries. For some enteropathogens (Vibrio,Yersinia,Salmonella), the spectra were also compared with the security-relevant (SR) database (data not shown).
bioMérieux MALDI-TOF MS analyses.bioMérieux MALDI-TOF MS analyses were performed according to the manufacturer’s instruc-tions. The methodology was the same as for the Microflex LT system. Briefly, a portion of a fresh colony was smeared onto a FlexiMass dispos-able target plate and then immediately covered with 1l of ready-to-use CHCA matrix solution. After drying, the target plate was loaded into the Axima Assurance mass spectrometer (Shimadzu Corporation, Kyoto, Ja-pan). Spectra were generated using the Launchpad v2.8 software program and compared to the Saramis database (originally developed by Anagnos-Tec, Golm, Germany), which contained reference spectra for 1,288 bac-teria, 2 algae, and 258 fungi; it also contained SuperSpectra for 878 species. SuperSpectra are computed from typical strains covering more than 90% of the intraspecific diversity in most species. Reference spectra correspond to all of the spectra obtained with the different isolates included in Sara-mis. Each spectrum of a tested sample is matched against the SuperSpectra database. Peak matches that yield identification results with confidence values exceeding 80% are considered significant and displayed. The soft-ware also tests for homology to reference spectra using a compare mode in the case of a confidence value below 80%.
This Axima Assurance system with Saramis is now called Vitek MS RUO. In a second step, spectra were exported and sent to the manufac-turer on a USB key device for blind analysis using the Vitek MS IVD v1 database. At the time, this database included more than 25,000 spectra covering 586 species.
Data analysis.The identification criteria were chosen according to the cutoffs proposed by the manufacturers. For Biotyper, identifications with scores above 2 and between 1.7 and 2 were considered to be reliable at the species and genus levels, respectively. Identification scores below 1.7 were considered unacceptable.
Saramis database results were evaluated according to a colored index: green for percentages equal to or above 90%, yellow for those between 85 and 89.9%, and white for those below 85%. All of the identifications to the genus or species level that fell into the green zone, with a score above 90%, were considered reliable. Scores between 80 and 90% were also considered for acceptable identifications. A cutoff of 90% was chosen for Vitek MS. However, in cases of “low discrimination,” two results are provided for the same isolate, sometimes with a score above 90%. In these cases, the identification was often considered reliable only at the genus level (if both results showed the same genus identification) or was included in a com-plex because an accurate species identification was not clinically needed, e.g., theEnterobacter cloacaecomplex (see the supplemental material). Any identification of bacteria belonging to this complex was considered correct according to the respective cutoff values of the systems.
Classification.According to the confidence levels of the three software programs and the previously determined identification, results obtained from the three databases were classified into the following categories: “correct identification of genus and species,” “correct identification of genus,” “no identification,” “misidentification at the species level,” and “misidentification at the genus level.” “Not identified” organisms in-cluded organisms that could not be identified by the technique. The or-ganisms that were unreliably identified (either with an unacceptable score value or with a comment suggesting low genus discrimination, i.e., Esch-erichia coliversusShigella) were also classified in this category, even if the identification was correct. For each isolate, the top score of the two sepa-rate spots was taken into account. The classification of the results obtained for routine isolates, anaerobes, and enteric pathogens are presented in summary Tables 1 to 4.
Discrepancies.The first response to a discrepancy was to repeat the analysis using both the Microflex LT and Vitek MS systems to eliminate the possibility of contamination. The remaining discrepancies were re-solved by performing additional biochemical and molecular tests (see the supplemental material).
Statistical methods.McNemar’s chi square or exact binomial test was used to compare the results obtained by both methods with the same samples. These results are presented in summary Table 5. A Fisher test was used to evaluate the impact of the medium used on the quality of theE.coli
[image:3.585.39.549.78.251.2]andS.aureusidentifications, respectively. TABLE 1MALDI-TOF MS results for 17 strains requiring identification only to genus level
IDa(no. [%] of isolates)
Saramis Biotyper Vitek MS
No. of correct genus IDs
No. without ID
No. misidentified
No. of correct genus IDs
No. without ID
No. misidentified
No. of correct genus IDs
No. without ID
No. misidentified
Micrococcussp. (2 [11.8]) 2 0 0 2 0 0 2 0 0
Corynebacteriumsp. (5 [29.4]) 1 4 0 3 2 0 2 3 0
Actinomycessp. (1 [5.9]) 0 1 0 1 0 0 0 1 0
Pseudomonassp. (1 [5.9]) 0 1 0 1 0 0 1 0 0
Neisseriasp. (1 [5.9]) 0 1 0 1 0 0 1 0 0
Chryseobacteriumsp. (1 [5.9]) 1 0 0 1 0 0 1 0 0
Coagulase-negativeStaphylococcus
sp. (1 [5.9])
1 0 0 1 0 0 1 0 0
Beta-hemolytic group C, G
Streptococcussp. (5 [29.4])
3 2 0 5 0 0 5 0 0
Total (17) [100.0] 8 (47.1) 9 (52.9) 0 (0.0) 15 (88.2) 2 (11.8) 0 (0.0) 13 (76.5) 4 (23.5) 0 (0.0)
a
ID, identification.
on May 16, 2020 by guest
http://jcm.asm.org/
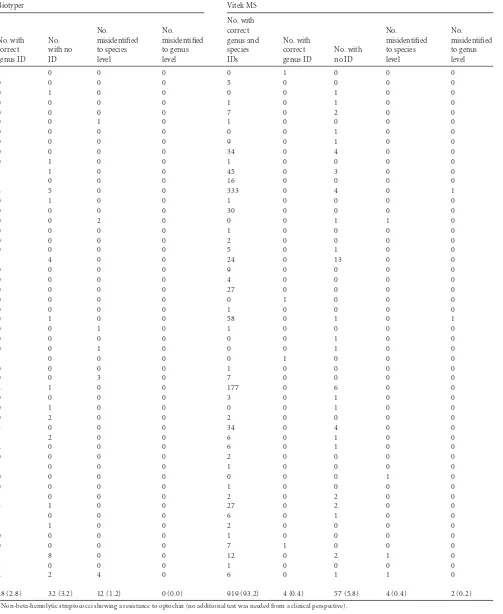
TABLE 2MALDI-TOF MS results for 986 strains requiring identification to species level
Genus and species/serovar
No. of isolates
% of isolates
Saramis Biotyper
No. with correct genus and species IDs
No. with correct genus ID
No. with no ID
No. misidentified to species level
No. misidentified to genus level
No. with correct genus and species IDs
Achromobacter xylosoxidans 1 0.1 0 0 1 0 0 0
Acinetobacter baumannii 5 0.5 3 0 2 0 0 5
Citrobacter lwoffii 1 0.1 0 0 1 0 0 0
Citrobacter freundii 2 0.2 0 2 0 0 0 2
Citrobacter koseri 9 0.9 0 7 2 0 0 9
Corynebacterium pseudodiphtheriticum 1 0.1 1 0 0 0 0 0
Delftia acidovorans 1 0.1 0 0 1 0 0 1
Enterobacter aerogenes 10 1.0 8 0 2 0 0 10
Enterobacter cloacae 38 3.9 15 1 22 0 0 38
Enterobacter avium 1 0.1 1 0 0 0 0 0
Enterobacter faecalis 48 4.9 44 0 4 0 0 46
Enterobacter faecium 16 1.6 15 0 1 0 0 15
Escherichia coli 338 34.5 302 0 36 0 0 329
Gardnerella vaginalis 1 0.1 1 0 0 0 0 0
Haemophilus influenzae 30 3.1 25 0 5 0 0 30
Haemophilus parainfluenzae 2 0.2 1 0 0 1 0 0
Haemophilus parahaemolyticus 1 0.1 1 0 0 0 0 1
Hafnia alvei 2 0.2 2 0 0 0 0 2
Klebsiella oxytoca 6 0.6 4 0 2 0 0 6
Klebsiella pneumoniae 37 3.8 27 0 10 0 0 32
Moraxella catarrhalis 9 0.9 4 0 5 0 0 9
Morganella morganii 4 0.4 4 0 0 0 0 4
Proteus mirabilis 27 2.8 27 0 0 0 0 27
Proteus vulgaris 1 0.1 0 1 0 0 0 1
Providencia stuartii 1 0.1 1 0 0 0 0 1
Pseudomonas aeruginosa 60 6.1 57 0 3 0 0 59
Pseudomonas fluorescens 1 0.1 0 0 1 0 0 0
Roultella ornitholytica 1 0.1 0 0 1 0 0 1
Roultella planticola 1 0.1 0 0 1 0 0 0
SalmonellaTyphi 1 0.1 0 1 0 0 0 0
Serratia liquefaciens 1 0.1 1 0 0 0 0 1
Serratia marcescens 7 0.7 5 0 2 0 0 4
Staphylococcus aureus 183 18.7 183 0 0 0 0 180
Staphylococcus capitis 4 0.4 1 0 3 0 0 4
Staphylococcus chromogenes 1 0.1 0 0 1 0 0 0
Staphylococcus cohnii 2 0.2 0 0 2 0 0 0
Staphylococcus epidermidis 38 3.9 38 0 0 0 0 35
Staphylococcus haemolyticus 7 0.7 5 0 2 0 0 4
Staphylococcus hominis 7 0.7 7 0 0 0 0 5
Staphylococcus lugdunensis 2 0.2 2 0 0 0 0 2
Staphylococcus saprophyticus 1 0.1 1 0 0 0 0 0
Staphylococcus schleiferi 1 0.1 0 0 0 1 0 1
Staphylococcus simulans 1 0.1 0 0 1 0 0 1
Stenotrophomonas maltophilia 4 0.4 3 0 1 0 0 3
Streptococcus agalactiae 29 3.0 27 0 2 0 0 25
Streptococcus anginosus 7 0.7 0 6 1 0 0 6
Streptococcus constellatus 2 0.2 0 2 0 0 0 0
Streptococcus gordonii 1 0.1 1 0 0 0 0 1
Streptococcus pyogenes 8 0.8 5 0 3 0 0 8
Streptococcus pneumoniae 15 1.5 2 7 6 0 0 6
Streptococcus porcinus 1 0.1 0 0 1 0 0 0
Streptococcus viridansa 8 0.8 2 4 1 1 0 0
Total no. (%) 986 100.0 826 (83.8) 31 (3.1) 126 (12.8) 3 (0.3) 0 (0.0) 914 (92.7)
(Continued on next page)
on May 16, 2020 by guest
http://jcm.asm.org/
TABLE 2(Continued)
Biotyper Vitek MS
No. with correct genus ID
No. with no ID
No. misidentified to species level
No. misidentified to genus level
No. with correct genus and species IDs
No. with correct genus ID
No. with no ID
No. misidentified to species level
No. misidentified to genus level
1 0 0 0 0 1 0 0 0
0 0 0 0 5 0 0 0 0
0 1 0 0 0 0 1 0 0
0 0 0 0 1 0 1 0 0
0 0 0 0 7 0 2 0 0
0 0 1 0 1 0 0 0 0
0 0 0 0 0 0 1 0 0
0 0 0 0 9 0 1 0 0
0 0 0 0 34 0 4 0 0
0 1 0 0 1 0 0 0 0
1 1 0 0 45 0 3 0 0
1 0 0 0 16 0 0 0 0
4 5 0 0 333 0 4 0 1
0 1 0 0 1 0 0 0 0
0 0 0 0 30 0 0 0 0
0 0 2 0 0 0 1 1 0
0 0 0 0 1 0 0 0 0
0 0 0 0 2 0 0 0 0
0 0 0 0 5 0 1 0 0
1 4 0 0 24 0 13 0 0
0 0 0 0 9 0 0 0 0
0 0 0 0 4 0 0 0 0
0 0 0 0 27 0 0 0 0
0 0 0 0 0 1 0 0 0
0 0 0 0 1 0 0 0 0
0 1 0 0 58 0 1 0 1
0 0 1 0 1 0 0 0 0
0 0 0 0 0 0 1 0 0
0 0 1 0 0 0 1 0 0
1 0 0 0 0 1 0 0 0
0 0 0 0 1 0 0 0 0
0 0 3 0 7 0 0 0 0
2 1 0 0 177 0 6 0 0
0 0 0 0 3 0 1 0 0
0 1 0 0 0 0 1 0 0
0 2 0 0 2 0 0 0 0
3 0 0 0 34 0 4 0 0
1 2 0 0 6 0 1 0 0
2 0 0 0 6 0 1 0 0
0 0 0 0 2 0 0 0 0
1 0 0 0 1 0 0 0 0
0 0 0 0 0 0 0 1 0
0 0 0 0 1 0 0 0 0
1 0 0 0 2 0 2 0 0
3 1 0 0 27 0 2 0 0
1 0 0 0 6 0 1 0 0
1 1 0 0 2 0 0 0 0
0 0 0 0 1 0 0 0 0
0 0 0 0 7 1 0 0 0
1 8 0 0 12 0 2 1 0
1 0 0 0 1 0 0 0 0
2 2 4 0 6 0 1 1 0
28 (2.8) 32 (3.2) 12 (1.2) 0 (0.0) 919 (93.2) 4 (0.4) 57 (5.8) 4 (0.4) 2 (0.2)
a
Non-beta-hemolytic streptococci showing a resistance to optochin (no additional test was needed from a clinical perspective).
on May 16, 2020 by guest
http://jcm.asm.org/
TABLE 3 MALDI-TOF MS results for 73 anaerobic strains a Genus and species No. (%) of isolates Saramis Biotyper Vitek MS No. with
correct genus and species IDs
No. with correct genus ID No. with no ID
No. misidentified to
species
level
No. misidentified to
genus
level
No.
with
correct genus and species IDs
No. with correct genus ID No. with no ID
No. misidentified to
species
level
No. misidentified to
genus
level
No.
with
correct genus and species IDs
No. with correct genus ID No. with no ID
No. misidentified to
species
level
No. misidentified to
genus level Bacteroides caccae 2 (2.7) 0 0 2 0 0 2000 0 20 00 0 Bacteroides fragilis 14 (19.2) 3 0 11 0 0 14 0 0 0 0 14 0 0 0 0 Bacteroides ovatus 4 (5.5) 0 0 4 0 0 4000 0 30 01 0 Bacteroides thetaiotaomicron 8 (11.0) 0 0 8 0 0 8000 0 61 10 0 Bacteroides vulgatus 3 (4.1) 0 0 3 0 0 3000 0 10 20 0 Bacteroides xylanisolvens 1 (1.4) 0 0 1 0 0 0001 0 00 01 0 Bilophila wadsworthia 1 (1.4) 0 0 1 0 0 0100 0 00 10 0 Campylobacter rectus 1 (1.4) 0 0 1 0 0 0100 0 00 10 0 Clostridium clostridioforme 2 (2.7) 0 0 2 0 0 1100 0 00 10 1 Clostridium perfringens 2 (2.7) 2 0 0 0 0 2000 0 20 00 0 Clostridium ramosum 1 (1.4) 1 0 0 0 0 0010 0 10 00 0 Eggerthella lenta 4 (5.5) 0 0 4 0 0 2020 0 40 00 0 Fusobacterium necrophorum 5 (6.8) 1 0 4 0 0 2300 0 40 10 0 Fusobacterium nucleatum 5 (6.8) 0 0 5 0 0 0320 0 50 00 0 Fusobacterium varium 2 (2.7) 0 0 2 0 0 0200 0 20 00 0 Parabacteroides distasonis 2 (2.7) 0 0 2 0 0 2000 0 00 20 0 Parvimonas micra 4 (5.5) 0 0 4 0 0 1300 0 40 00 0 Peptoniphilus harei 1 (1.4) 0 0 1 0 0 1000 0 00 10 0 Peptoniphilus ivorii 1 (1.4) 0 0 1 0 0 0010 0 00 10 0 Peptostreptococcus species 1 (1.4) 0 0 1 0 0 0010 0 00 10 0 Prevotella bivia 1 (1.4) 0 0 1 0 0 1000 0 00 10 0 Prevotella buccae 2 (2.7) 0 0 2 0 0 2000 0 20 00 0 Prevotella denticola 1 (1.4) 0 0 1 0 0 0010 0 10 00 0 Prevotella intermedia / nigrescens 2 (2.7) 0 0 2 0 0 0110 0 11 00 0 Propionibacterium acnes 1 (1.4) 0 0 1 0 0 0010 0 10 00 0 Veillonella parvula 2 (2.7) 0 0 2 0 0 0101 0 20 00 0 Total no. (%) 73 (100.0) 7 (9.6) 0 (0.0) 66 (90.4) 0 (0.0) 0 (0.0) 45 (61.6) 16 (21.9) 10 (13.7) 2 (2.7) 0 (0.0) 55 (75.3) 2 (2.7) 13 (17.8) 2 (2.7) 1 (1.4) aTwo dead strains (one C . rectus ,one C . septicum ).
on May 16, 2020 by guest
http://jcm.asm.org/
TABLE 4 MALDI-TOF MS results for 53 enteropathogenic strains Genus and species/serovar No. (%) of isolates Saramis Biotyper Vitek MS No. with correct genus and species IDs No. with correct genus ID No. with no ID No. misidentified to species level No. misidentified to genus level No. with correct genus and species IDs No. with correct genus ID No. with no ID No. misidentified to species level No. misidentified to genus level No. with correct genus and species IDs No. with correct genus ID No. with no ID No. misidentified to species level No. misidentified to genus level Aeromonas veronii 1 (1.9) 0 0 1 0 0 0 1 0 0 0 1 0 0 0 0 Arcobacter butzleri 1 (1.9) 0 0 1 0 0 0 1 0 0 0 0 0 1 0 0 Campylobacter coli 3 (5.7) 0 0 3 0 0 3 0 0 0 0 3 0 0 0 0 Campylobacter fetus 1 (1.9) 1 0 0 0 0 1 0 0 0 0 1 0 0 0 0 Campylobacter jejuni 5 (0.4) 3 0 2 0 0 5 0 0 0 0 5 0 0 0 0 Campylobacter lari 2 (3.8) 0 0 2 0 0 2 0 0 0 0 2 0 0 0 0 Clostridium difficile 11 (20.8) 6 0 5 0 0 11 0 0 0 0 11 0 0 0 0 Escherichia coli O157 (nontoxinogenic) 2 (3.8) 0 0 2 0 0 2 0 0 0 0 2 0 0 0 0 Plesiomonas shigelloides 1 (1.9) 1 0 0 0 0 0 1 0 0 0 1 0 0 0 0 Salmonella Durban 2 (3.8) 0 1 1 0 0 0 1 0 1 0 0 2 0 0 0 Salmonella Enteritidis 1 (1.9) 0 0 1 0 0 0 1 0 0 0 0 1 0 0 0 Salmonella Newport 1 (1.9) 0 0 1 0 0 0 1 0 0 0 0 1 0 0 0 Salmonella Saint-Paul 1 (1.9) 0 1 0 0 0 0 1 0 0 0 0 1 0 0 0 Salmonella Typhi 5 (9.4) 0 0 5 0 0 0 4 0 1 0 5 0 0 0 0 Salmonella Typhimurium 5 (9.4) 0 0 5 0 0 0 4 0 1 0 0 5 0 0 0 Shigella boydii 1 (1.9) 0 0 1 0 0 0 0 1 a 0 0 001 a 00 Shigella flexneri 4 (7.5) 0 0 3 0 1 0 0 4 a 0 0 004 a 00 Shigella sonnei 2 (3.8) 0 0 0 0 2 0 0 2 a 0 0 002 a 00 Vibrio cholerae 2 (3.8) 0 0 2 0 0 0 2 0 0 0 2 0 0 0 0 Yersinia enterocolitica 2 (3.8) 0 0 2 0 0 2 0 0 0 0 2 0 0 0 0 Total no. (%) 53 (100) 11 (20.8) 2 (3.8) 37 (70.0) 0 (0.0) 3 (5.7) 26 (49.1) 17 (32.1) 7 (13.2) 3 (5.7) 0 (0.0) 35 (66.0) 10 (18.9) 8 (15.1) 0 (0.0) 0 (0.0) a All Shigella species were misidentified as E . coli by both Vitek MS and Biotyper. However, a comment denouncing the poor discrimination between these organisms was provided. These isolates were thus classified as unidentified instead of misidentified.
on May 16, 2020 by guest
http://jcm.asm.org/
[image:7.585.149.432.67.728.2]Practical points.To compare the practical strengths and weaknesses of the three systems, we also considered the time required for the analysis. The time needed to identify 96 bacterial strains was evaluated for both the Microflex LT and Vitek MS RUO systems. This evaluation was conducted when the systems were working concurrently on the same strains.
Other practical considerations, including price, the difficulty of the method, the ease of use of the software, and the ability to use the device in a standard laboratory, were included in our comparison and are presented in summary Table 6. All of the practical considerations related to the use of the Vitek MS IVD system were assessed thanks to training organized in the research and development laboratory of the manufacturer.
RESULTS
Among the 1,003 routine isolates included in the study, which included 52 bacterial species of 27 different genera, 986 were iden-tified to the species level for clinical purposes. For the 17 remain-ing organisms, identification to the genus level was sufficiently informative for our routine practice. Most of the latter organisms were considered to be contaminants (e.g., corynebacteria,
micro-cocci, andPseudomonasspp. other thanPseudomonas aeruginosa).
The results obtained from the three databases (Biotyper, Sara-mis, and Vitek MS) for the strains requiring identification to the genus or species level are presented in Tables 1 and 2, respectively.
For a comparison of the results obtained by the three systems, see Table 5.
For the bacterial strains that are routinely identified to the
ge-nus level (n⫽17), 88.2%, 76.5% and 47.1% of the isolates were
correctly identified by the Biotyper, Vitek MS, and Saramis data-bases, respectively. Most of the corynebacteria were not identified by the Saramis and Vitek MS systems; this was also the case for one
Actinomycesspecies, which was recognized by the Biotyper system.
The percentages of strains remaining unidentified by the Biotyper, Vitek MS, and Saramis systems were 11.8%, 23.5%, and 52.9%, respectively. No invalid identifications were observed.
Among the 986 isolates that are routinely identified to the spe-cies level, 92.7%, 93.2%, and 83.8% (cutoff at 90%) were correctly identified to the species level by the Biotyper, Vitek MS, and Sara-mis systems, respectively. The rates of correct species
identifica-tion by the Biotyper and Vitek MS databases were similar (P⫽
0.608), whereas that of the Saramis database was significantly
poorer (P⬍0.001). Only two false identifications at the genus
level were observed, and both occurred with the Vitek MS system;
oneE.coliisolate was identified asKlebsiella oxytoca, andP.
[image:8.585.43.542.77.426.2]aerugi-nosafrom a respiratory sample was identified asNeisseria subflava.
TABLE 5Comparison of the results obtained using the three systems
System and application (no. of isolates tested) IDb
Saramis Biotyper
% Correctly identified Pvalue % Correctly identified Pvalue
Biotyper
Routine (986)a 1 83.8 vs 92.7 ⬍0.001 NAd NA
1⫹2 86.9 vs 95.5 ⬍0.001 NA NA
3 12.8 vs 3.2 ⬍0.001 NA NA
4 0.3 vs 1.2 ⬍0.01 NA NA
Enteric pathogens (53 [all]) 1 20.8 vs 49.1 ⬍0.001 NA NA
Anaerobes (73 [all]) 1 9.6 vs 61.6 ⬍0.001 NA NA
Vitek MS
Routine (986)a 1 83.8 vs 93.2 ⬍0.001 92.7 vs 93.2 0.608
1⫹2 86.9 vs 93.6 ⬍0.001 95.5 vs 93.6 ⬍0.05
3 12.8 vs 5.8 ⬍0.001 3.2 vs 5.8 ⬍0.01
4 0.3 vs 0.4 1 1.2 vs 0.4 ⬍0.05
S.pneumoniae(15) 1 NDc ND 40.0 vs 80.0 0.070
S.viridans(8) 1 ND ND 0 vs 75 ⬍0.05
S.pneumoniae⫹S.viridans(23) 1 ND⫹ ND 26.1 vs 78.3 ⬍0.01
All enteric pathogens (53) 1 20.8 vs 66.0 ⬍0.001 49.1 vs 66.0 ⬍0.01
1⫹2 ND ND 81.1 vs 84.9 0.625
3 ND ND 13.2 vs 15.1 1
4 ND ND 5.7 vs 0 0.25
S. Typhi (5) 1 ND ND 0 vs 100 0.0625
AllSalmonellaspp. (15) 1 ND ND 0 vs 33.3 0.0625
All anaerobes (73) 1 9.6 vs 75.3 ⬍0.001 61.6 vs 75.3 0.068
1⫹2 ND ND 83.6 vs 78.1 0.522
3 ND ND 13.7 vs 17.8 0.491
4 ND ND 2.7 vs 2.7 1
Bacteroidesspecies (32) 1 ND ND 96.9 vs 78.1 ⬍0.05
Fusobacteriumspecies (12) 1 ND ND 16.7 vs 91.7 ⬍0.01
1⫹2 ND ND 58.3 vs 91.7 0.125
aAll isolates that needed to be identified to the species level. b
ID, identification; 1, correct ID of genus and species; 2, correct ID of genus; 3, no ID; 4, misidentification to species level. cND, not done.
d
NA, no application.
on May 16, 2020 by guest
http://jcm.asm.org/
Both errors likely resulted from contamination with other strains that were present in the same sample. The rate of false identifica-tion to the species level was 1.2% using the Biotyper system and
lower than 1% for the other systems (P⬍0.05).
Most of the errors that were observed with the Biotyper system
resulted from poor discrimination between species inside the
Ser-ratiaandHaemophilusgenera and from Bruker Daltonics policy
of avoiding false negatives forStreptococcus pneumoniae. As
de-scribed by the manufacturer,S.pneumoniaestrains are not
mis-identified by the Biotyper system, but someStreptococcus mitis/
oralisspecies are erroneously identified asS.pneumoniaedue to
the poor discrimination between these related species.
Consider-ing the identification ofStreptococcus viridans, the Vitek MS
data-base led to better results (n⫽8,P⬍0.05). The identification ofS.
pneumoniaewas not significantly different using both databases
(n ⫽15, P⫽0.07) and one of these isolates was erroneously
identified asS.mitis/oralisby the Vitek MS database.
At a cutoff of 90% (Vitek MS, Saramis) or a score above 1.7 (Biotyper), the percentage of unidentified organisms was 12.8% using the Saramis system and 5.8% using the Vitek MS system. With only 3.2% of the organisms unidentified, the Biotyper
data-base was significantly better (P⬍ 0.01). An additional 65/986
isolates (6.6%) were correctly identified by the Saramis database with scores between 80 and 90%, which left the percentage of unidentified organisms at 6.16% when the lower cutoff (80%) was used.
E.coli(n⫽338) andS.aureus(n⫽183) were the most
fre-quently isolated species. The rate of correct species identification ranged from 94.4% (Columbia agar, Biotyper database) to 100% and from 95.5% (Columbia agar, Vitek MS database) to 100% for
E.coliandS.aureus, respectively (Fig. 2). The Fisher test indicated
that the quality of the identification was not related to the choice of the culture medium.
The anaerobes identified by the three databases are presented in Table 3. The Biotyper and Vitek MS databases correctly identi-fied 61.6% and 75.3% of the isolates, respectively, to the species
level (P⫽0.068). Most of theFusobacteriumandParvimonas
iso-lates were only identified to the genus level using the Biotyper
database. Considering the species identification ofFusobacterium
isolates, the Vitek MS was significantly better than the Biotyper
database (P⬍0.01) but this difference disappeared when the
iso-lates correctly identified to the genus level were included (P⫽
0.125). In contrast,Bacteroidesspecies were identified more
accu-rately by the Biotyper database than by the Vitek MS database
(P⬍0.05). Only one genus error was observed (Vitek MS), and it
was probably due to a contaminant. Among the 73 cultured iso-lates, more than 90% remained unidentified at the SuperSpectra level using the Saramis database. This proportion was slightly im-proved by using a lower cutoff of 80% (84.9% versus 90.4%). The other two databases yielded similar proportions of unidentified isolates (13.7% and 17.8% for the Biotyper and Vitek MS
data-bases, respectively;P⫽0.491).
The enteric pathogens identified by the three databases are
[image:9.585.38.549.77.381.2]described in Table 4. As expected, all of theShigellastrains were
TABLE 6Comparison of practical parameters related to the use of the three systems
Property Microflex LT Vitek MS RUO Vitek MS IVD Remarks
User friendliness
Ready-to use Matrix solution No Yes Yes
Facility of preparing smear Very easy Easy Easy For Vitek-MS systems, matrix solution must be deposed
each two spots
Disposable targets Yes Yes Yes
Reusable targets Yes No No
Software Easy to use Not easy to use Very easy to use
Time for 96 identifications
Time to prepare work list (min) ⬍5 5–10 NDa
Time to load target and make vacuum 2 5
Time for analysis (min) 40 55
Time for 16 identifications (min) ND ND 15 No ID before success of QC at end of run (each 16 IDs)
Quality
IVD Yes No Yes
RUO Yes Yes No Need for validation before clinical reporting
Quality management Easy Easy Very easy
Costc
Device ⫹ NAb ⫹⫹
Reactants ⫹⫹⫹ NA ⫹ Based on catalog prices
Maintenance ⫹⫹ NA ⫹⫹⫹
Implementation
Noise Silent Noisy Noisy
Size Smaller Bulkier Bulkier
Connectivity Via LIS NA Via Myla
Capacity 1⫻96 4⫻48 4⫻48
a
ND, not done. bNA, data not available. c
Prices increasing with the number of crosses.
on May 16, 2020 by guest
http://jcm.asm.org/
identified asE. coli. Both the Biotyper and Vitek MS databases
misidentified theShigellaisolates; however, the identification
re-sults were accompanied by a comment explaining the inability to discriminate between these two genera. This poor discrimination resulted in high percentages of isolates unidentified by those da-tabases (13.2 and 15.1% by the Biotyper and Vitek MS dada-tabases,
respectively;P⫽1). Similar comments were also provided by the
Biotyper system for the identification of severalSalmonella
iso-lates. For these pathogens, the Vitek MS database allowed the
cor-rect discrimination ofSalmonella entericaserovar Typhi (n⫽5).
This difference was not statistically significant, but additional studies including a larger number of isolates are needed. This dif-ference resulted in a 5.7% false serotype identification rate by the Biotyper database versus no false identifications by the Vitek MS
database (P⫽0.25). No error was observed at the genus level with
either the Biotyper or the Vitek MS system. Again, the Saramis database yielded poorer results; nearly 70% of the isolates were
unidentified at the SuperSpectra level (P⬍0.001). This database
allowed the correct identification of only 20% of the isolates. An additional 15% were correctly identified when the cutoff was low-ered to 80%.
The use of the Bruker complementary SR database, which
in-cludesVibrio cholerae,S. Typhi, andYersinia pestis, did not
im-prove the discrimination of theSalmonellaandVibriospecies. No
confusion betweenY.enterocoliticaandY.pestiswas observed with
this database. Actually, using only the SR database,Y.
enteroco-liticawas identified asY.pestisbut with an unreliable score value
(data not shown).
The Microflex LT, Vitek MS RUO (Saramis), and Vitek MS IVD systems were also compared in terms of practicality. The main observations are summarized in Table 6.
The preparation of the deposits and the analyses were similar for all of the systems. With the Microflex LT, the matrix solution is not immediately ready to use; a few minutes is required to rehy-drate the lyophilized CHCA. In cases of bad preparation, losses may occur. However, the matrix solution is deposited on dried bacterial smears, which allows the technologist to prepare the en-tire batch of isolates and then add the matrix solution at the end. With both of the other systems, the matrix solution must be ap-plied immediately after the bacterial smear, which is more time-consuming. Bruker Daltonics offers both single-use and reusable targets, whereas bioMérieux offers only single-use targets.
The Vitek MS IVD system seemed to have more-user-friendly software. With several windows needing to be open on a single screen, the AXIMA Launch Pad software for the Vitek MS RUO system was probably the most difficult to use.
The Microflex LT identifies an entire target plate (96 isolates) in approximately 45 min, whereas the Vitek MS RUO system re-quires more than 1 h. With the Vitek MS IVD system, which uses the same AXIMA Assurance mass spectrometer, the results are displayed by acquisition group (containing up to 16 samples) and no identification is available before the end of the run (including the quality controls). In the case of poor quality control, the run must be repeated with new deposits and no identification is pro-vided.
In terms of the quality management parameters, both the Vitek MS IVD and Biotyper databases are CE marked. Both manufac-turers offer RUO versions that require validation by the laboratory before the data can be reported to clinicians. The Vitek MS RUO (Saramis database) is provided by bioMérieux, whereas Bruker
Daltonics offers a research tool that includes the same database as the IVD system (Biotyper database). This manufacturer also offers the possibility of combining both the IVD and RUO versions on the same device. The Vitek MS IVD system has a more highly developed quality management system because it contains dedicated positions for quality controls and a well-defined traceability system.
Because prices and reimbursement conditions may differ be-tween countries and laboratories, an accurate cost analysis has not been done. However, according to the prevailing catalog prices and the information that was obtained from the sales organiza-tions in Belgium, a global evaluation was conducted. The Vitek MS IVD system, including Myla middleware, is more expensive than the Microflex LT system, but the reagents are cheaper. This factor may be offset by the availability of the reusable Biotyper targets. Both manufacturers offer several maintenance packages. In Belgium, the Vitek MS “omnium” is more expensive than the Bruker Daltonics “all in” package, but it includes a backup ma-chine in case of system breakdown.
Both the Vitek MS IVD and IVD Microflex LT systems permit connections to other technologies via either a laboratory informa-tion system (Bruker Daltonics) or a proprietary middleware solu-tion called Myla (bioMérieux). Therefore, identificasolu-tions may be transmitted to other devices for the management of susceptibility testing.
Finally, the Vitek-MS system is bulkier and noisier than the Microflex LT system, which can be installed on a table. However, the Vitek-MS system allows the analysis of four target plates of 48 spots each in a single run versus one plate of 96 spots for the Microflex LT system.
DISCUSSION
MALDI-TOF MS represents a major revolution in the practice of bacteriology in clinical microbiology laboratories (5, 7, 9, 24, 30). Currently, two companies offer such devices in Europe: Bruker Daltonics and bioMérieux. The aim of the present study was to identify the best option for implementing MALDI-TOF MS in a routine laboratory. To our knowledge, this is the first study to evaluate both IVD systems under routine conditions. Additional research tools were also evaluated in this study.
For isolates requiring identification to the species level (n⫽
986), the analytical sensitivities of the two IVD systems were sim-ilar (92.7% and 93.2% correct species identifications by the
Bio-typer and Vitek MS systems, respectively [P⫽0.608]). A lower
percentage of correct identifications to the species level was
ob-tained using the Saramis database (83.8% [P⬍0.001]).
Similarly, Cherkaoui et al. obtained better performance using the Biotyper database (88.8% versus 94.4% for the Saramis and Biotyper databases, respectively, with a cutoff of 70% for Saramis) (10). The lower performance of the Saramis database observed in our study than that previously reported may be partially explained by the presence of numerous unidentified isolates and the defined identification criteria that were used. Indeed, in the present study, the colored index was considered to be a cutoff but the manufac-turer also suggests that a score of over 80%, rather than 90%, is consistent with highly accurate identification. If this new cutoff had been used, half of the unidentified organisms would have been added to the “correctly identified to the species level” category.
A total of 30% of the isolates unidentified by the Vitek MS
system and the Biotyper database wereE.coliorKlebsiella. This
result may be explained by the morphology of the colonies
on May 16, 2020 by guest
http://jcm.asm.org/
cause mucus can lead to thicker smears and generate incorrect identification results.
Most of the discrepancies were resolved by reanalyzing the strains, and they were found to be caused by contamination from the concomitant growth of other organisms in the sample (see the supplemental material). However, even when analyses are per-formed by the same operator, errors may occur. This suggests that a major disadvantage of the technology results from one of its primary assets: a small amount of biological material is required for identification. This fact must be considered carefully when susceptibility testing is performed as a second step.
In several cases, the traditional methods were responsible for the discrepancy, which suggests that MALDI-TOF MS may soon replace certain conventional and limited techniques (see the sup-plemental material). Similar conclusions have already been re-ported by several authors who have compared the performance of MALDI-TOF MS with that of conventional microbiological tech-niques (4, 6, 27).
The other discrepancies were related to the databases and/or known limitations of the MALDI-TOF MS technique.
The accuracy of the Biotyper database was found to be lower than that of the Saramis and Vitek MS databases. A third of the false identifications arose from Bruker Daltonics policy of
avoid-ing false negatives forS.pneumoniae. Currently, MALDI-TOF MS
cannot correctly discriminate betweenS.mitis/oralisandS.
pneu-moniae. The Saramis system has solved this problem by
identify-ing strains as “mitis/oralis/pneumoniae” streptococci. This
solu-tion has led to fewer errors, but it is neither efficient nor satisfactory in routine practice because an optochin test is still needed to establish a definitive diagnosis (25). Our results suggest, however, that the Vitek MS IVD system is more specific than the
other systems for the identification ofS.viridans(P⬍0.05).
Another source of errors for the Biotyper database was the
discrimination of species within the genusSerratia. Species
iden-tification errors also occurred forStaphylococcus schleiferiwhen
the spectrum was analyzed using the Vitek MS and Saramis data-bases, and all of the systems produced false results when
identify-ing one or both of the included strains ofHaemophilus
parainflu-enzae. Updates to the databases may solve the difficulties with such
species.
In contrast to the lower accuracy of the Biotyper database, the
Vitek MS system led to a higher rate of unidentified isolates (n⫽
32 andn⫽57 for the Biotyper and Vitek MS databases,
respec-tively;P⬍0.01).
ForE.coliandS.aureus, which represent more than 50% of the
isolates in our routine practice (521/1003), the growth medium used does not influence the quality of the identification by mass spectrometry (Fig. 2). However, a broader study should be con-ducted in order to evaluate the culture agar impact on mass spec-trometric identification of other bacterial species.
MALDI-TOF MS seems to be less effective for the identifica-tion of anaerobes than for aerobic organisms. In a recent compar-ison of the Saramis and Biotyper databases, Veloo et al. found that the Biotyper database performed better when identifying species
of theB.fragilisgroup, but they also noted that the analysis of
Gram-positive cocci with this technology required a time-con-suming extraction step to obtain the same results as those ob-tained using the Saramis database and direct deposit (32). In the present study, the results obtained with the Saramis database were unsatisfactory. This major difference probably resulted from the
different correct-identification cutoffs adopted in the two studies. However, the Biotyper database performed similarly in the iden-tification of anaerobic organisms in both studies. Comparing the Biotyper and Vitek MS systems, the Biotyper database allowed
better identification ofBacteroidesspecies (P⬍0.05). The Vitek
MS database showed better results forFusobacteriumspecies (P⬍
0.01); however, this difference should not impact clinical manage-ment. Indeed, the Gram coloration of these species is often suffi-ciently informative for their identification. Moreover, the identi-fication of these organisms to the genus level was not statistically
significantly different using both databases (P⫽0.125).
Although mass spectrometry is not competitive as a routine identification technique for anaerobes, it could be helpful in con-junction with conventional tests. In several cases, an extraction procedure would also improve the quality of the identification (18). Future expansion of the databases will likely improve the performance of this technique for anaerobe identification.
MALDI-TOF MS technology is a powerful tool that can be used in routine laboratories for the diagnosis of enteric diseases. It is particularly useful for the rapid discrimination of normal flora from potential pathogens that are isolated from stool samples. For pathogen identification itself, the limitations of MALDI-TOF MS
must be considered. Initially, the identification ofShigellaorE.coli
will still require additional tests according to the nature of the sample. Second, biochemical and serological tests will still be
re-quired to accurately identifySalmonellaspecies. Additional
stud-ies should be conducted in order to evaluate the ability of the Vitek
MS database to differentiateS. Typhi from otherSalmonella
sero-types; this is indeed of major interest from both the clinical man-agement and public health perspectives. Even when the SR data-base is used in parallel, the Biotyper datadata-base cannot discriminate these serotypes. Compared to the Biotyper database, the Vitek MS system showed better identification of enteric pathogens to the
species level (P⬍0.01). However, the difference between the two
databases did not remain when the rate of correct genus
identifi-cation was taken into account (P⫽0.625) and this panel included
nonconsecutive clinical isolates. This explains the high number of
S. Typhi andV.cholerae, species that are usually less frequently
encountered in our routine practice.
These results suggest that the major factors that influence the quality of MALDI-TOF MS identifications are the purity of the strain, the amount of biological material smeared onto the target plate, and the experience of the technologist. Indeed, no major differences were observed in the analytical performance of the Biotyper and Vitek MS databases for the identification of most
routine isolates. The distinction ofBacteroidesspecies by the
Bio-typer database and that ofS.viridans,Fusobacterium, and enteric
pathogen species by the Vitek MS system are actually the only differences that were observed between the IVD databases.
Clini-cally, the distinction ofBacteroidesspecies is probably the only
significant difference between the systems. Indeed, the
identifica-tion ofFusobacteriumto the genus level is usually informative
enough and an additional optochin test must still be performed in
order to discriminateS.pneumoniaeandS.viridans. However, the
potential of the Vitek MS database to differentiateS. Typhi from
otherSalmonellaspecies requires further investigation.
Applied to the routine data set (n⫽986), the matching hints
included in the Biotyper 3.0 software would have led to a modified result classification. According to our routine algorithm (and
con-sidering the low incidence ofShigellain samples other than stool
on May 16, 2020 by guest
http://jcm.asm.org/
samples), the matching hint related to theE.coli-Shigella discrim-ination is not taken into account when enteropathogenic bacteria
are not suspected. The reclassification ofS.viridansisolates would
have affected our conclusion in terms of the accuracy of the sys-tems (no longer any difference among the three databases),
whereas other modifications (e.g.,CitrobacterandAcinetobacter
isolate classification) would not have had a significant impact in the present study.
The Saramis database was weaker than the others, particularly for anaerobes and enteric pathogens. The use of a lower cutoff and an updated database would improve this performance in the fu-ture.
The main limitation of this study was the absence of yeasts and mycobacterial isolates. The ability of MALDI-TOF MS to identify yeasts and fungi has been demonstrated many times (1, 14, 23, 26, 29). In a large comparison, Bader et al. found no significant dif-ference between the Saramis and Biotyper databases when identi-fying yeasts (2). Additional studies are still needed to determine the efficacy of MALDI-TOF MS for the identification of mycobac-teria, but a recent publication by Saleeb et al. has shown encour-aging results (28). To our knowledge, no study has evaluated the performance of the Vitek MS system with these organisms or with routine isolates.
Because labor shortages and financial constraints have forced clinical microbiology laboratories to use their available resources more efficiently, we also analyzed the practical performance of the three systems.
The first question that must be answered regarding the acqui-sition of a MALDI-TOF spectrometer is whether it is intended for research or only for routine laboratory use. In the former case, an RUO system will be necessary, and the Microflex LT would be the preferred option because of its improved analytical performance and user-friendly software. Moreover, this system may be coupled with the IVD version for routine use. The ability to combine the IVD and RUO systems is certainly a major advantage for labora-tories that want to develop their own database and also use their spectrometer as a research tool. Choosing an RUO-only system requires the creation of a larger, more robust validation file.
Because of their similar analytical performance, the choice be-tween the IVD Microflex LT and Vitek MS IVD systems for rou-tine use only depends primarily on practical issues such as price and integration into the lab.
As previously described, no major differences in the sample preparation requirements were observed and both of the systems have strengths and weaknesses.
Because of its strict quality control, the Vitek MS IVD system will likely simplify laboratory quality management, which may constitute a major advantage of this system. However, this strict control will certainly delay the acquisition of identifications, and it may increase the final cost of the analysis by unnecessarily requir-ing a repeated series or, indirectly, through the loss of unused positions on the target.
The installation of a MALDI-TOF MS platform in a laboratory requires work flow management to avoid waiting for the identifi-cation work station. From this perspective, the larger load capacity of the Vitek MS IVD system would be an advantage. Finally, both systems can be easily implemented in a routine laboratory and the customer service that is provided by both manufacturers is satis-factory.
Conclusion.The design and maintenance of robust and
effi-cient MALDI-TOF MS systems are new challenges for manufac-turers. Databases must be dynamic, software must be easy to use, and the entire system must meet quality standards. If the system is to be used for nonroutine research purposes, the combined IVD/ RUO Microflex LT is certainly the ideal system. For routine pur-poses, however, the Microflex LT and Vitek MS IVD systems both offer good analytical performance. Both the specific sales condi-tions and the work flow of each lab will be decisive factors in the choice between the Bruker Daltonics and bioMérieux products.
ACKNOWLEDGMENTS
This work was partially sponsored by bioMérieux, Marcy l’Etoile, France. We thank Sonia Chatellier, bioMérieux, for her assistance during this study. We also thank Michèle Dramaix, School of Public Health, Univer-sité Libre de Bruxelles, for her help in the statistical analysis process.
REFERENCES
1.Alanio A, et al.2011. Matrix-assisted laser desorption ionization time-of-flight mass spectrometry for fast and accurate identification of clini-cally relevantAspergillusspecies. Clin. Microbiol. Infect.17:750 –755. 2.Bader O, et al.2011. Improved clinical laboratory identification of
hu-man pathogenic yeasts by matrix-assisted laser desorption ionization time-of-flight mass spectrometry. Clin. Microbiol. Infect.17:1359 –1365. 3.Barbuddhe SB, et al.2008. Rapid identification and typing ofListeria
species by matrix-assisted laser desorption ionization–time of flight mass spectrometry. Appl. Environ. Microbiol.74:5402–5407.
4.Benagli C, Rossi V, Dolin M, Tonolla M, Petrini O. 2011. Matrix-assisted laser desorption ionization time-of-flight mass spectrometry for the identification of clinically relevant bacteria. PLoS One6:e16424. 5.Bizzini A, Durussel C, Bille J, Greub G, Prod’hom G.2010. Performance
of matrix-assisted laser desorption ionization-time of flight mass spec-trometry for identification of bacterial strains routinely isolated in a clin-ical microbiology laboratory. J. Clin. Microbiol.48:1549 –1554. 6.Bizzini A, et al.2011. Matrix-assisted laser desorption ionization-time of
flight mass spectrometry as an alternative to 16S rRNA gene sequencing for identification of difficult-to-identify bacterial strains. J. Clin. Micro-biol.49:693– 696.
7.Bizzini A, Greub G.2010. Matrix-assisted laser desorption ionization time-of flight mass spectrometry, a revolution in clinical microbial iden-tification. Clin. Microbiol. Infect.16:1614 –1619.
8.Blairon L, et al.2010. Vitek 2 ANC Card versus BBL Crystal Anaerobe and RapID ANA II for identification of clinical anaerobic bacteria. Anaerobe 16:355–361.
9.Carbonnelle E, et al.2011. MALDI-TOF mass spectrometry tools for bacterial identification in clinical microbiology laboratory. Clin. Biochem.44:104 –109.
10. Cherkaoui A, et al.2010. Comparison of two matrix-assisted laser de-sorption ionization-time of flight mass spectrometry methods with con-ventional phenotypic identification for routine identification of bacteria to the species level. J. Clin. Microbiol.48:1169 –1175.
11. Christner M, et al.2010. Rapid identification of bacteria from positive blood culture bottles by use of matrix-assisted laser desorption-ionization time of flight mass spectrometry fingerprinting. J. Clin. Microbiol.48: 1584 –1591.
12. Couturier MR, Mehinovic E, Croft AC, Fisher MA.2011. Identification of HACEK clinical isolates by matrix-assisted laser desorption ionization-time of flight mass spectrometry. J. Clin. Microbiol.49:1104 –1106. 13. Demirev PA, Ho Y-P, Ryzhov V, Fenselau C.1999. Microorganisms
identification by mass spectrometry and protein database searches. Anal. Chem.71:2732–2738.
14. Dhiman N, Hall L, Wohlfiel SL, Buckwalter SP, Wengenack NL.2011. Performance and cost analysis of MALDI-TOF mass spectrometry for routine identification of yeast. J. Clin. Microbiol.49:1614 –1616. 15. Drancourt M.2010. Detection of microorganisms 304 in blood specimens
using matrix-assisted laser desorption ionization time-of-flight mass spectrometry: a review. Clin. Microbiol. Infect.16:1620 –1625.
16. Ferreira L, et al.2010. Identification ofBrucellaby MALDI-TOF mass spectrometry. Fast and reliable identification from agar plates and blood cultures. PLoS One5:e14235.
17. Gaia V, Casati S, Tonolla M.2011. Rapid identification ofLegionella
on May 16, 2020 by guest
http://jcm.asm.org/
spp.by MALDI-TOF MS based protein mass fingerprinting. Syst. Appl. Microbiol.34:40 – 44.
18. Justesen US, et al.2011. Species identification of clinical isolates of an-aerobic bacteria: a comparison of two matrix-assisted laser desorption ionization–time of flight mass spectrometry systems. J. Clin. Microbiol. 49:4314 – 4318.
19. Kaleta EJ, et al.2011. Comparative analysis of PCR-electrospray ioniza-tion/mass spectrometry (MS) and MALDI-TOF/MS for the identification of bacteria and yeast from positive blood culture bottles. Clin. Chem. 57:1057–1067.
20. Keys CJ, et al.2004. Compilation of a MALDI-TOF mass spectral data-base for the rapid screening and characterization of bacteria implicated in human infectious diseases. Infect. Genet. Evol.4:221–242.
21. Leuschner RGK, Beresford-Jones N, Robinson C.2004. Difference and consensus of whole cell Salmonella enterica subsp. enterica serovars ma-trix-assisted laser desorption/ionization time-of-flight mass spectrometry spectra. Lett. Appl. Microbiol.38:24 –31.
22. Martiny D, et al.2011. Accuracy of the API Campy system, the Vitek 2 Neisseria-Haemophilus (NH) Card and the matrix-assisted laser desorp-tion/ionisation time-of-flight mass spectrometry (MALDI-TOF MS) for the identification ofCampylobacterand related organisms. Clin. Micro-biol. Infect.17:1001–1006.
23. McTaggart LR, et al.2011. Rapid identification ofCryptococcus neoformans
andCryptococcus gattiiby matrix-assisted laser desorption ionization-time-of-flight mass spectrometry. J. Clin. Microbiol.49:3050 –3053.
24. Mellmann A, et al.2009. High interlaboratory reproducibility of matrix-assisted laser desorption ionization–time of flight mass spectrometry-based species identification of nonfermenting bacteria. J. Clin. Microbiol. 47:3732–3734.
25. Neville SA, et al.2011. Utility of matrix-assisted laser desorption ioniza-tion–time of flight mass spectrometry following introduction for routine laboratory bacterial identification. J. Clin. Microbiol.49:2980 –2984.
26. Putignani L, et al. 2011. MALDI-TOF mass spectrometry proteomic phenotyping of clinically relevant fungi. Mol. Biosyst.7:620 – 629. 27. Saffert RT, et al.2011. Comparison of Bruker Biotyper matrix-assisted
laser desorption ionization–time of flight mass spectrometer to BD Phoe-nix automated microbiology system for identification of Gram-negative bacilli. J. Clin. Microbiol.49:887– 892.
28. Saleeb PG, Drake SK, Murray PR, Zelazny AN.2011. Identification of mycobacteria in solid-culture media by matrix-assisted laser desorption ionization–time of flight mass spectrometry. J. Clin. Microbiol.49:1790 – 1794.
29. Santos C, Paterson RMM, Venâncio A, Lima N. 2010. Filamentous fungal characterizations by matrix-assisted laser desorption/ionization time-of-flight mass spectrometry. J. Appl. Microbiol.108:375–385. 30. Seng P, et al.2009. Ongoing revolution in bacteriology: routine
identifi-cation of bacteria by matrix-assisted laser desorption ionization time-of-flight mass spectrometry. Clin. Infect. Dis.49:543–551.
31. van Veen SQ, Claas ECJ, Kuijper EJ.2010. High-throughput identifica-tion of bacteria and yeast by matrix-assisted laser desorpidentifica-tion ionizaidentifica-tion– time of flight mass spectrometry in conventional medical microbiology laboratories. J. Clin. Microbiol.48:900 –907.
32. Veloo ACM, Knoester M, Degener JE, Kuijper EJ.2011. Comparison of two matrix-assisted laser desorption ionization–time of flight mass spec-trometry methods for the identification of clinically relevant anaerobic bacteria. Clin. Microbiol. Infect.17:1501–1506.
33. Wybo I, et al.2011. Differentiation ofcfiA-negative andcfiA-positive
Bacteroides fragilisisolates by matrix-assisted laser desorption ionization– time of flight mass spectrometry. J. Clin. Microbiol.49:1961–1964. 34. Yan Y, et al.2011. Improved identification of yeast species directly from
positive blood culture medium by combining Sepsityper specimen pro-cessing and Microflex analysis with the matrix-assisted laser desorption ionization Biotyper system. J. Clin. Microbiol.49:2528 –2532.