0095-1137/11/$12.00 doi:10.1128/JCM.01128-10
Copyright © 2011, American Society for Microbiology. All Rights Reserved.
Comparison of Detection Methods for Heteroresistant
Vancomycin-Intermediate
Staphylococcus aureus
,
with the Population Analysis Profile Method
as the Reference Method
䌤
Sarah W. Satola,
1,2* Monica M. Farley,
1,2Karen F. Anderson,
3and Jean B. Patel
3Emory University School of Medicine, Atlanta, Georgia1; Atlanta Veterans Affairs Medical Center, Decatur, Georgia2; and
Division of Healthcare Quality Promotion, Centers for Disease Control and Prevention, Atlanta, Georgia3
Received 3 June 2010/Returned for modification 26 September 2010/Accepted 27 October 2010
Staphylococcus aureusclinical isolates with vancomycin MICs of 2g/ml have been associated with
vanco-mycin therapeutic failure and the heteroresistant vancovanco-mycin-intermediateS. aureus(hVISA) phenotype. A
population analysis profile (PAP) with an area under the curve (AUC) ratio of>0.9 for the AUC of the clinical
isolate versus the AUC for hVISA strain Mu3 is most often used for determining hVISA, but it is
time-consuming and labor-intensive. A collection of 140 MRSA blood isolates with vancomycin MICs of 2g/ml by
reference broth microdilution and screened for hVISA using PAP-AUC (21/140 [15%] hVISA) were tested by additional methods to detect hVISA. The methods included (i) Etest macromethod using vancomycin and teicoplanin test strips, brain heart infusion (BHI) agar, and a 2.0 McFarland inoculum; (ii) Etest glycopeptide resistance detection (GRD) using vancomycin-teicoplanin double-sided gradient test strips on Mueller-Hinton agar (MHA) with 5% sheep blood and a 0.5 McFarland inoculum; and (iii) BHI screen agar plates containing
4g/ml vancomycin and 16 g/liter casein using 0.5 and 2.0 McFarland inocula. Each method was evaluated
using PAP-AUC as the reference method. The sensitivity of each method for detecting hVISA was higher when the results were read at 48 h. The Etest macromethod was 57% sensitive and 96% specific, Etest GRD was 57% sensitive and 97% specific, and BHI screen agar was 90% sensitive and 95% specific with a 0.5 McFarland
inoculum and 100% sensitive and 68% specific with a 2.0 McFarland inoculum. BHI screen agar with 4g/ml
vancomycin and casein and a 0.5 McFarland inoculum had the best sensitivity and specificity combination, was easy to perform, and may be useful for clinical detection of hVISA.
Vancomycin has been the most reliable therapeutic agent against methicillin-resistant Staphylococcus aureus (MRSA) for the past 3 decades. However, despite its sustainedin vitro microbiologic inhibitory activity, clinicians continue to debate its utility for MRSA infections (30, 36). Widespread empirical use of vancomycin to cover Gram-positive organisms, including MRSA, has likely contributed to the growing burden of less susceptible strains, and many health care facilities have re-ported an upward trend of vancomycin MICs for MRSA iso-lates over the past 5 years (19, 35, 40). In addition, a number of investigators have reported that MRSA infections caused by isolates with vancomycin MICs of 2g/ml (at the upper limits of the Clinical and Laboratory Standards Institute [CLSI] sus-ceptibility range) and/or the heteroresistant vancomycin-inter-mediateS. aureus (hVISA) phenotype were associated with prolonged bacteremia, greater rates of complications, and van-comycin therapeutic failures (22, 23, 31).
Infections involving hVISA pose a unique problem. Such strains are susceptiblein vitroto vancomycin (MIC⬍4g/ml) and thus are classified as susceptible by standard clinical lab-oratory methods but contain subpopulations of 1 in 106 cells
that can grow in the presence ofⱖ4g/ml of vancomycin (9,
27). Although the true prevalence of hVISA is unknown, esti-mates from a limited number of studies range from 1.3% to 27% of all MRSA isolates (1, 4, 5, 8, 21). Because of the increasing number of reports of vancomycin treatment failures and reports of poor outcomes for patients infected with hVISA (3, 5, 13, 21, 23, 25), an accurate and practical method for the detection of hVISA among MRSA isolates in the clinical lab-oratory is of growing importance.
Standardized reference methods for susceptibility testing, such as CLSI broth microdilution, agar dilution, and standard Etest methods, fail to detect hVISA, in part due to the small inoculum, the relatively poor support of growth on Mueller-Hinton agar plates, or a combination of both (38). Inoculum size is critical to detection of the minor subpopulation of re-sistant cells. Additionally, hVISA strains are notoriously slow growing, with thickened cell walls and unique pleomorphic features, such as small-colony variants (45). Screening for hVISA by the population analysis profile-area under the curve (PAP-AUC) method has been the most reliable and reproduc-ible approach but is labor-intensive, costly, and unsuitable for routine use in clinical laboratories. A variety of alternative methods for detection of the heteroresistant phenotype have been evaluated with varying success, and no single standard-ized clinical laboratory method has been established to date (17, 36, 38, 43).
In this study, we chose PAP-AUC as the “gold standard” to define hVISA. Using PAP-AUC as the reference method, we * Corresponding author. Mailing address: Atlanta VA Medical
Cen-ter, Research 151, 1670 Clairmont Rd., Decatur, GA 30033. Phone: (404) 321-6111, ext. 6163. Fax: (404) 329-2210. E-mail: ssatola@emory .edu.
䌤Published ahead of print on 3 November 2010.
177
on May 16, 2020 by guest
http://jcm.asm.org/
evaluated the Etest glycopeptide resistance detection (GRD), the Etest macromethod, and a newly described brain heart infusion (BHI) screen agar containing casein and vancomycin for the detection of hVISA (42) using a collection of 140 invasive MRSA isolates with vancomycin MICs of 2g/ml.
MATERIALS AND METHODS
Bacterial strains.One hundred forty invasive MRSA clinical isolates with vancomycin MICs of 2g/ml by reference broth microdilution using standard CLSI methods (6, 7) were collected as part of the Active Bacterial Core surveil-lance (ABCs) of the Centers for Disease Control and Prevention (CDC) Emerg-ing Infections Program from 2005 to 2007. Isolates were collected in five U.S. metropolitan areas in five states: 40 isolates from California, 30 from Georgia, 13 from Minnesota, 35 from New York, and 22 from Tennessee. Isolates were stored at⫺70°C in BBL Trypticase soy broth (TSB; Becton Dickinson and Company, Sparks, MD) containing 20% glycerol and were subcultured twice prior to testing on blood agar medium (Trypticase soy agar [TSA] with 5% sheep blood). All testing for each isolate was performed on the same day, using the same McFarland preparation to perform each test when the same inoculum size was required. MRSA strains Mu3 (the archetype hVISA strain), ATCC 29213 (a vancomycin-susceptibleS. aureus[VSSA] strain), and Mu50 (VISA) were in-cluded as controls with each experiment (11), and results were recorded for each isolate only when the positive and negative controls were confirmed for each method. All strains were independently tested in duplicate to examine the re-producibility of each method.
PAP-AUC.Heteroresistance was evaluated by PAP-AUC using the microdi-lution technique previously described by Pfeltz et al. (26) and Satola et al. (32) and modified as described below.
A 0.5 McFarland standard suspension from an overnight culture in BBL TSB (Becton Dickinson and Company) of the isolate to be tested was prepared. Serial dilutions (10⫺1
to 10⫺7
) were made in sterile saline, and 100l of 10⫺6 and 10⫺7 dilutions was spiral plated by hand using an inoculating turntable onto two media: Trypticase soy agar with 5% sheep blood to check for purity and Difco BHI agar (Becton Dickinson and Company) to determine viable counts. An aliquot of 100l of undiluted 0.5 McFarland standard suspension was spiral plated, and four 10-l droplets from each of five dilutions (10⫺1to 10⫺5) were dropped onto BHI agar plates containing 0, 0.25, 0.50, 0.75, 1.0, 1.5, 2.0, 2.5, 3.0, 4.0, 6.0, and 8.0g/ml of vancomycin. Vancomycin analytical powder was com-mercially purchased (Sigma Chemical Company, St. Louis, MO).
Plates were air dried and incubated for 48 h at 35°C. Colony counts (log10 numbers of CFU/ml) were determined at 24 and 48 h by counting the number of colonies on each plate or in each droplet, averaging the number of colonies in the four droplets for each vancomycin concentration, and converting the number of colonies to number of CFU/ml using the appropriate dilution factor. The log10 number of CFU/ml for each strain was plotted against the vancomycin concen-trations, and the AUC was determined using GraphPad Prism software (San Diego, CA). Isolates were defined as hVISA if the AUC of the test isolate divided by the AUC of the corresponding strain, Mu3, wasⱖ0.90.
Standard Etest.Vancomycin and teicoplanin MICs were determined by stan-dard Etest methods using a 0.5 McFarland stanstan-dard inoculum on Mueller-Hinton agar (MHA) plates (Remel, Lenexa, KA), according to the manufactur-er’s manual (EAS 003; AB Biodisk, Solna, Sweden), using vancomycin and teicoplanin Etest strips (bioMe´rieux, Durham, NC). MIC endpoints were read according to the manufacturer’s recommendations. MIC values were evaluated at the actual endpoint and also after rounding up to the next highest doubling dilution, which is recommended by the manufacturer for results reporting.
Etest GRD.The Etest GRD was performed according to the manufacturer’s instructions (AB Biodisk) using a double-sided predefined gradient of vancomy-cin and teicoplanin for the detection of glycopeptide-intermediateS. aureus (GISA) or hetero-GISA (hGISA). A 0.5 McFarland standard inoculum was prepared and swabbed onto MHA with 5% sheep blood (BBL, Becton Dickinson and Company). The zone of inhibition was read at 24 and 48 h after incubation at 35°C. The test isolate was considered positive for hVISA if the Etest GRD strip result wasⱖ8g/ml for either vancomycin or teicoplanin.
Etest macromethod.The Etest macromethod was performed using a 2.0 McFarland inoculum on BHI agar plates (Difco, Becton Dickinson and Com-pany), according to the manufacturer’s manual (EAS 003; AB Biodisk), using vancomycin and teicoplanin Etest strips (bioMe´rieux). Etest macromethod as-says were performed on the same day and with an inoculum from the same initial culture as that used for the standard Etest and the PAP-AUC assays. Hetero-resistance by the Etest macromethod was defined as MICs for vancomycin and
teicoplanin ofⱖ8g/ml or a teicoplanin MIC ofⱖ12g/ml regardless of the vancomycin MIC.
BHI screen agar plates.BHI agar (Difco, Becton Dickinson and Company) with the addition of 16 g/liter pancreatic digest of casein (Becton Dickinson and Company) and 4g/ml vancomycin (Sigma) was prepared in-house at the CDC. Two inoculum densities prepared in saline were utilized: a 0.5 McFarland standard recommended by CLSI and a 2.0 McFarland standard suspension. Four 10-l droplets from each McFarland suspension were dropped by a pipette onto the BHI with casein and 4g/ml vancomycin screen agar plates, allowed to air dry for approximately 5 min, and incubated at 35°C. Plates were examined at 24 and 48 h, and individual colonies in each droplet were counted. A droplet with
⬎20 colonies was considered too numerous to count accurately and designated TNTC. A droplet with confluent growth was scored as having confluent growth. An isolate was considered hVISA if at least one droplet had two or more colonies.
Statistical analysis. Sensitivity and specificity analyses were conducted to evaluate the performance of the Etest macromethod, Etest GRD strip, and the BHI screen agar plate technique using PAP-AUC as the reference method. Sensitivity analysis describes the fraction of correctly identified true positives (hVISA) by each test method, while specificity analysis describes the fraction of correctly identified negatives (non-hVISA, VSSA).
RESULTS
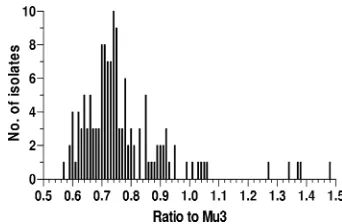
hVISA was determined by PAP-AUC for 140 MRSA clinical blood isolates that demonstrated an initial vancomycin MIC by reference broth microdilution of 2g/ml. Twenty-one of 140 (15%) isolates were hVISA by PAP-AUC, defined as a value of ⱖ0.90 for the ratio of the AUC of the isolate to the AUC of hVISA strain Mu3. The PAP-AUC ratios (ratio of the AUC of the isolate to the AUC of Mu3) ranged from 0.57 to 1.48, with a mode of 0.74. The frequency distribution of the PAP-AUC ratios for all 140 isolates is shown in Fig. 1. Almost half (66/140, 47%) fell within the range of 0.69 to 0.79; 10 iso-lates (7%) had ratios between 0.85 and 0.89, borderline for hVISA (Fig. 1).
[image:2.585.333.504.67.179.2]Standard Etests were performed on all 140 isolates as a comparison to the reference broth microdilution MICs and not as a method for hVISA detection. MICs ranged from 1.5 to 3 g/ml (mode⫽2g/ml) for vancomycin and 0.5 to 6g/ml (mode⫽1g/ml) for teicoplanin. Vancomycin MICs were 1.5 g/ml for 48 isolates, 2g/ml for 84 isolates, and 3g/ml for 8 isolates. Since a standard Etest MIC of 1.5g/ml could be rounded to the nearest doubling dilution for reporting pur-poses (i.e., MIC ⫽ 2 g/ml), the MICs for 132/140 (94%) isolates were in agreement with the reference broth microdi-lution MICs of 2g/ml. Six of the eight isolates with standard Etest vancomycin MICs of 3g/ml were found to be hVISA by FIG. 1. Frequency distribution of the PAP-AUC ratio of the isolate AUC to the Mu3 AUC for 140 MRSA isolates with vancomycin MICs of 2g/ml. PAP-AUC ratios ranged from 0.57 to 1.48, with a modal ratio of 0.74, and 47% fell within the range of 0.69 to 0.79.
on May 16, 2020 by guest
http://jcm.asm.org/
PAP-AUC, and the remaining two had slightly elevated ra-tios of the AUC of the isolate to the AUC of Mu3 of 0.75 and 0.83 (Table 1). Additionally, all isolates with standard Etest teicoplanin MICs of 3g/ml or greater were hVISA by PAP-AUC.
Etest macromethod and Etest GRD were performed on all 140 isolates, and results were read at both 24 and 48 h. For
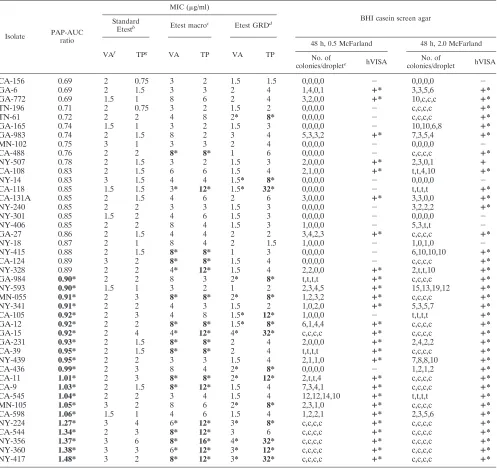
[image:3.585.45.542.90.561.2]each test, only the reading at 48 h was considered for hVISA determination. Vancomycin MICs ranged from 2 to 8g/ml (mode⫽ 3g/ml), teicoplanin MICs ranged from 1.5 to 16 g/ml (mode⫽3g/ml), and 17/140 (12%) isolates met the criteria for hVISA by Etest macromethod. By Etest GRD, vancomycin MICs ranged from 0.75 to 4g/ml (mode⫽1.5 g/ml), teicoplanin MICs ranged from 0.75 to 32 g/ml TABLE 1. Comparison of PAP-AUC ratio, BHI screen agar results, and standard Etest, Etest macromethod, and Etest GRD vancomycin
and teicoplanin MICs for isolates with PAP-AUCsⱖ0.69a
Isolate PAP-AUC ratio
MIC (g/ml)
BHI casein screen agar Standard
Etestb Etest macroc Etest GRDd
VAf TPg VA TP VA TP
48 h, 0.5 McFarland 48 h, 2.0 McFarland
No. of
colonies/droplete hVISA No. of
colonies/droplet hVISA
CA-156 0.69 2 0.75 3 2 1.5 1.5 0,0,0,0 ⫺ 0,0,0,0 ⫺
GA-6 0.69 2 1.5 3 3 2 4 1,4,0,1 ⴙ* 3,3,5,6 ⴙ*
GA-772 0.69 1.5 1 8 6 2 4 3,2,0,0 ⴙ* 10,c,c,c ⴙ*
TN-196 0.71 2 0.75 3 2 1.5 2 0,0,0,0 ⫺ c,c,c,c ⴙ*
TN-61 0.72 2 2 4 8 2* 8* 0,0,0,0 ⫺ c,c,c,c ⴙ*
GA-165 0.74 1.5 1 3 2 1.5 3 0,0,0,0 ⫺ 10,10,6,8 ⴙ*
GA-983 0.74 2 1.5 8 2 3 4 5,3,3,2 ⴙ* 7,3,5,4 ⴙ*
MN-102 0.75 3 1 3 3 2 4 0,0,0,0 ⫺ 0,0,0,0 ⫺
CA-488 0.76 2 2 8* 8* 1 6 0,0,0,0 ⫺ c,c,c,c ⴙ*
NY-507 0.78 2 1.5 3 2 1.5 3 2,0,0,0 ⴙ* 2,3,0,1 ⴙ
CA-108 0.83 2 1.5 6 6 1.5 4 2,1,0,0 ⴙ* t,t,4,10 ⴙ*
NY-14 0.83 3 1.5 4 4 1.5* 8* 0,0,0,0 ⫺ 0,0,0,0 ⫺
CA-118 0.85 1.5 1.5 3* 12* 1.5* 32* 0,0,0,0 ⫺ t,t,t,t ⴙ*
CA-131A 0.85 2 1.5 4 6 2 6 3,0,0,0 ⴙ* 3,3,0,0 ⴙ*
NY-240 0.85 2 2 3 3 1.5 3 0,0,0,0 ⫺ 3,2,2,2 ⴙ*
NY-301 0.85 1.5 2 4 6 1.5 3 0,0,0,0 ⫺ 0,0,0,0 ⫺
NY-406 0.85 2 2 8 4 1.5 3 1,0,0,0 ⫺ 5,3,t,t ⫺
GA-27 0.86 2 1.5 4 4 2 2 3,4,2,3 ⴙ* c,c,c,c ⴙ*
NY-18 0.87 2 1 8 4 2 1.5 1,0,0,0 ⫺ 1,0,1,0 ⫺
NY-415 0.88 2 1.5 8* 8* 1 3 0,0,0,0 ⫺ 6,10,10,10 ⴙ*
CA-124 0.89 3 2 8* 8* 1.5 4 0,0,0,0 ⫺ c,c,c,c ⴙ*
NY-328 0.89 2 2 4* 12* 1.5 4 2,2,0,0 ⴙ* 2,t,t,10 ⴙ*
GA-984 0.90* 2 2 8 3 2* 8* t,t,t,t ⴙ* c,c,c,c ⴙ*
NY-593 0.90* 1.5 1 3 2 1 2 2,3,4,5 ⴙ* 15,13,19,12 ⴙ*
MN-055 0.91* 2 3 8* 8* 2* 8* 1,2,3,2 ⴙ* c,c,c,c ⴙ*
NY-341 0.91* 2 2 4 3 1.5 2 1,0,2,0 ⴙ* 5,3,5,7 ⴙ*
CA-105 0.92* 2 3 4 8 1.5* 12* 1,0,0,0 ⫺ t,t,t,t ⴙ*
GA-12 0.92* 2 2 8* 8* 1.5* 8* 6,1,4,4 ⴙ* c,c,c,c ⴙ*
GA-15 0.92* 2 4 4* 12* 4* 32* c,c,c,c ⴙ* c,c,c,c ⴙ*
GA-231 0.93* 2 1.5 8* 8* 2 4 2,0,0,0 ⴙ* 2,4,2,2 ⴙ*
CA-39 0.95* 2 1.5 8* 8* 2 4 t,t,t,t ⴙ* c,c,c,c ⴙ*
NY-439 0.95* 2 2 3 3 1.5 4 2,1,1,0 ⴙ* 7,8,8,10 ⴙ*
CA-436 0.99* 2 3 8 4 2* 8* 0,0,0,0 ⫺ 1,2,1,2 ⴙ*
CA-11 1.01* 2 3 8* 8* 2* 12* 2,t,t,4 ⴙ* c,c,c,c ⴙ*
CA-9 1.03* 2 1.5 8* 12* 1.5 4 7,3,4,1 ⴙ* c,c,c,c ⴙ*
CA-545 1.04* 2 2 3 4 1.5 4 12,12,14,10 ⴙ* t,t,t,t ⴙ*
MN-105 1.05* 3 2 8 6 2* 8* 2,3,1,0 ⴙ* c,c,c,c ⴙ*
CA-598 1.06* 1.5 1 4 6 1.5 4 1,2,2,1 ⴙ* 2,3,5,6 ⴙ*
NY-224 1.27* 3 4 6* 12* 3* 8* c,c,c,c ⴙ* c,c,c,c ⴙ*
CA-544 1.34* 2 3 8* 12* 3 6 c,c,c,c ⴙ* c,c,c,c ⴙ*
NY-356 1.37* 3 6 8* 16* 4* 32* c,c,c,c ⴙ* c,c,c,c ⴙ*
NY-360 1.38* 3 3 6* 12* 3* 12* c,c,c,c ⴙ* c,c,c,c ⴙ*
NY-417 1.48* 3 2 8* 12* 3* 32* c,c,c,c ⴙ* c,c,c,c ⴙ*
a
Data are for 43 isolates. An asterisk signifies that hVISA was detected by that method based on boldface values and text.
b
Standard Etest, 0.5 McFarland standard inoculum at 24 h.
c
Etest macro, Etest macromethod, 2.0 McFarland standard inoculum at 48 h; the isolate was hVISA if vancomycin and teicoplanin MICs areⱖ8g/ml or the teicoplanin MIC isⱖ12g/ml regardless of the vancomycin MIC.
d
Etest GRD, 0.5 McFarland standard inoculum at 48 h. The isolate is hVISA positive if either the vancomycin or teicoplanin MIC isⱖ8g/ml.
e
Total number of colonies in each 10-l droplet. c, confluent growth; t, too numerous to count.
f
VA, vancomycin.
g
TP, teicoplanin.
on May 16, 2020 by guest
http://jcm.asm.org/
(mode⫽2g/ml), and 15/140 (11%) isolates met the criterion for hVISA.
All 140 MRSA isolates were evaluated on BHI screen agar plates (containing additional casein and 4g/ml vancomycin) using two different concentrations of inoculum delivered in four 10-l droplets. The presence of growth was examined at 24 and 48 h. Growth was best evaluated at 48 h for each inoculum. With a 0.5 McFarland inoculum, 27/140 (19%) iso-lates met the criterion for hVISA. When a 2.0 McFarland inoculum was used, 59/140 (42%) isolates met the criterion for hVISA. To verify reproducibility, 15 isolates with ratios of the isolate AUC compared to the AUC of Mu3 of between 0.65 and 1.38 were selected, blinded, and screened in duplicate for hVISA by two additional laboratory personnel. The BHI screen agar method was 100% reproducible within our labo-ratory.
A comparison of the PAP-AUC ratios with results obtained using BHI screen agar, standard Etest, Etest macromethod, and Etest GRD are shown in Table 1. Only results for those isolates positive or borderline positive for hVISA by any method or with a vancomycin MIC of 3 g/ml by standard Etest are shown (n⫽43). No isolate with a PAP-AUC ratio of the isolate AUC to the AUC of Mu3 of less than 0.69 was found to be hVISA by any method, and the majority of isolates (102/140, 73%) demonstrated no evidence of hVISA by any method evaluated (data not shown). Only 8/21 (4%) isolates that were hVISA by PAP-AUC were hVISA by all methods evaluated.
The isolates defined as hVISA by each test method and the PAP-AUC range of the ratio of the AUC of the isolate to the AUC of Mu3 is shown in Table 2. With the exception of the BHI screen agar method using the higher 2.0 McFarland in-oculum, no false positives were identified by any of the evalu-ated methods when the PAP-AUC ratio was⬍0.69 (Table 2). The highest false-positive rate occurred in isolates with bor-derline AUC ratios. Eight of 18 (44%) isolates with PAP-AUC ratios between 0.80 and 0.89 were positive for hVISA by one or more of the test methods, whereas only 6/66 (6%) of isolates with PAP-AUC ratios between 0.69 and 0.79 were positive for hVISA.
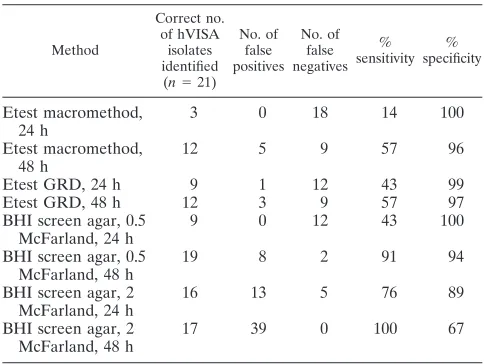
The sensitivity and specificity of the Etest macromethod, Etest GRD, and BHI screen agar methods using PAP-AUC as the reference method are shown in Table 3. Although the specificities (i.e., fewer false positives) of the Etest macro-method and the Etest GRD were slightly better at 24 h (100% at 24 h versus 96% at 48 h and 99% at 24 h versus 97% at 48 h, respectively), the sensitivities (i.e., fewer false negatives) sig-nificantly improved at 48 h. However, the sensitivities of both the Etest macromethod and the Etest GRD were relatively low at 57%, correctly identifying only 12 of the 21 hVISAs by PAP-AUC. The performance of the BHI screen agar with casein and 4g/ml vancomycin varied between the two differ-ent inocula and between reading at 24 or 48 h. For both the 0.5 and 2.0 McFarland standard inocula, the sensitivity increased at 48 h, while the specificity decreased: 43% sensitive and 100% specific at 24 h and 91% sensitive and 94% specific at 48 h using a 0.5 McFarland inoculum and 76% sensitive and 89% specific at 24 h and 100% sensitive and 67% specific at 48 h using a 2.0 McFarland inoculum. All methods were per-formed in duplicate, with no more than a 3% difference in sensitivity and specificity occurring between the two sets of tests.
DISCUSSION
[image:4.585.300.542.88.270.2]The clinical significance of hVISA has been debated since its initial description in 1997, and the uncertainty is likely to con-tinue for the foreseeable future (2, 15, 16). Clinical MRSA infections with hVISA strains have been associated with treat-ment failure and increased length of hospital stay (5, 41). Since no commonly used clinical laboratory methods, including au-tomated susceptibility testing systems, can identify hVISA, a practical, real-time method for detection of reduced suscepti-bility to vancomycin is imperative. However, given the contin-uum of resistance illustrated in Fig. 1, finding the perfect test to detect hVISA will be a challenge. In this survey of clinical MRSA isolates with vancomycin MICs of 2g/ml by the ref-erence broth microdilution method, a BHI screen agar method was shown to have the highest sensitivity and specificity in TABLE 2. Isolates defined as hVISA by different test methods and
range of PAP-AUC ratio of isolate AUC to Mu3 AUC
PAP-AUC ratio range
No. (%) of isolates
tested
No. (%) hVISA isolates by method
Etest macromethoda
Etest GRDa
BHI with casein screen
agarb
Totalc
0.57–0.68 35 (25) 0 0 0 0
0.69–0.79 66 (47) 1 (1.5) 1 (1.5) 4 (6) 4 (9)d 0.80–0.89 18 (13) 4 (22) 2 (11) 4 (22) 8 (44)d 0.90–1.48 21 (15) 12 (57) 12 (57) 19 (90) 19 (90)e Total 140 (100) 17 (12) 15 (11) 27 (19)
a
Results at 48 h.
b
Results at 48 h; 2 or more colonies in one of four 10-l droplets with a 0.5 McFarland suspension.
c
Total number of isolates hVISA by one or more test methods not including PAP-AUC.
d
Percentage false positive at the given PAP-AUC range.
e
[image:4.585.40.282.90.187.2]True positives.
TABLE 3. Sensitivity and specificity values for the different methods in determining hVISA
Method
Correct no. of hVISA
isolates identified (n⫽21)
No. of false positives
No. of false negatives
% sensitivity
% specificity
Etest macromethod, 24 h
3 0 18 14 100
Etest macromethod, 48 h
12 5 9 57 96
Etest GRD, 24 h 9 1 12 43 99
Etest GRD, 48 h 12 3 9 57 97
BHI screen agar, 0.5 McFarland, 24 h
9 0 12 43 100
BHI screen agar, 0.5 McFarland, 48 h
19 8 2 91 94
BHI screen agar, 2 McFarland, 24 h
16 13 5 76 89
BHI screen agar, 2 McFarland, 48 h
17 39 0 100 67
on May 16, 2020 by guest
http://jcm.asm.org/
detecting hVISA compared to the PAP-AUC reference method. Heteroresistance has been seen in strains with vanco-mycin MICs as low as 0.5g/ml; however, we chose to focus our study on a collection of clinical MRSA isolates with van-comycin MICs of 2g/ml since these strains demonstrate het-eroresistance at a greater rate (1), and in a previous study we found no heteroresistance by PAP-AUC among MRSA iso-lates with vancomycin MICs of 0.5 and 1.0g/ml by the ref-erence broth microdilution method (32). All methods evalu-ated reliably detected heteroresistance among a collection of MRSA isolates with vancomycin MICs ofⱖ4g/ml by stan-dard Etest (data not shown).
The screen agar approach is an inexpensive and efficient way to test multiple clinical isolates on a daily basis. However, several screen agar methods differing in medium composition, inoculum density, and choice of antibiotic and antibiotic con-centration have been evaluated for the detection of hVISA and demonstrated poor sensitivity (12). Currently, the only CLSI vancomycin screen agar method in place for clinical isolates for the detection of vancomycin-resistantS. aureus(VRSA) and possibly VISA is BHI agar containing 6 g/ml vancomycin (BHIA6V), a method originally established for detection of vancomycin resistance in enterococci (39), and several studies showed this method to have a very low sensitivity for the detection of hVISA (44, 45). The CDC recommends this as a supplemental test for VISA detection, with the caveat that strains with vancomycin MICs ofⱕ4g/ml will not be reliably identified (http://www.cdc.gov/ncidod/dhqp/ar_visavrsa_labFAQ .html) and screen agar plates with a lower concentration of 3 g/ml vancomycin have a very high false-positive rate (20).
In addition to the vancomycin concentration, the base me-dium of the screen agar appears to be important. The addition of supplements that enhance growth of hVISA could poten-tially improve the detection of hVISA by screen agar methods. Willey et al. found the addition of pancreatic digest of casein to BHI agar and 4g/ml vancomycin an improvement to other screen agars for the detection of VISA, and 97.7% of VISA strains in their study were successfully detected with high spec-ificity within 24 h (42). The addition of 20% horse serum to BHI has also been suggested as a means to differentiate be-tween hVISA and VSSA (14).
Although increasing the inoculum from a 0.5 to a 2.0 McFarland standard improved the sensitivity of the BHI screen agar method at 48 h (91% and 100%, respectively), there were 39 false positives with the higher inoculum when using the criterion for hVISA of two or more colonies growing in at least one of the four 10-l droplets. Using a higher cutoff for the 2.0 McFarland inoculum (growth of 10 or more colo-nies from at least one of the four 10-l droplets), the BHI screen agar method was 62% sensitive and 98% specific at 24 h and 81% sensitive and 90% specific at 48 h. The quadruplicate testing method (i.e., use of four 10-l droplets and looking for growth in any one of the four droplets) enhanced sensitivity; up to 8/19 (42%) hVISA isolates might have been missed if only one droplet was inoculated on the screen agar plate.
The BHI screen agar method failed to identify only two isolates found to be hVISA by PAP-AUC. However, both isolates had a standard Etest teicoplanin MIC of 3 g/ml (above the European Committee on Antimicrobial Suscepti-bility Testing [EUCAST] breakpoint ofⱕ2g/ml; www.eucast
.org) and were hVISA by the Etest GRD teicoplanin MIC. Historically, S. aureus acquired resistance to teicoplanin, a glycopeptide that is widely used outside the United States, much earlier than resistance to vancomycin (18) and teicoplanin resistance is frequently accompanied by a small increase in vancomycin resistance (10). Additionally, Shlaes et al. (33) demonstrated that penicillin binding protein 2 (PBP 2) is overproduced in a teicoplanin-resistant S. aureus mutant strain compared with the level of production by its parent strain, and overproduction of PBP 2 is also observed in hVISA strain Mu3. Although MRSA strains that are resistant to teicoplanin can still remain susceptible to vancomycin and cross-resistance does not necessarily occur, all VISA strains identified to date have shown reduced susceptibility to teicoplanin (34), making teicoplanin a useful marker for VISA and, potentially, hVISA. Ultimately, in the absence of molecular determinants specific to hVISA, the use of more than one method may be necessary for optimal screening sensitivity.
The Etest macromethod and the Etest GRD incorporate steps to improve detection of hVISA, such as use of enriched media, prolonged incubation, both vancomycin and teicopla-nin, and a higher inoculum (Etest macromethod). Use of these methods as routine clinical laboratory tests for hVISA detec-tion has been increasing, yet no standardized diagnostic meth-odology exists for either. Additionally, interpreting the results of both Etest methods for hVISA can be subjective and vari-able, and performing replicates is costly. Initial studies sug-gested that the Etest macromethod was a potentially effective screening test for detection of hVISA (24, 28, 38); however, the accuracy of this method varies significantly between different studies (12), probably due to the criteria used to define hVISA (29) and the variability of the inoculum size utilized (24, 37, 44). Though we followed the manufacturer’s recommended method and inoculum size, we found low sensitivity, similar to results reported by Adam et al. (1).
In conclusion, we found a BHI screen agar method that was easy to perform using standard media and inoculum sizes commonly utilized in clinical microbiology laboratories to be a useful method to identify hVISA. BHI agar plates with the addition of casein and 4g/ml vancomycin had the highest sensitivity and specificity in identifying hVISA com-pared to the two Etest methods when using PAP-AUC as the gold standard method. The sensitivity of detection im-proved significantly with incubation for 48 h, underscoring the apparent slow growth of hVISA isolates and the impor-tance of longer incubation even at the expense of slightly lower specificity. Although the positive predictive value for this test was only 72%, 4/8 (50%) of the false positives were near the cutoff for hVISA by PAP-AUC (ratios of 0.83, 0.85, 0.86, and 0.89) and might have biologic relevance in the continuum of emerging resistance. Larger-scale studies to further evaluate the value of the BHI screen agar method for identification of hVISA in a clinical setting are war-ranted.
ACKNOWLEDGMENTS
We thank Christal Hembree, Emily Crispell, and Ewelina Lyszkow-icz for general laboratory support.
on May 16, 2020 by guest
http://jcm.asm.org/
Financial support for this study was from CDC’s Emerging Infec-tions Program.
The findings and conclusions in this report are those of the authors and do not necessarily represent the official position of the Centers for Disease Control and Prevention.
REFERENCES
1.Adam, H. J., L. Louie, C. Watt, D. Gravel, E. Bryce, M. Loeb, A. Matlow, A. McGeer, M. R. Mulvey, and A. E. Simor.2010. Detection and characteriza-tion of heterogeneous vancomycin-intermediate Staphylococcus aureus (hVISA) in Canada: results from the Canadian Nosocomial Infection Sur-veillance Program, 1995-2006. Antimicrob. Agents Chemother.54:945–949. 2.Arakawa, Y., Y. Ike, and M. Nagasawa.2004. Where has vancomycin-heterogeneously resistantStaphylococcus aureusgone? Lancet363:1401. 3.Ariza, J., M. Pujol, J. Cabo, C. Pena, N. Fernandez, J. Linares, J. Ayats, and F. Gudiol.1999. Vancomycin in surgical infections due to methicillin-resis-tantStaphylococcus aureuswith heterogeneous resistance to vancomycin. Lancet353:1587–1588.
4.Bert, F., J. Clarissou, F. Durand, D. Delefosse, C. Chauvet, P. Lefebvre, N. Lambert, and C. Branger.2003. Prevalence, molecular epidemiology, and clinical significance of heterogeneous glycopeptide-intermediate Staphylo-coccus aureusin liver transplant recipients. J. Clin. Microbiol.41:5147–5152. 5.Charles, P. G., P. B. Ward, P. D. Johnson, B. P. Howden, and M. L. Grayson.
2004. Clinical features associated with bacteremia due to heterogeneous vancomycin-intermediateStaphylococcus aureus. Clin. Infect. Dis.38:448– 451.
6.Clinical and Laboratory Standards Institute/NCCLS.2009. Methods for dilution antimicrobial susceptibility tests for bacteria that grow aerobically, 8th ed. Approved standard M7-A8. Clinical and Laboratory Standards In-stitute, Wayne, PA.
7.Clinical and Laboratory Standards Institute/NCCLS.2009. Performance standards for antimicrobial disk susceptibility tests, 10th ed. Approved stan-dard M2-A10. Clinical and Laboratory Stanstan-dards Institute, Wayne, PA. 8.Garnier, F., D. Chainier, T. Walsh, A. Karlsson, A. Bolmstrom, C. Grelaud,
M. Mounier, F. Denis, and M. C. Ploy.2006. A 1 year surveillance study of glycopeptide-intermediateStaphylococcus aureusstrains in a French hospi-tal. J. Antimicrob. Chemother.57:146–149.
9.Hiramatsu, K.1998. The emergence ofStaphylococcus aureuswith reduced susceptibility to vancomycin in Japan. Am. J. Med.104:7S–10S.
10.Hiramatsu, K.2001. Vancomycin-resistant Staphylococcus aureus: a new model of antibiotic resistance. Lancet Infect. Dis.1:147–155.
11.Hiramatsu, K., N. Aritaka, H. Hanaki, S. Kawasaki, Y. Hosoda, S. Hori, Y. Fukuchi, and I. Kobayashi.1997. Dissemination in Japanese hospitals of strains ofStaphylococcus aureusheterogeneously resistant to vancomycin. Lancet350:1670–1673.
12.Howden, B. P., J. K. Davies, P. D. Johnson, T. P. Stinear, and M. L. Grayson.
Reduced vancomycin susceptibility inStaphylococcus aureus, including van-comycin-intermediate and heterogeneous vanvan-comycin-intermediate strains: resistance mechanisms, laboratory detection, and clinical implications. Clin. Microbiol. Rev.23:99–139.
13.Howden, B. P., P. D. Johnson, P. B. Ward, T. P. Stinear, and J. K. Davies.
2006. Isolates with low-level vancomycin resistance associated with persistent methicillin-resistantStaphylococcus aureusbacteremia. Antimicrob. Agents Chemother.50:3039–3047.
14.Howden, B. P., P. B. Ward, S. Xie, J. L. Wang, P. D. Johnson, P. G. Charles, and M. L. Grayson.2004. A new agar dilution screening method for the accurate detection of heterogenous-vancomycin intermediateStaphylococcus aureus(hVISA). ASA Newsl.,19:9–10.
15.Howe, R. A., A. Monk, M. Wootton, T. R. Walsh, and M. C. Enright.2004. Vancomycin susceptibility within methicillin-resistantStaphylococcus aureus lineages. Emerg. Infect. Dis.10:855–857.
16.Howe, R. A., and T. R. Walsh.2004. hGISA: seek and ye shall find. Lancet
364:500–501.
17.Jones, R. N.2006. Microbiological features of vancomycin in the 21st cen-tury: minimum inhibitory concentration creep, bactericidal/static activity, and applied breakpoints to predict clinical outcomes or detect resistant strains. Clin. Infect. Dis.42(Suppl. 1):S13–S24.
18.Kaatz, G. W., S. M. Seo, N. J. Dorman, and S. A. Lerner.1990. Emergence of teicoplanin resistance during therapy ofStaphylococcus aureus endocar-ditis. J. Infect. Dis.162:103–108.
19.Kirst, H. A., D. G. Thompson, and T. I. Nicas.1998. Historical yearly usage of vancomycin. Antimicrob. Agents Chemother.42:1303–1304.
20.Kosowska-Shick, K., L. M. Ednie, P. McGhee, K. Smith, C. D. Todd, A. Wehler, and P. C. Appelbaum.2008. Incidence and characteristics of van-comycin nonsusceptible strains of methicillin-resistantStaphylococcus aureus at Hershey Medical Center. Antimicrob. Agents Chemother.52:4510–4513. 21.Liu, C., and H. F. Chambers.2003.Staphylococcus aureuswith heteroge-neous resistance to vancomycin: epidemiology, clinical significance, and crit-ical assessment of diagnostic methods. Antimicrob. Agents Chemother.47:
3040–3045.
22.Maclayton, D. O., K. J. Suda, K. A. Coval, C. B. York, and K. W. Garey.2006.
Case-control study of the relationship between MRSA bacteremia with a vancomycin MIC of 2/mL and risk factors, costs, and outcomes in inpa-tients undergoing hemodialysis. Clin. Ther.28:1208–1216.
23.Maor, Y., M. Hagin, N. Belausov, N. Keller, D. Ben-David, and G. Rahav.
2009. Clinical features of heteroresistant vancomycin-intermediate Staphy-lococcus aureusbacteremia versus those of methicillin-resistantS. aureus bacteremia. J. Infect. Dis.199:619–624.
24.Maor, Y., G. Rahav, N. Belausov, D. Ben-David, G. Smollan, and N. Keller.
2007. Prevalence and characteristics of heteroresistant vancomycin-interme-diateStaphylococcus aureusbacteremia in a tertiary care center. J. Clin. Microbiol.45:1511–1514.
25.Moore, M. R., F. Perdreau-Remington, and H. F. Chambers.2003. Van-comycin treatment failure associated with heterogeneous vanVan-comycin- vancomycin-intermediateStaphylococcus aureusin a patient with endocarditis and in the rabbit model of endocarditis. Antimicrob. Agents Chemother.47:
1262–1266.
26.Pfeltz, R. F., J. L. Schmidt, and B. J. Wilkinson.2001. A microdilution plating method for population analysis of antibiotic-resistant staphylococci. Microb. Drug Resist.7:289–295.
27.Rybak, M. J., and R. L. Akins.2001. Emergence of methicillin-resistant Staphylococcus aureuswith intermediate glycopeptide resistance: clinical sig-nificance and treatment options. Drugs61:1–7.
28.Rybak, M. J., S. N. Leonard, K. L. Rossi, C. M. Cheung, H. S. Sader, and R. N. Jones.2008. Characterization of vancomycin-heteroresistant Staphylo-coccus aureus from the metropolitan area of Detroit, Michigan, over a 22-year period (1986 to 2007). J. Clin. Microbiol.46:2950–2954.
29.Sader, H. S., R. N. Jones, K. L. Rossi, and M. J. Rybak.2009. Occurrence of vancomycin-tolerant and heterogeneous vancomycin-intermediate strains (hVISA) amongStaphylococcus aureuscausing bloodstream infections in nine USA hospitals. J. Antimicrob. Chemother.64:1024–1028.
30.Sakoulas, G., R. C. Moellering, Jr., and G. M. Eliopoulos.2006. Adaptation of methicillin-resistantStaphylococcus aureusin the face of vancomycin ther-apy. Clin. Infect. Dis.42(Suppl 1):S40–S50.
31.Sakoulas, G., P. A. Moise-Broder, J. Schentag, A. Forrest, R. C. Moellering, Jr., and G. M. Eliopoulos. 2004. Relationship of MIC and bactericidal activity to efficacy of vancomycin for treatment of methicillin-resistant Staph-ylococcus aureusbacteremia. J. Clin. Microbiol.42:2398–2402.
32.Satola, S. W., A. M. Caliendo, M. M. Farley, J. B. Patel, and E. M. Burd.
2009. Lack of heteroresistance amongStaphylococcus aureusisolates with vancomycin MICs of 2 micrograms per milliliter by automated testing. J. Clin. Microbiol.47:2680–2681.
33.Shlaes, D. M., J. H. Shlaes, S. Vincent, L. Etter, P. D. Fey, and R. V. Goering.
1993. Teicoplanin-resistantStaphylococcus aureusexpresses a novel mem-brane protein and increases expression of penicillin-binding protein 2 com-plex. Antimicrob. Agents Chemother.37:2432–2437.
34.Sieradzki, K., P. Villari, and A. Tomasz.1998. Low-level teicoplanin resis-tance and heteroresisresis-tance to vancomycin. Ann. Intern. Med.128:245. 35.Steinkraus, G., R. White, and L. Friedrich.2007. Vancomycin MIC creep in
non-vancomycin-intermediateStaphylococcus aureus(VISA), vancomycin-susceptible clinical methicillin-resistantS. aureus (MRSA) blood isolates from 2001-05. J. Antimicrob. Chemother.60:788–794.
36.Tenover, F. C., and R. C. Moellering, Jr.2007. The rationale for revising the Clinical and Laboratory Standards Institute vancomycin minimal inhibitory concentration interpretive criteria forStaphylococcus aureus. Clin. Infect. Dis.44:1208–1215.
37.Voss, A., J. W. Mouton, E. P. van Elzakker, R. G. Hendrix, W. Goessens, J. A. Kluytmans, P. F. Krabbe, H. J. de Neeling, J. H. Sloos, N. Oztoprak, R. A. Howe, and T. R. Walsh.2007. A multi-center blinded study on the efficiency of phenotypic screening methods to detect glycopeptide intermediately sus-ceptibleStaphylococcus aureus(GISA) and heterogeneous GISA (h-GISA). Ann. Clin. Microbiol. Antimicrob.6:9.
38.Walsh, T. R., A. Bolmstrom, A. Qwarnstrom, P. Ho, M. Wootton, R. A. Howe, A. P. MacGowan, and D. Diekema.2001. Evaluation of current methods for detection of staphylococci with reduced susceptibility to glycopeptides. J. Clin. Microbiol.39:2439–2444.
39.Walsh, T. R., R. A. Howe, M. Wootton, P. M. Bennett, and A. P. MacGowan.
2001. Detection of glycopeptide resistance inStaphylococcus aureus. J. An-timicrob. Chemother.47:357–358.
40.Wang, G., J. F. Hindler, K. W. Ward, and D. A. Bruckner.2006. Increased vancomycin MICs forStaphylococcus aureusclinical isolates from a univer-sity hospital during a 5-year period. J. Clin. Microbiol.44:3883–3886. 41.Ward, P. B., P. D. Johnson, E. A. Grabsch, B. C. Mayall, and M. L. Grayson.
2001. Treatment failure due to methicillin-resistantStaphylococcus aureus (MRSA) with reduced susceptibility to vancomycin. Med. J. Aust.175:480– 483.
42.Willey, B. M., N. Kreiswirth, A. Gelosia, C. Porter, M. Alqhahtani, T. Mazzulli, S. Pong-Porter, C. Larocque, K. Pike, N. N. B. Kreiswirth, K. Wong, S. Poutanen, and D. E. Low.2008. Screening for vancomycin-inter-mediate Staphylococcus aureus (VISA): does casein make a difference?, abstr. D-2210. Abstr. 48th Annu. Intersci. Conf. Antimicrob. Agents Che-mother. (ICAAC)-Infect. Dis. Soc. Am. (IDSA) 46th Annu. Meet. American
on May 16, 2020 by guest
http://jcm.asm.org/
Society for Microbiology and Infectious Diseases Society of America, Wash-ington, DC.
43.Wootton, M., R. A. Howe, R. Hillman, T. R. Walsh, P. M. Bennett, and A. P. MacGowan.2001. A modified population analysis profile (PAP) method to detect hetero-resistance to vancomycin inStaphylococcus aureusin a UK hospital. J. Antimicrob. Chemother.47:399–403.
44.Wootton, M., A. P. MacGowan, T. R. Walsh, and R. A. Howe.2007. A multicenter
study evaluating the current strategies for isolatingStaphylococcus aureusstrains with reduced susceptibility to glycopeptides. J. Clin. Microbiol.45:329–332. 45.Yusof, A., A. Engelhardt, A. Karlsson, L. Bylund, P. Vidh, K. Mills, M.
Wootton, and T. R. Walsh.2008. Evaluation of a new Etest vancomycin-teicoplanin strip for detection of glycopeptide-intermediateStaphylococcus aureus(GISA), in particular, heterogeneous GISA. J. Clin. Microbiol.46:
3042–3047.