0095-1137/08/$08.00
⫹
0
doi:10.1128/JCM.01416-07
Copyright © 2008, American Society for Microbiology. All Rights Reserved.
Comparison between Quantitative Nucleic Acid Sequence-Based
Amplification, Real-Time Reverse Transcriptase PCR, and
Real-Time PCR for Quantification of
Leishmania
Parasites
䌤
Wendy van der Meide,
1* Jorge Guerra,
2Gerard Schoone,
1Marit Farenhorst,
1Leı´la Coelho,
2William Faber,
3Inge Peekel,
1and Henk Schallig
1KIT Biomedical Research, Royal Tropical Institute, Amsterdam, The Netherlands
1; Fundac¸a
˜o de Medicina Tropical do Amazonas,
Manaus, Brazil
2; and Department of Dermatology, Academic Medical Center, Amsterdam, The Netherlands
3Received 15 July 2007/Returned for modification 12 September 2007/Accepted 28 September 2007
DNA or RNA amplification methods for detection of
Leishmania
parasites have advantages regarding
sensitivity and potential quantitative characteristics in comparison with conventional diagnostic methods but
are often still not routinely applied. However, the use and application of molecular assays are increasing, but
comparative studies on the performance of these different assays are lacking. The aim of this study was to
compare three molecular assays for detection and quantification of
Leishmania
parasites in serial dilutions of
parasites and in skin biopsies collected from cutaneous leishmaniasis (CL) patients in Manaus, Brazil. A serial
dilution of promastigotes spiked in blood was tested in triplicate in three different runs by quantitative nucleic
acid sequence-based amplification (QT-NASBA), quantitative real-time reverse transcriptase PCR
(qRT-PCR), and quantitative real-time PCR (qPCR). In addition, the costs, durations, and numbers of handling
steps were compared, and 84 skin biopsies from patients with suspected CL were tested. Both QT-NASBA and
qRT-PCR had a detection limit of 100 parasites/ml of blood, while qPCR detected 1,000 parasites/ml.
QT-NASBA had the lowest range of intra-assay variation (coefficients of variation [CV], 0.5% to 3.3%), while qPCR
had the lowest range of interassay variation (CV, 0.4% to 5.3%). Furthermore, qRT-PCR had higher
r
2values
and amplification efficiencies than qPCR, and qPCR and qRT-PCR had faster procedures than QT-NASBA. All
assays performed equally well with patient samples, with significant correlations between parasite counts.
Overall, qRT-PCR is preferred over QT-NASBA and qPCR as the most optimal diagnostic assay for
quanti-fication of
Leishmania
parasites, since it was highly sensitive and reproducible and the procedure was relatively
fast.
Cutaneous leishmaniasis (CL), a protozoan skin infection, is
a major public health problem in the Amazonas state in Brazil,
with almost 1,000 cases reported annually in the capital city,
Manaus (13). The disease is primarily a zoonose, with a sylvatic
cycle of transmission occurring between phlebotomine sandfly
vectors of the species
Lutzomyia umbratilis
and
Lutzomyia
an-duzei
and wild animal hosts. CL was considered mainly an
occupational disease, infecting people involved in activities in
forests such as wood and mineral exploitation or in building of
roads in forests or of hydroelectric dams (16). Nowadays, CL
seems to have become an important problem in the rural
settlements around the urban areas of Manaus, which are
habituated mainly by a poor population.
Almost half of the CL patients in the Amazonas state visit
the large health institute in Manaus, Fundac¸a
˜o de Medicina
Tropical do Amazonas (FMTAM) (13). At this institute,
diag-nosis relies predominantly on the visualization of amastigotes
in Giemsa-stained smears with microscopy and on the clinical
picture of the lesion. Alternative methods are histopathology,
culture in Novy-MacNeal-Nicole medium, or inoculation into
susceptible animals, such as hamsters (14). However, these
methods are rather insensitive and/or time-consuming. The
PCR method has proven to be an important approach to
di-agnose CL, since it can be highly sensitive and specific and has
potential quantitative characteristics. Moreover, restriction
en-zyme analysis after amplification allows differentiation
be-tween different
Leishmania
species (2, 10, 25). Currently,
dif-ferent DNA and RNA amplification methods have been
established for detection and quantification of
Leishmania
par-asites, including quantitative real-time PCR (qPCR) and
quan-titative nucleic acid sequence-based amplification
(QT-NASBA) (8, 21, 27, 32). Sensitive molecular tools can offer
significant advantages, not only in diagnosis but also in studies
requiring accurate and sensitive quantification of parasites,
such as drug treatment efficacy studies (7).
A fluorogenic probe (e.g., TaqMan or fluorescent resonance
energy transfer) specific for the target sequence is used in
qPCR, allowing continuous monitoring of the amplified PCR
products (3). The closed-tube format of the assay reduces the
risk of contamination. An RNA amplification method such as
the 18S QT-NASBA (32) has advantages since it is based on an
isothermal reaction and thus circumvents the need for a
ther-mocycler. Furthermore, it is much more sensitive than
conven-tional PCR, since it targets rRNA copies, which are more
* Corresponding author. Mailing address: Koninklijk Instituut voor de
Tropen/Royal Tropical Institute, KIT Biomedical Research,
Meiberg-dreef 39, 1105 AZ Amsterdam, The Netherlands. Phone: 31 20 5665462.
Fax: 31 20 6971841. E-mail: [email protected]; [email protected].
䌤
Published ahead of print on 24 October 2007.
73
on May 16, 2020 by guest
http://jcm.asm.org/
abundant than ribosomal DNA (rDNA) (32, 33). As an
alter-native quantitative RNA amplification method, we used
real-time reverse transcriptase PCR (qRT-PCR). This technique is
an extended version of a qPCR, with a step involving treatment
with reverse transcriptase enzyme (an RNA-dependent DNA
polymerase) prior to a normal PCR. This assay combines the
advantages of both qPCR (closed-tube format) and
QT-NASBA (detection of RNA copies). The 18S ribosomal
se-quence was chosen as the target gene because it is a
multiple-copy gene, targets all
Leishmania
species, and has proven to be
highly efficient for the diagnosis of leishmaniasis from human
clinical material (22, 30, 32, 33).
The present study compared three molecular diagnostic
tools based on the amplification of small-subunit ribosomal
18S sequences for the detection and quantification of
Leish-mania
parasites in blood and clinical CL samples collected at
FMTAM in 2006. Assay performance was described in terms
of analytical sensitivity, intra- and interassay variations (within
and between runs), costs, and time to perform the assays.
MATERIALS AND METHODS
QT-NASBA.The QT-NASBA, which targets a 170-bp region in the 18S rRNA,
was performed using the Nuclisense BasicKit (bioMe´rieux) for amplification,
following the procedures published previously (32). Primers and probes are listed in Table 1. In vitro quantitative RNA (Q-RNA) (constructed by site-directed mutagenesis) is added to the sample prior to extraction and serves as competitor RNA for the QT-NASBA and as an internal control (IC). After extraction and amplification, the samples were detected by the electrochemiluminescence (ECL) detection method (32).
qRT-PCR.The primers and probes for qRT-PCR were based on the same 170-bp 18S rRNA and rDNA sequences as used for the QT-NASBA (Table 1). Since the same IC Q-RNA was used as in QT-NASBA (32), two probes with
different reporter dyes (6-carboxyfluorescein [FAM] and 5⬘
-tetrachloro-fluores-cein [TET]) were designed for the wild-type target and Q-RNA sequence. Both
probes were conjugated to a minor-groove binder (MGB) at the 5⬘end (Applied
Biosystems, Foster City, CA), causing a higher binding affinity of the probes to
the target (1). For the reaction, 2.5l of isolated DNA/RNA sample was added
to 22.5l amplification mix containing 1⫻buffer (Bio-Rad; 20 mM Tris-HCl [pH
8.4], 50 mM KCl, 0.8 mM deoxynucleoside triphosphates, 3 mM MgCl2, and 0.6
U/l iTaq DNA polymerase), 0.8M of each primer, 0.2M FAM-MGB probe,
and 0.2M TET-MGB probe. Amplification and real-time measurement were
performed in the iCycler iQ5 (Bio-Rad) with the following conditions: 10 min at 50°C, 5 min at 95°C, and then 45 cycles of 30 s at 95°C and 45 sec at 60°C. The
number of parasites was calculated from the threshold cycle (CT), i.e., the
amplification cycle number at which the emitted fluorescence exceeded the set
baseline of 100 reference fluorescence units (⫽background emission plus 10
standard deviations).
qPCR.The qPCR was carried out according to an established protocol de-scribed by Wortmann et al. (35) and targets a 60-bp region in the 18S ribosomal
gene specific for all members of theLeishmaniagenus. The protocol was
ad-justed by the incorporation of two primers and one probe to detect the IC plasmid pEntIC 2 (kindly donated by Richard Molenkamp, Clinical Virology Department, Academic Medical Center), which was originally developed for
Enterovirusspecies (members of the familyPicornaviridae) (4). Primer and probe
sequences are presented in Table 1. For the amplification reaction, 2.5l of
isolated DNA/RNA sample was added to 22.5l amplification mix containing
1⫻Supermix buffer (Bio-Rad; 20 mM Tris-HCl [pH 8.4], 50 mM KCl, 0.8 mM
deoxynucleoside triphosphates, 3 mM MgCl2, and 0.6 U/l iTaq DNA
polymer-ase), 0.8M of each primer (18SF and 18SR), 0.2M FAM probe, 0.4M of
each IC primer (Entero-1 and Bio-entero-2), and 0.1M enterovirus VIC-MGB
probe (Applied Biosystems). Amplification and real-time measurement were performed in the iCycler iQ5 (Bio-Rad) with the following conditions: 5 min at 95°C followed by 45 cycles of 30 s at 95°C and 45 s at 60°C. The number of
parasites was calculated from theCT, i.e., the amplification cycle number at
which the emitted fluorescence exceeded the set baseline of 150 reference
flu-orescence units (⫽background emission plus over 10 standard deviations).
Standard curves forLeishmaniaparasites.To assess the reproducibility of absolute quantification by the three assays, a standard curve was tested and used to determine if the absolute values of the parasite numbers amplified from the cultivated parasites were statistically similar. To perform this experiment, blood was spiked with parasites from one parasite serial dilution in order to obtain 10,000,000, 100,000, 1,000, 100, 10, and 0 parasites per ml blood.
RNA extracts of these samples were tested in the three assays in triplicate in three different runs. Before extraction, two ICs were added to each sample; 1,000,000 molecules of in vitro-generated Q-RNA (32) and the IC plasmid pEntIC 2 at 5,000 molecules. Both controls were used as extraction and inhibi-tion controls to check whether samples were truly negative, while in vitro Q-RNA also served as quantitative RNA for accurate quantification of the parasites in the QT-NASBA (29).
After extraction, each concentration used for the standard curve was divided
into three aliquots and stored at⫺70°C for a maximum of 4 days. One aliquot
was used for each run. Quantification ofLeishmaniaparasites was achieved by
plotting the log input parasite concentrations against either theCTvalues or the
log (wild type/Q⫻1,000) values with linear regression. The slopes (a) andy
intercepts (b) of the standard curves were used to calculate the corresponding log
output parasite concentrations with the formulay⫽ax⫹b.
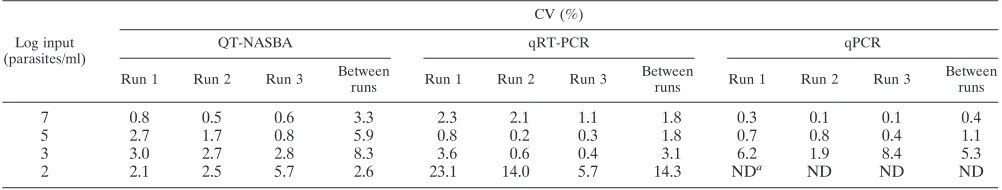
Intra- and interassay variations (i.e., variations within one run and between the three different runs, respectively) of the quantified data of the standard curve were measured as coefficients of variation (CV) for each input concentration,
calculated as the standard deviation/average⫻100% for each triplicate
[image:2.585.42.543.78.239.2](intra-assay variation) and for all nine output data (inter(intra-assay variation). Correlation
TABLE 1. Primers and probes used in the three molecular assays for detection and quantification of
Leishmania
parasites
Assay Forward primera Reverse primerb Probec
QT-NASBA
5
⬘
-
GATGCA AGG TCG CAT ATG
AG
C CAA AGT GTG GAG
ATC GAA G-3
⬘
5
⬘
-AAT TCT AAT ACG ACT CAC
TAT AGG GAG AAG GGC CGG
TAA AGG CCG AAT AG-3
⬘
5
⬘
-Biotin-GAC CAT TGT AGT
CCA CAC TG-3
⬘
QT-NASBA IC
5
⬘
-Biotin-CTT AGG TCC ACT
AAG GTA CC-3
⬘
qRT-PCR
5
⬘
-C CAA AGT GTG GAG ATC
GAA G-3
⬘
5
⬘
-GGC CGG TAA AGG CCG AAT
AG-3
⬘
5
⬘
-6FAM AC CAT TGT AGT CCA
CAC TGC-NFQ-MGB
qRT-PCR IC
5
⬘
-TET CTT AGG TCC ACT AAG
GTA CC-NFQ-MGB
qPCR
5
⬘
-AAG TGC TTT CCC ATC GCA
ACT-3
⬘
5
⬘
-GAC GCA CTA AAC CCC TCC
AA-3
⬘
5
⬘
-6FAM CGG TTC GGT GTG
TGG CGC C-NFQ
qPCR EV-IC
5
⬘
-GGC CCC TGA ATG CGG
CTA AT-3
⬘
5
⬘
-GGG ATT GTC ACC ATA AGC
AGC C-3
⬘
5
⬘
-VIC CTT GAG ACG TGC GTG
GTA ACC-NFQ-MGB
a
The region in bold is for generic ECL detection.
b
The underlined region is a T7 promoter sequence.
c
FAM, TET, and VIC code for the reporter fluorophores, and NFQ codes for a nonfluorescent quencher group (Applied Biosystems).
on May 16, 2020 by guest
http://jcm.asm.org/
coefficients (r2values) were calculated for each standard curve using a linear
regression analysis. For the real-time assays the amplification efficiency was
calculated asE⫽[10(1/slope)⫺
1]⫻100%, as described by Smith et al. (31). Both
the slope and theyintercept in the standard equation are important, because
absolute parasite numbers are determined from a number of different standard
curves and ther2
value and amplification efficiency alone give no information that will uniquely describe any individual curve (31). The analytical sensitivities of the three assays were determined by the lowest consistent detected concen-tration of parasites per ml.
Costs, time use, and user-friendliness.For each assay the total costs of re-agents per sample were calculated, as were the time (total time necessary to perform each assay, from preparing reagent mixes until obtaining results; RNA/ DNA extraction thus was excluded) and number of handling steps (the number of pipetting steps for the complete procedure).
Patients.This study was approved by the Brazilian National Review Board of
the Ministry of Health (Commissa˜o Nacional de E´ tica em Pesquisa Parecer no.
1142/2005). The study population comprised patients with suspected CL visiting FMTAM in Manaus, Brazil. In total, 84 patients who met the following inclusion criteria were included in the study: age between 17 and 65 years, clinical suspi-cion of CL, no previous history of CL, and written informed consent provided.
Parasitological diagnosis was done by direct microscopic identification of
Leish-maniaamastigotes in Giemsa-stained skin smears. During each evaluation, one skin biopsy (2 mm in diameter) was collected with a sterile disposable skin biopsy puncher from the active edge of the lesion according to WHO recommendations (34). Skin biopsies were taken under local anesthesia with xylocaine. In the absence of a true gold standard for diagnosis of CL, patients were defined as CL positive when the skin smear was positive by microscopy or by one of two
LeishmaniaPCRs (based on mini-exon and hsp70 genes, as described by Marfurt et al. [18] and Garcia et al. [12]) performed on skin biopsies. Patients were defined as having nonconfirmed CL when samples gave negative results by all three diagnostic methods. In total, 75 out of 84 suspected CL patients were defined as having confirmed CL, while 9 patients were defined as nonconfirmed.
Additionally, restriction fragment length polymorphism on the PCR products
was applied to distinguish the infectingLeishmaniaspecies of the CL patient (12,
19). In each PCR run, the following reference strains were included as positive
controls:Leishmania(Viannia)guyanensis MHOM/BR/75/M4147,Leishmania
(Viannia)braziliensisMHOM/BZ/75/M2903,Leishmania(Leishmania)mexicana
MHOM/MX/85/Solis, Leishmania(Leishmania) amazonensis MHOM/BR/81/
LTB16,Leishmania(Viannia)lainsoniMHOM/BR/86/M6426, andLeishmania
(Viannia)naiffiMHOM/00/94/CRE58.
Patient samples.Skin biopsies (2 mm in diameter) were mixed with 950l L6 lysis buffer (50 mM Tris HCl, 5 M guanidium isothiocyanate, 20 mM EDTA,
0,1% Triton X-100) and stored at⫺70°C at FMTAM. After transportation
(under cold conditions) to KIT Biomedical Research in Amsterdam, The Neth-erlands, RNA and DNA were extracted from the samples as described previously by the Boom method (6, 32). In each extraction series, 16 patient samples and a
serial dilution of promastigotes (see “Standard curves forLeishmaniaparasites”
above) were included with three negative controls (water or negative blood) in order to assess carryover contamination. Before extraction, the two ICs (Q-RNA and plasmid pEntIC 2) were added to each sample. Each extraction series was tested by QT-NASBA, qRT-PCR, and qPCR. The parasite quantification results for the patient samples in each assay were compared with those for the samples in the other two assays using Spearman’s correlation.
RESULTS
Standard curves.
For each parasite concentration of the
standard curve, the CV (standard deviation/average
⫻
100%)
was calculated for one run (intra-assay variation), and the
results are presented in Table 2. Intra-assay variation for all
parasite concentrations had a lower range in QT-NASBA (CV
from 0.5% to 3.3%) than in qRT-PCR (CV from 0.2% to
23.1%) and qPCR (CV from 0.1% to 8.4%). Overall, only 5 out
of the 33 intra-assay CV calculated were above 5%. Only for
the lower parasite loads (1,000 and 100 parasites/ml) did the
intra-assay CV values in QT-NASBA remained below 5%,
while most of the CV in qRT-PCR at 100 parasites/ml and in
qPCR at 1,000 parasites/ml were above 5%. Furthermore, the
range of variability did not increase using replicated standard
curves within separate runs (interassay variation) for
qRT-PCR (1.8% to 14.3%) and qqRT-PCR (0.4% to 5.3%). However, in
QT-NASBA the range of variability increased slightly within
separate runs (CV from 3.3% to 8.3%). The test results are
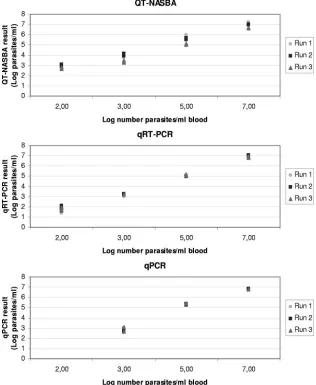
plotted against the different dilutions in Fig. 1.
In Table 3 the mean
r
2values, amplification efficiencies, and
standard equations for the standard curves are presented. The
high
r
2values for all three assays confirm the linearity of the
standard curves used for quantification of parasite
concentra-tions (in log values) and validate the use of a linear regression
analysis. The efficiency of a PCR provides information on
amplification linearity and the effect of dilution of template
DNA on the PCR amplification. In a 100% efficient reaction,
it takes approximately 3.32 cycles for 10-fold amplification of
the target, a value that is equal to the slope of the standard
curve. In our study, PCR efficiencies were lower for qPCR
(62% to 71%) than for qRT-PCR (82% to 85%).
The QT-NASBA could detect 10 parasites/ml in some
sam-ples, which corresponds to 0.5 parasite per blood sample
be-cause only 50
l blood is processed. In reality, a level of 10
parasites/ml results in samples with one parasite and samples
with no parasites, which increases the risk of false negatives.
For this reason, the detection limit was set at 100 parasites/ml,
which is equivalent to five parasites per 50
l blood. The
detection limit for qRT-PCR was 100 parasites/ml, while the
detection limit for qPCR was 1,000 parasites/ml.
Patients.
In total, 84 suspected CL patients were included,
[image:3.585.42.543.90.185.2]from which 75 patients were diagnosed with CL by Giemsa
smear in microscopy (
n
⫽
69) and/or by skin biopsies tested in
PCR (
n
⫽
75). The median age of the 75 CL patients was 26
TABLE 2. Intra- and interassay variations, calculated as CV (standard deviation/mean
⫻
100%), of a standard curve tested in QT-NASBA,
qRT-PCR, and qPCR in triplicate in three different runs
Log input (parasites/ml)
CV (%)
QT-NASBA qRT-PCR qPCR
Run 1 Run 2 Run 3 Between
runs Run 1 Run 2 Run 3
Between
runs Run 1 Run 2 Run 3
Between runs
7
0.8
0.5
0.6
3.3
2.3
2.1
1.1
1.8
0.3
0.1
0.1
0.4
5
2.7
1.7
0.8
5.9
0.8
0.2
0.3
1.8
0.7
0.8
0.4
1.1
3
3.0
2.7
2.8
8.3
3.6
0.6
0.4
3.1
6.2
1.9
8.4
5.3
2
2.1
2.5
5.7
2.6
23.1
14.0
5.7
14.3
ND
aND
ND
ND
aND, not detected.
on May 16, 2020 by guest
http://jcm.asm.org/
years (range, 17 to 63), the median number of lesions was 2
(range, 1 to 13), and the median duration of CL symptoms
before diagnosis was 4 weeks (range, 1.5 to 52 weeks). The two
PCR-restriction fragment length polymorphism assays
re-vealed that 68 patients were infected with
L. (V.) guyanensis
, 2
patients with
L. (L.) amazonensis
, and 5 patients with
L. (V.)
braziliensis
.
Patient results.
All 75 confirmed CL patients were positive
[image:4.585.134.450.71.456.2]by QT-NASBA, qRT-PCR, and qPCR before treatment, with
median parasite counts of 30,000 (range, 5 to 5,780,000), 6,130
(range, 5 to 109,000) and 94,100 (range, 38 to 12,800,000)
parasites/biopsy, respectively. It was notable that in four out of
five
L. (V.) braziliensis-
infected patients, parasites were not
detected by microscopy.
FIG. 1.
Leishmania
parasite quantification of one in vitro-cultured parasite serial dilution spiked in blood. QT-NASBA, qRT-PCR, and qPCR
were performed in triplicate in three different runs.
TABLE 3. Regression coefficients (
r
2), amplification efficiency
关
E
⫽
(10
1/slope⫺
1)
⫻
100%
兴
, and equations of the standard curves tested in
QT-NASBA, qRT-PCR, and qPCR in triplicate in three different runs
Parameter
Value in:
QT-NASBA qRT-PCR qPCR
Run 1 Run 2 Run 3 Run 1 Run 2 Run 3 Run 1 Run 2 Run 3
r
20.995
0.997
0.999
0.997
0.994
0.992
0.984
0.984
0.972
E
(%)
NA
aNA
NA
86.5
90.3
83.1
71.0
71.5
62.0
Equation
by
⫽
0.921
x
⫹
0.694
y
⫽
0.888
x
⫹
0.814
y
⫽
0.896
x
⫹
0.542
x
⫽ ⫺
3.69
y
⫹
42.8
x
⫽ ⫺
3.58
y
⫹
41.5
x
⫽ ⫺
3.81
y
⫹
43.3
x
⫽ ⫺
4.29
y
⫹
48.8
x
⫽ ⫺
4.27
y
⫹
49.1
x
⫽ ⫺
4.78
y
⫹
52.3
aNA, not applicable.
bx⫽log (wild type/Q⫻1,000) for QT-NASBA results and theC
Tvalue for qRT-PCR and qPCR results;y⫽log calculated number of parasites/ml.
on May 16, 2020 by guest
http://jcm.asm.org/
[image:4.585.45.542.623.708.2]Eight out of nine nonconfirmed patients who were negative
by both microscopy and PCR were also negative by
QT-NASBA, qRT-PCR, and qPCR. Negative results were not due
to inhibition, since all ICs were positive. One of the
noncon-firmed CL patients was positive in all three assays for the
wild-type targets, with parasite counts of 22, 43, and 40
para-sites/biopsy, respectively. This patient was treated on the
judg-ment of the infectiologist.
Overall, when parasite counts from the three assays were
com-pared, significant correlations were found between QT-NASBA
and qRT-PCR (Spearman’s
⫽
0.961;
P
⬍
0.001), QT-NASBA
and qPCR (Spearman’s
⫽
0.919;
P
⬍
0.001), and qRT-PCR and
qPCR (Spearman’s
⫽
0.966;
P
⬍
0.001).
Costs, time use, and user-friendliness.
For each assay the
cost of reagents per sample, duration of assay, and number of
steps for sample handling were calculated. The qPCR was the
least expensive assay (
€
1.55 per sample, in comparison with
€
5.15 for QT-NASBA and
€
2.20 for qRT-PCR). qPCR
re-quired the shortest assay time, of only 2 hours, while for
QT-NASBA and qRT-PCR, 4 hours 30 minutes and 2 hours 20
minutes, respectively, were required. Overall, the qRT-PCR
assay is less than half as expensive as the QT-NASBA assay
and twice as rapid in use. In both qPCR and qRT-PCR the
reaction takes place in a closed-tube format, which minimizes
sample handling and avoids the risk of contamination. The
total number of handling steps per sample for both qPCR and
qRT-PCR was only two. In contrast, QT-NASBA has an
ex-tensive time course between sample preparation and data
col-lection and requires eight handling steps due to the ECL
detection method.
DISCUSSION
Only a few studies have compared the application of
molec-ular diagnostic tools for leishmaniasis (5, 20). These studies are
needed in order to assess the best assay performance for
im-plementation in areas where the disease either is or is not
endemic. In the present study, two RNA-based amplification
assays (QT-NASBA and qRT-PCR) were compared with one
DNA amplification assay (qPCR). In all three assays, an IC
was included and one
Leishmania
serial dilution was tested in
triplicate and in separate runs.
Both QT-NASBA and qRT-PCR were 10-fold more
sensi-tive than qPCR, detecting at least 100 parasites/ml. In a few
samples the QT-NASBA detected parasite concentrations of
10 parasites/ml. Both QT-NASBA and qRT-PCR amplify
par-asite rRNA, while qRT-PCR also amplifies rDNA, since no
DNase step prior to amplification is introduced. Parasite
rRNA copy numbers have shown to be over 100-fold more
abundant than the gene copy numbers (32), which explains the
lower sensitivity of the qPCR, in which only target DNA is
amplified.
Overall, QT-NASBA had the most constant intra-assay
vari-ation over the whole range of parasite concentrvari-ations, with all
CV below 3.3%. For qRT-PCR and qPCR, the variation
in-creased for the lower parasite concentrations (100 parasites/ml
and 1,000 parasites/ml). However, QT-NASBA had higher
in-terassay variations over the whole range, except for the lowest
parasite concentration of 100 parasites/ml. Furthermore,
QT-NASBA and qRT-PCR performed better than qPCR, with
higher regression coefficients and a higher reaction efficiency
for the qRT-PCR. The lower performance of qPCR can be
attributed to the incorporation of a noncompetitive IC (i.e., a
DNA template with different primer sequences) with a
differ-ent length than the target DNA. In the other two assays
(QT-NASBA and qRT-PCR), the same competitive IC (Q-RNA is
amplified with the same primers as the wild-type target) has
been incorporated.
In this study the QT-NASBA amplification was detected by
ECL, which makes the assay more laborious and expensive. By
the incorporation of a molecular beacon as a fluorescent label,
a real-time QT-NASBA format can be constructed (17). This
real-time QT-NASBA assay is very promising, since it
com-bines the isothermal characteristics, sensitivity, and rapidity of
the NASBA reaction with the simple, closed-tube format of a
real-time assay (28). So far, no real-time QT-NASBA has been
established for leishmaniasis. Another alternative for ECL
de-tection is oligochromatography. With this method, the
ampli-fied products are visualized within 5 min on a dipstick through
hybridization with a gold-conjugated probe (23). For human
African trypanosomiasis, this method was successfully
com-bined with PCR and proved to be sensitive and specific (9).
While such an assay would have no quantification purposes,
NASBA in combination with oligochromatography would
cir-cumvent the need for a thermocycler and postamplification
equipment and would be ideal for lower-tech laboratories.
Currently, simplified detection methods are under
develop-ment (26).
Several qPCRs for the detection of
Leishmania
spp. have
been described, but in most cases the analytical sensitivity was
not reported, an inhibition control was lacking, or the assays
were based on detection of one specific species, limiting their
use in clinical diagnosis (7, 24, 30). The 18S target is preferred,
since it is almost completely homologous for all
Leishmania
species (33), which increases its value for clinical diagnosis (22,
32). When the three assays were applied to patient samples,
quantitative results were significantly correlated between all
three assays. No negative results were found, giving a
sensitiv-ity of 100% for this patient group. However, one patient in the
CL-negative group was positive in all three assays. Based on
the clinical symptoms and clinical improvement during
treat-ment, this patient is still assumed to have had CL. This would
also imply a higher sensitivity of these assays than microscopy
and the PCR assays applied in this study. The other eight
nonconfirmed patients who were tested negative probably had
ulcerating pyoderma. The importance of a high sensitive assay
is demonstrated in our results; as 4 out of 6 microscopy
neg-ative patients were infected with
L. (V.) braziliensis
, a species of
which is known to cause low parasite loads in the lesions (11).
When
L. (V.) braziliensis
infection remains undetected it can
have serious implications for the patient since it can cause
mutilating mucocutaneous leishmaniasis (15).
In conclusion, all three molecular assays are reliable methods
for the detection and quantification of
Leishmania
parasites in
clinical samples. The RNA based methods (QT-NASBA and
qRT-PCR) are the most sensitive assays generating reproducible
results. The QT-NASBA is less convenient since the ECL
detec-tion involves more handling steps and procedure time. The
de-velopment of an easy and rapid post amplification method, like
oligochromatography can increase the value of QT-NASBA for
on May 16, 2020 by guest
http://jcm.asm.org/
endemic areas with no sophisticated laboratory. However, a
dis-advantage remains the high prices for these molecular assays,
especially the QT-NASBA. For now, the use of qRT-PCR is
recommended as a sensitive and most convenient assay, providing
highly sensitive detection and quantification of
Leishmania
para-sites. This method can be applied for diagnosis, treatment efficacy
studies, epidemiological studies and vaccine trials.
ACKNOWLEDGMENTS
We gratefully thank the patients for their participation in this study
and the staff of the Leishmaniose Laboratory at FMTAM who helped
with translations and registration of patients. Furthermore, we thank
Patricia van Sambeek and Esther Pariama (AMC, Amsterdam, The
Netherlands) for collection of data and patient samples and Fabio
Eudes Leal for his help and efforts to send the patient samples to The
Netherlands. We thank Marcel Beld and Richard Molenkamp
(De-partment of Medical Microbiology, AMC, Amsterdam, The
Nether-lands) for help in development of the qRT-PCR and for providing the
IC. We thank Lisa Lambregts and Inge Versteeg (KIT Biomedical
Research) for help in sample analyses.
This work was supported by a grant from The Netherlands
Foun-dation for the Advancement of Tropical Research (WOTRO contract
96-210).
REFERENCES
1.Afonina, I., M. Zivarts, I. Kutyavin, E. Lukhtanov, H. Gamper, and R. B. Meyer.1997. Efficient priming of PCR with short oligonucleotides
conju-gated to a minor groove binder. Nucleic Acids Res.25:2657–2660.
2.Al-Jawabreh, A., G. Schoenian, O. Hamarsheh, and W. Presber.2006. Clin-ical diagnosis of cutaneous leishmaniasis: a comparison study between stan-dardized graded direct microscopy and ITS1-PCR of Giemsa stained smears.
Acta Trop.99:55–61.
3.Arya, M., I. S. Shergill, M. Williamson, L. Gommersall, N. Arya, and H. R. H. Patel.2005. Basic principles of real-time quantitative PCR. Expert
Rev. Mol. Diagn.5:209–219.
4.Beld, M., R. Minnaar, J. Weel, C. Sol, M. Damen, H. Van der Avoort, P. Wertheim-van Dillen, A. Van Breda, and R. Boom.2004. Highly sensitive assay for detection of enterovirus in clinical specimens by reverse
transcrip-tion-PCR with an armored RNA control. J. Clin. Microbiol.42:3059–3064.
5.Bensoussan, E., A. Nasereddin, F. Jonas, L. F. Schnur, and C. L. Jaffe.2006. Comparison of PCR assays for diagnosis of cutaneous leishmaniasis. J. Clin.
Microbiol.44:1435–1439.
6.Boom, R., C. Sol, M. Salimans, C. Jansen, P. Wertheim van Dillen, and J. van der Noordaa.1990. Rapid and simple method for purification of nucleic
acids. J. Clin. Microbiol.28:495–503.
7.Bossolasco, S., G. Gaiera, D. Olchini, M. Gulletta, L. Martello, A. Bestetti, L. Bossi, L. Germagnoli, A. Lazzarin, C. Uberti-Foppa, and P. Cinque.2003. Real-time PCR assay for clinical management of human immunodeficiency
virus-infected patients with visceral leishmaniasis. J. Clin. Microbiol. 41:
5080–5084.
8.Bretagne, S., R. Durand, M. Olivi, J. S. Garin, A., D. Rivollet, M. Vidaud, and M. Deniau.2001. Real-time PCR as a new tool for quantifying Leish-mania infantumin liver in infected mice. Clin. Diagn. Lab. Immunol.8:828– 831.
9.Deborggraeve, S., F. Claes, T. Laurent, P. Mertens, T. Leclipteux, J. Dujardin, P. Herdewijn, and P. Buscher.2006. Molecular dipstick test for diagnosis of
sleeping sickness. J. Clin. Microbiol.44:2884–2889.
10.Faber, W., L. Oskam, T. van Gool, N. Kroon, K. Knegt-Junk, H. Hofwegen, A. van der Wal, and P. Kager.2003. Value of diagnostic techniques for
cutaneous leishmaniasis. J. Am. Acad. Dermatol.49:70–74.
11.Garcia, A., A. Kindt, K. Quispe-Tintaya, H. Bermudez, A. Llanos, J. Arevalo, A. Banuls, S. De Doncker, D. Le Ray, and J.-C. Dujardin.2005. American tegumentary leishmaniasis: antigen-gene polymorphism, taxonomy and
clin-ical pleomorphism. Infect. Genet. Evol.5:109–116.
12.Garcia, L., A. Kindt, H. Bermudez, A. Llanos-Cuentas, S. De Doncker, J. Arevalo, K. Tintaya, and J. Dujardin.2004. Culture-independent species
typing of neotropicalLeishmaniafor clinical validation of a PCR-based assay
targeting heat shock protein 70 genes. J. Clin. Microbiol.42:2294–2297.
13.Guerra, J. A. O., S. Talhari, M. G. Paes, M. Garrido, and J. M. Talhari.
2003. Clinical and diagnostic aspects of American tegumentary leishmaniosis in soldiers simultaneously exposed to the infection in the Amazon Region.
Rev. Soc. Bras. Med. Trop.36:587–590.
14.Guerra, J. A. O., J. A. S. Ribeiro, L. I. A. R. C. Coelho, M. G. V. Barbosa, and M. G. Paes.2006. Epidemiologia da leishmaniose tegumentar na
Comu-nidade Sa˜o Joa˜o, Manaus, Amazonas, Brasil. Cad Saude Publica22:2319–
2327.
15.Herwaldt, B. L.1999. Leishmaniasis. Lancet354:1191–1199.
16.Lainson, R.1988. Ecological interactions in the transmission of the
leish-maniases. Philos. Trans. R. Soc. B321:389–404.
17.Leone, G., H. van Schijndel, B. Van Gemen, F. Kramer, and C. Schoen.1998. Molecular beacon probes combined with amplification by NASBA enable
homogeneous, real-time detection of RNA. Nucleic Acids Res.26:2150–
2155.
18.Marfurt, J., A. Nasereddin, I. Niederwieser, C. Jaffe, H. Beck, and I. Felger.
2003. Identification and differentiation of Leishmaniaspecies in clinical
samples by PCR amplification of the miniexon sequence and subsequent
restriction fragment length polymorphism analysis. J. Clin. Microbiol.41:
3147–3153.
19.Marfurt, J., I. Niederwieser, N. Makia, H. Beck, and I. Felger.2003. Diag-nostic genotyping of Old and New World Leishmania species by PCR-RFLP.
Diagn. Microbiol. Infect. Dis.46:115–124.
20.Marques, M., A. Volpini, G. Machado-Coelho, J. Machado-Pinto, C. da Costa, W. Mayrink, O. Genaro, and A. Romanha.2006. Comparison of polymerase chain reaction with other laboratory methods for the diagnosis of American cutaneous leishmaniasis: diagnosis of cutaneous leishmaniasis by
polymerase chain reaction. Diagn. Microbiol. Infect. Dis.54:37–43.
21.Mary, C., F. Faraut, L. Lascombe, and H. Dumon.2004. Quantification of
Leishmania infantumDNA by a real-time PCR assay with high sensitivity.
J. Clin. Microbiol.42:5249–5255.
22.Meredith, S. E., E. E. Zijlstra, G. J. Schoone, N. C. M. Kroon, G. J. van Eys, K. U. Schaeffer, A. M. el-Hassan, and P. G. Lawyer.1993. Development and application of the polymerase chain reaction for the detection and
identifi-cation ofLeishmaniaparasites in clinical material. Arch. Inst. Pasteur Tunis
70:419–431.
23.Mertens, P., L. Vijgen, C. Olungu, S. Degallaix, I. Renuart, M. Van Ranst, and T. Leclipteux.2004. Detection of SARS-CoV by oligochromatography
of RTPCR amplicons. Clin. Microbiol. Infect.10:526–527.
24.Nicolas, L., G. Milon, and E. Prina.2002. Rapid differentiation of Old World
Leishmaniaspecies by LightCycler polymerase chain reaction and melting
curve analysis. J. Microbiol. Methods51:295–299.
25.Oliveira, C., A. Fabica, F. Oliveira, C. Favali, T. Correa, L. Freitas, E. Nascimento, J. Costa, and A. Barral.2003. Clinical utility of polymerase
chain reaction-based detection ofLeishmaniain the diagnosis of American
cutaneous leishmaniasis. Clin. Infect. Dis.2003:149–153.
26.Reithinger, R., and J.-C. Dujardin.2007. Molecular diagnosis of
leishman-iasis: current status and future applications J. Clin. Microbiol.45:21–25.
27.Rolao, N., S. Cortes, O. Rodrigues, and L. Campino.2004. Quantification of Leishmania infantum parasites in tissue biopsies by real-time polymerase chain reaction and polymerase chain reaction-enzyme-linked
immunosor-bent assay. J. Parasitol.90:1150–1154.
28.Schneider, P., L. Wolters, G. Schoone, H. D. F. H. Schallig, R. Hermsen, P. Sillekens, and R. Sauerwein.2005. Real-time nucleic acid sequence-based amplification is more convenient than real-time PCR for quantification of
Plasmodium falciparum. J. Clin. Microbiol.43:402–405.
29.Schoone, G., L. Oskam, N. Kroon, H. Schallig, and S. Omar.2000. Detection
and quantification ofPlasmodium falciparumin blood samples using
quan-titative nucleic acid sequence-based amplification. J. Clin. Microbiol. 38:
4072–4075.
30.Schulz, A., K. Mellenthin, G. Scho¨nian, B. Fleischer, and C. Drosten.2003.
Detection, differentiation, and quantitation of pathogenicLeishmania
organ-isms by a fluorescence resonance energy transfer-based real-time PCR assay.
J. Clin. Microbiol.41:1529–1535.
31.Smith, C. J., D. B. Nedwell, L. F. Dong, and A. M. Osborn.2006. Evaluation of quantitative polymerase chain reaction-based approaches for determining gene copy and gene transcript numbers in environmental samples. Environ.
Microbiol.8:804–815.
32.Van der Meide, W. F., G. J. Schoone, W. R. Faber, J. E. Zeegelaar, H. J. de Vries, Y. Ozbel, R. F. Lai A Fat, L. I. Coelho, M. Kassi, and H. D. Schallig.
2005. Quantitative nucleic acid sequence-based assay as a new molecular tool
for the detection and quantification ofLeishmaniaparasites in skin biopsies.
J. Clin. Microbiol.43:5560–5566.
33.Van Eys, G. J. J. M., G. J. Schoone, N. C. M. Kroon, and S. B. Ebeling.1992. Sequence analysis of small subunit ribosomal RNA genes and its use for
detection and identification ofLeishmaniaparasites. Mol. Biochem.
Parasi-tol.51:133–142.
34.World Health Organization.1990. Control of the leishmaniasis. WHO Tech.
Rep. Ser.793:1–158.
35.Wortmann, G., C. Sweeney, H. Houng, N. Aronson, J. Stiteler, J. Jackson, and C. Ockenhouse.2001. Rapid diagnosis of leishmaniasis by fluorogenic
polymerase chain reaction. Am. J. Trop. Med. Hyg.65:583–587.